BBMA Entry Alert Signal
- インディケータ
-
Adi Prizandi
 I am Trader and programming Trade
 - バージョン: 1.0
- アクティベーション: 5
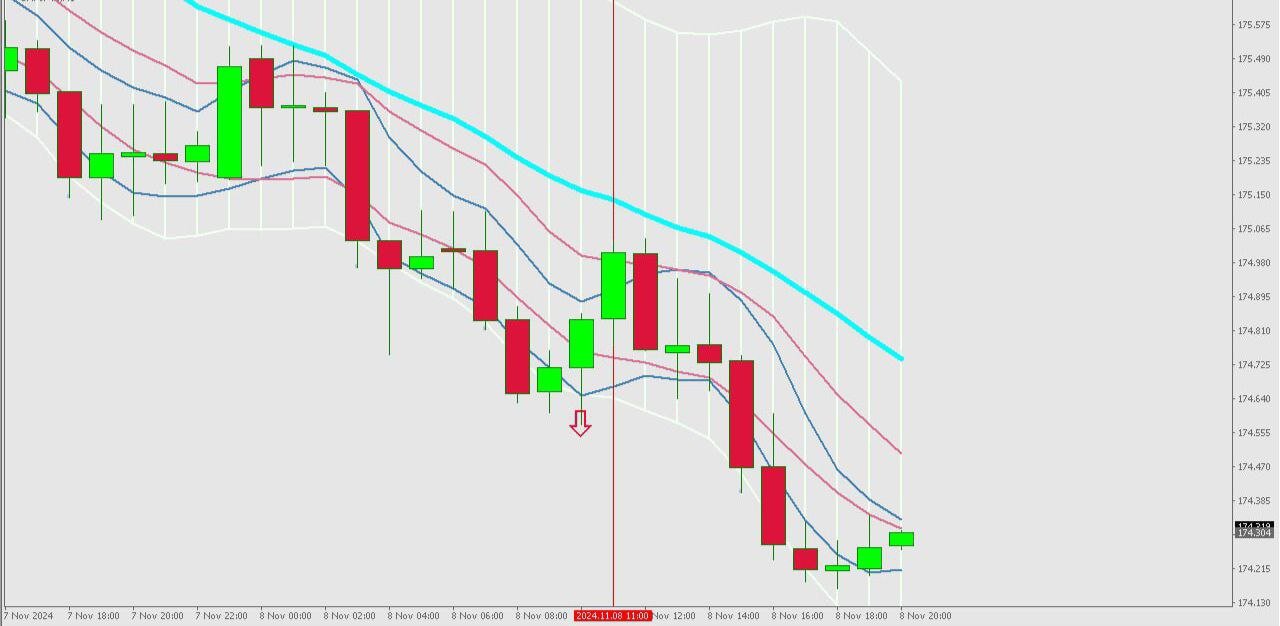
Signal Entry BBMA
Low Risk High Reward Entry
Friendly Use
Using Fibo for TP 1, TP 2 , TP 3 , TP 4, TP 5, TP 6 , TP 7 , TP 8 , TP 9 , TP 10
Entry Low MA or Entry High MA
Pair GOLD is The Best
Pair EURUSD, GBPUSD, USDJPY Is Good
Pair BTCUSD id Good
Risk Manajemen only 1% entry and you get Profit 2-10%
Recommended Broker https://one.exnesstrack.org/a/yyatk129ng
If you want FullMargin Is Good but I recommended using Manajemen your Money