無料でロボットをダウンロードする方法を見る
Telegram上で私たちを見つけてください。
私たちのファンページに参加してください
私たちのファンページに参加してください
記事を気に入りましたか?MetaTrader 5ターミナルの中でそれを試してみてください。
- ビュー:
- 45003
- 評価:
- パブリッシュ済み:
- アップデート済み:
-
このコードに基づいたロボットまたはインジケーターが必要なら、フリーランスでご注文ください フリーランスに移動
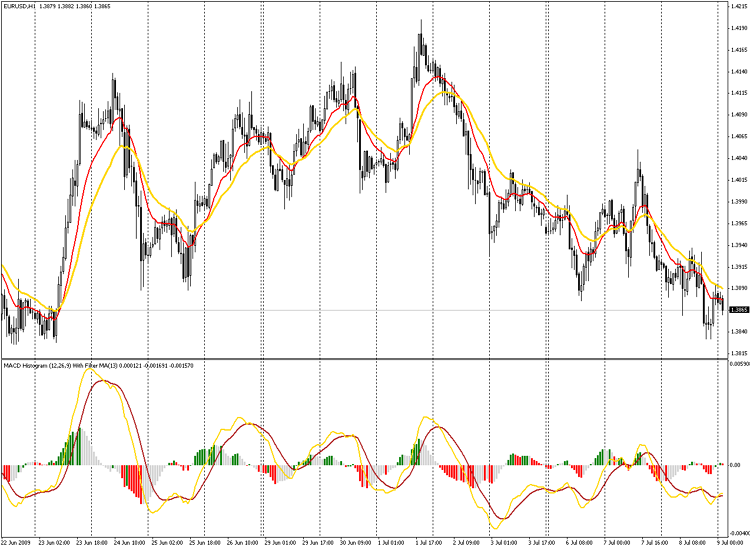
MACD lines and histogram for the Impulse trading system.
The idea:- Histogram down (current value less than previous) and line (specified by Line input) does down, the histogram is red - long trades are prohibited;
- Histogram up (curerent value greater than previous) and line up, the histogram is green - short trades are prohibited;
- Histogram down and line up (or reverse case) histogram is grey -no restrictions;
The Inertia is defined by Line input parameter:
- 0 - MA(MAPeriod);
- 1 - MACD line;
- 2 - Signal signal line.
Other input parameters:
- FastMA - Period of Fast Moving Average;
- SlowMA - Period of Slow Moving Average;
- SignalMA - Period of the Signal Line;
- MAPeriod - Period of Moving Average if Line = 0;
- MAMethod - Averaging Method (MODE_EMA by default);
- MAAppliedPrice - Applied Price (PRICE_CLOSE by default);
- Line - described above;
- DigitsInc - Precision format Digits + DigitsInc

 VisualOpenOrderWithMM
Drag & Drop the script at chart on point where StopLoss should stay. Script will compare desired StopLoss with the current price and determine the type of the order - Buy or Sell. The next step is calculating the volume according Free Margin and the Risk
 Spectr
Spectr