 Trading")

If you've been trading gold, you've probably experienced this:
"I'm using the same strategy, but sometimes I win and sometimes I lose."
It's not your strategy that's broken. You're just not filtering the right setups from the wrong ones.
After 12 years of trading XAUUSD, I've identified 3 high-probability patterns and 2 patterns you should skip every time. Knowing the difference completely changed my win rate — and it will change yours too.
Winning Pattern #1: 75MA / 100MA Touch During a Trend
This is the highest win-rate setup I've found.
When gold is in a strong trend and price pulls back deep — all the way to the 75 or 100 SMA — that's your signal. The short-term sellers are exhausted. Institutional buyers step in at these levels.
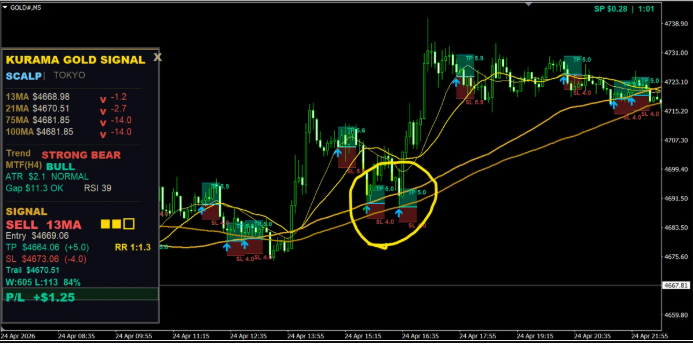
Why it works:
The 75 and 100 SMAs are watched by institutional traders and funds. When price reaches these levels, the correction is mature. Weak hands have already sold. Smart money starts buying.
This setup doesn't happen often — maybe once or twice a day — which is exactly why it's so reliable when it does appear.
How to confirm:
- The MA must have a clear slope. A flat MA means ranging — avoid it
- Price must show a reaction at the touch (rejection candle, wick)
- H4 trend direction must align with your entry
When this pattern appears: enter without hesitation.
Winning Pattern #2: 21MA Touch During Perfect Order
Perfect Order = SMA 13, 21, 75, 100 all aligned in sequence (all sloping up for buys, all sloping down for sells). This confirms a clean, strong trend.
In this state, price pulls back to the 21 SMA and bounces. This is the "textbook" setup.
It's a shallower pullback than Pattern #1, but the trend momentum is strong. As long as Perfect Order holds, the 21MA acts as dynamic support/resistance.
How to confirm:
- Perfect Order must be intact. If 13MA crosses below 21MA, be cautious
- 21MA slope must be steep — a gentle slope means momentum is fading
- Avoid entries right after major news releases
This pattern is especially effective for M5 scalping. Take 5-10 pips and get out. Don't be greedy.
Winning Pattern #3: Trend Breakout at Session Open
Gold barely moves during the Asian session. Price consolidates in a $5-$10 range.
Then London opens — and breaks that range.
The breakout direction often produces a $20-$30 move. This is your M15 day trade setup.
How to confirm:
- Wait 15-30 minutes after London open. The first move is often a fake breakout
- Confirm that MAs are aligning in the breakout direction
- The tighter the Asian range, the bigger the breakout tends to be
This pattern gives you the best risk-reward ratio of all three.
Pattern to AVOID #1: 13MA First Touch with Extreme RSI
This is where most traders lose money.
When RSI is below 30 (oversold) or above 70 (overbought), and price touches the 13MA for the first time — do NOT enter.
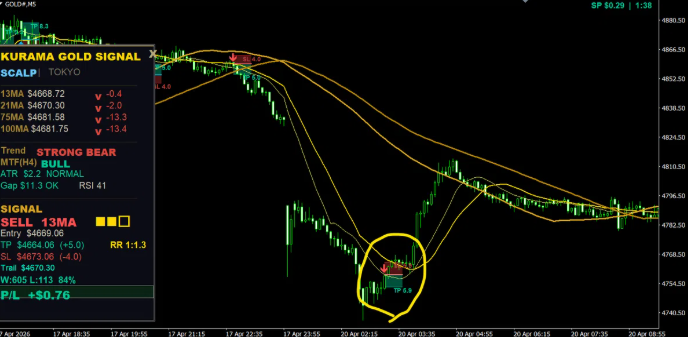
Why it's dangerous:
Extreme RSI means price has moved aggressively in one direction. The momentum hasn't dissipated yet. The 13MA touch looks like a pullback entry, but price often blows right through it (overshoot).
Gold's volatility makes this especially painful. You enter at the 13MA touch and instantly see $10+ adverse movement.
The rule is simple: If RSI is extreme, skip the first 13MA touch. Wait for a deeper pullback to 21MA or 75MA instead.
This single filter will eliminate a huge number of losing trades.
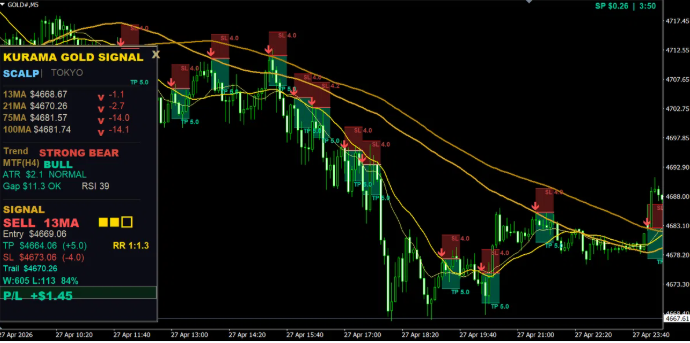
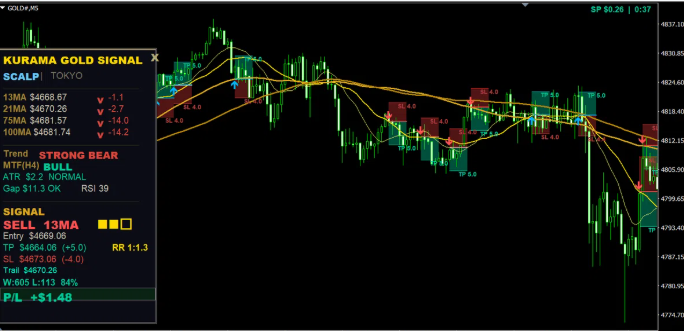
Pattern to AVOID #2: Any Signal During a Range
MAs are flat. Price is chopping back and forth above and below the moving averages. This is a range.
Signals during a range have a very high failure rate.
MA-based strategies work because trends create reliable bounces at MA levels. No trend = no bounce. The MA becomes just a line that price walks through.
How to identify a range:
- MAs are nearly horizontal
- 13MA and 21MA are crossing each other frequently
- Price alternates above and below the MAs with no direction
When you see this: close the chart. Come back when a trend starts. There's no edge in a range.
Can You Actually Spot These in Real-Time?
Be honest with yourself. In the heat of live trading, can you simultaneously check MA slopes, RSI levels, Perfect Order status, session timing, and volatility conditions — and then make a calm, rational entry decision?
It's hard. And even if you can identify the right setup, emotions will sabotage you. You'll see a "skip" pattern and think "maybe this time it's different" — and enter anyway. We've all been there.
How KURAMA GOLD SIGNAL PRO Helps
I built KURAMA GOLD SIGNAL PRO (KGS) to solve exactly this problem.
It doesn't just give you entry arrows. It runs 7 independent filters that evaluate market conditions in real-time:
- RSI Filter — blocks signals at extreme RSI levels
- MA Angle Filter — blocks signals when MAs are flat (range)
- Trend Direction Filter — blocks signals against the trend
- ATR Filter — blocks signals during abnormal volatility
- H4 MTF Filter — blocks signals against higher timeframe trend
- Session Filter — identifies optimal trading windows
- Convergence Filter — detects dangerous MA clustering
Every signal gets a Quality Score (★ to ★★★):
- ★★★ = All conditions perfect. Enter with confidence
- ★★ = Conditions good. Normal entry
- ★ = Conditions weak. Reduce size or skip
The "avoid" patterns I described above? They typically produce ★ signals — giving you a clear visual cue to stay out.
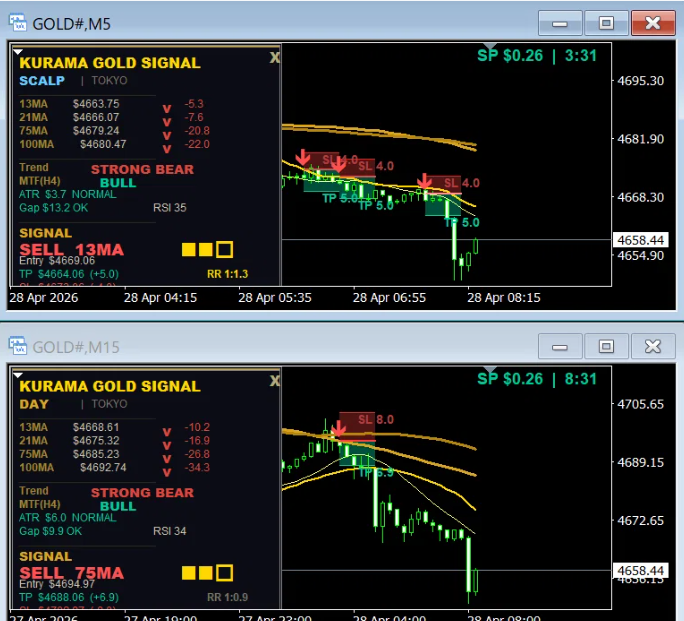
KGS displays everything on your chart:
- Entry point → Arrow signal
- TP/SL → Green and red zones with pip values
- Signal reliability → ★ to ★★★ quality rating
- Trend direction → Info panel
- ATR, RSI, Session → All on the panel
Your job becomes simple: only enter ★★ and ★★★ signals. That's it. Your losing trades will drop dramatically.
Summary
3 Winning Patterns:
- 75MA/100MA touch in a trend → High win-rate deep pullback
- 21MA touch during Perfect Order → Reliable scalp setup
- Session breakout at London open → Best risk-reward
2 Patterns to Skip:
- 13MA touch with extreme RSI → Overshoot risk
- Any signal in a range → MAs don't work without trend
Knowing the winning patterns alone isn't enough. You need to know what to avoid. Both together is what makes your trading consistent.
KGS handles the pattern detection, the filtering, and the TP/SL calculation — all automatically, right on your chart. It's not perfect. Nothing is. But it's far more accurate than trying to process everything manually in real-time.
Try KURAMA GOLD SIGNAL PRO
Stop guessing. Let the 7-layer filter system do the heavy lifting — so you can focus on executing only the highest-quality setups.
Available on MQL5 Market (buy or rent monthly):
MT4 version: https://www.mql5.com/en/market/product/170617
MT5 version: https://www.mql5.com/en/market/product/170916
Both versions include auto TP/SL display, quality scoring (★ to ★★★), session detection, trend panel, and alert notifications. Try the 1-month rental first — if it improves your trading, keep it. If not, you've only risked one month.
Questions? Feel free to message me directly through MQL5.


