MACD Divergence Indicator MT5
- Indicatori
- Versione: 2.4
- Aggiornato: 4 settembre 2022

MACD divergence indicator finds divergences between price chart and MACD indicator and informs you with alerts (popup, mobile notification or email). Its main use is to find trend reversals in the chart.
Always use the divergence indicators with other technical assets like support resistance zones, candlestick patterns and price action to have a higher possibility to find trend reversals.
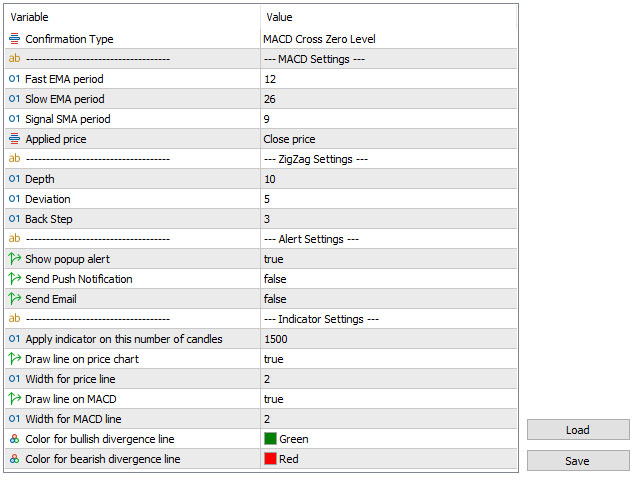
Three confirmation type for MACD divergences:
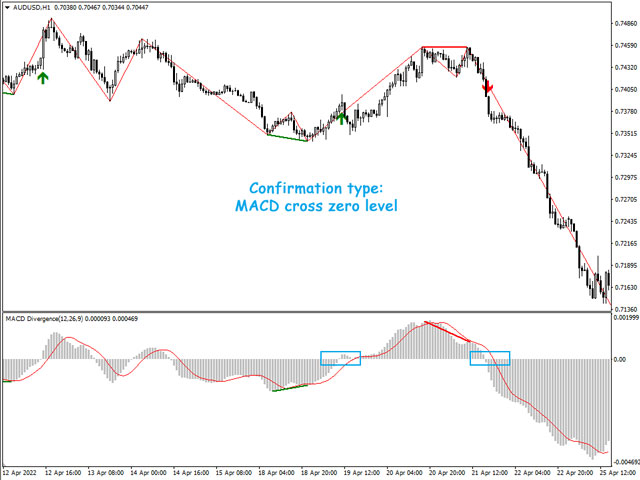
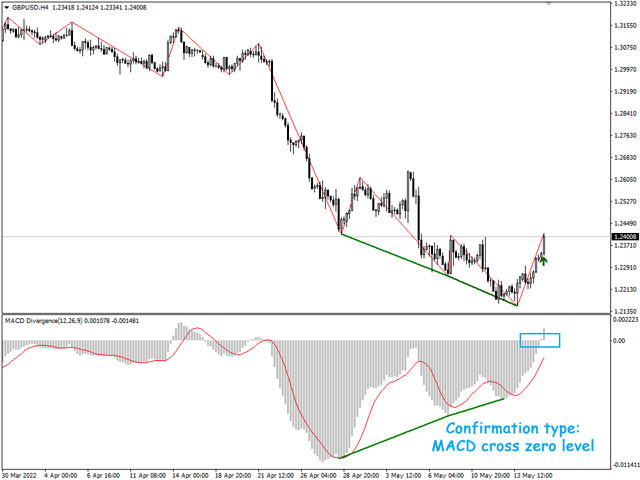
- MACD line cross zero level
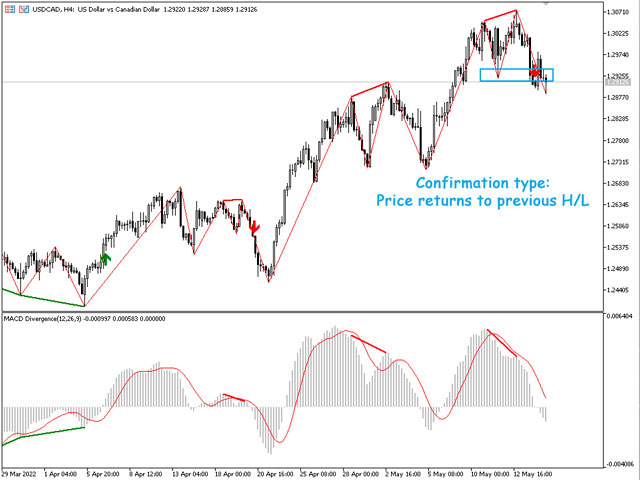
- Price returns to previous H/L
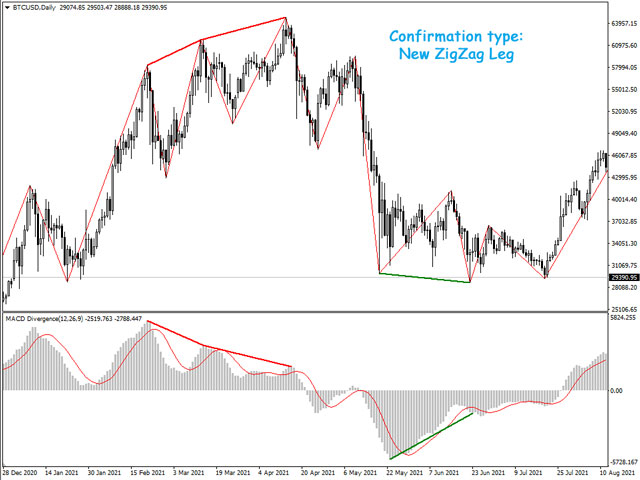
- Creating a new ZigZag leg in price chart
When divergence is confirmed, the indicator draws an arrow on the chart (not for the new ZigZag leg confirmation type).
This indicator uses ZigZag indicator to determine trend direction and HH/LL of the price, you can change the ZigZag parameters in the indicator's input window. You can add the ZigZag Indicator to your chart template to have a better look of painted divergences.
You can use indicator's divergence type buffer in your expert advisors.
You can check out the multi-timeframe/multi-symbol version of this indicator from this link.


素晴らしいインジケーターです。