Tillson TMA T3
- 지표
- 버전: 1.10
- 업데이트됨: 7 3월 2023

TILLSON MOVING AVERAGE
Also known as TMA or T3 indicator. It is a moving average that uses EMA and DEMA in its formula and is calculated with the 3rd degree Binomial expansion.
   ...
   int     handle1;     //Handle of the Tillson TMA T3.EX5 custom indicator
   double  euBuff1[];
   int TMAperiod=12;
   int TMSshift=0;
   double VolumeFactor=0.618;

int OnInit()
   {
   ...
   handle1=iCustom(NULL,PERIOD_CURRENT,"Market\\Tillson TMA T3.EX5",0,TMAperiod,0,0,TMSshift,0,0,VolumeFactor);
   ArrayResize(euBuff1,5); //Set a new array size specifying the reserve of 5 elements!
   ArraySetAsSeries(euBuff1,true);
   ...
   }

//Code to use in indicators
int OnCalculate(..........)
   {
   ...
   CopyBuffer(handle1, 0, 0, 4, euBuff1); //Copy the values of the indicator Tillson TMA T3 to our indicator buffer
   printf (euBuff1[3]);
   ...
   }

//Code to use in Expert Advisors
void OnTick()
   {
   ...
   CopyBuffer(handle1, 0, 0, 4, euBuff1); //Copy the values of the indicator Tillson TMA T3 to our indicator buffer
   printf (euBuff1[3]);
   ...
   }


void OnDeinit(const int reason)
  {
   ...
  IndicatorRelease(handle1);  //free the handle of the indicator
  }
Pros;
1- erroneous signals encountered in other moving averages ( continuous zig zag ) has been reduced as much as possible.
2- prevented the delays seen in classical moving averages .
3- Very successful in trends
Cons
1- It is not effective in horizontal markets.
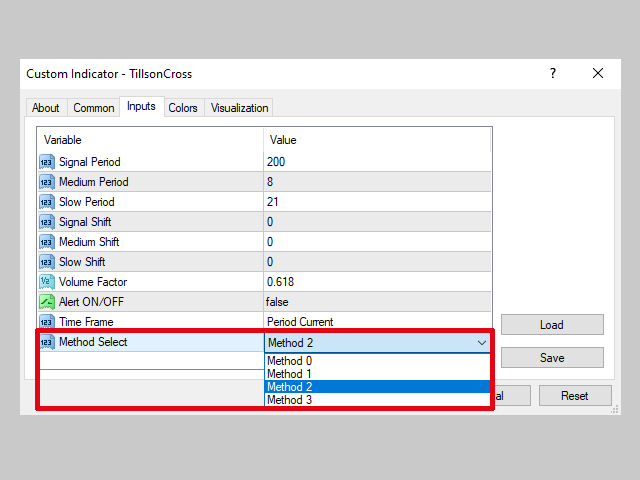
Setting parameters;
period ; Although the recommended value is 5, values of 7 or 8 can also be used.
Volume Factor ; The range of 0 to 1 is the recommended value range, but it can go up to a maximum of 2. The recommended value is 0.7 . To explain the effect of Volume Factor on T3 more simply, if it takes values close to 0, it will cause it to exhibit similar behavior to EMA, and if it takes values close to 1, it will show similar behavior to DEMA.
BUY/SELL Signals;
Method 1; A strategy in which 1 T3 is used,
Volume Factor = 0.7, Period = 8 and above.
- BUY signal if bars cross T3 up
- If the bars cut T3 down SELL signal
Method 2; A strategy using 2 T3's,
- Small Period T3 cutting Big Period T3 from bottom to top BUY signal
- Small Period T3 cuts Big Period T3 from top to bottom SELL signal
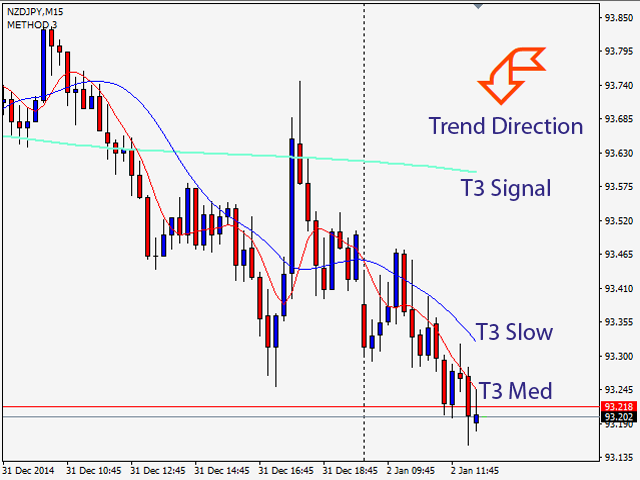
Method 3; A strategy using 3 T3's,
It consists of adding a third trend-setting T3 to Method 2. Default values; Period1=200, Period2=8, Period3=21 and Volume Factor =0.7
T3 with period1=200 will be the trend direction determinant. In other words, when small period T3's are above 200's T3, the trend will be considered as up and only BUY signals will be considered according to Method 2 . Likewise, when small period T3's are below 200's T3, the trend will be considered as up and only SELL signals will be considered according to Method 2 .


It is a very good indicator if used correctly as described. Thank you.