PZ Lopez Pressure MT5

Your swiss army knife to ancipate price reversals

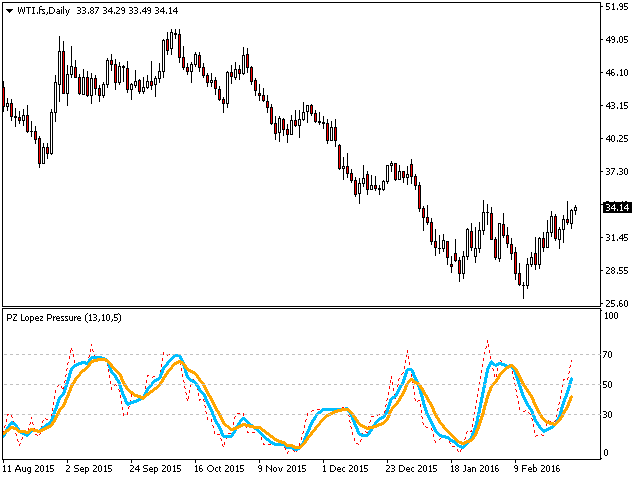
This indicator anticipates price reversals analyzing bullish and bearish pressure in the market. The buying pressure is the sum of all the accumulation bars over a certain number of days, multiplied by the volume. The selling pressure is the sum of all of the distribution over the same number of bars, multiplied by the volume. It gives you a measure of the buying pressure as a percentage of the total activity, which value should fluctuate from 0 to 100. It implements two moving averages, fast and slow, to identify changes in pressure trends and look for trades accordingly.

[ Installation Guide | Update Guide | Troubleshooting | FAQ | All Products ]

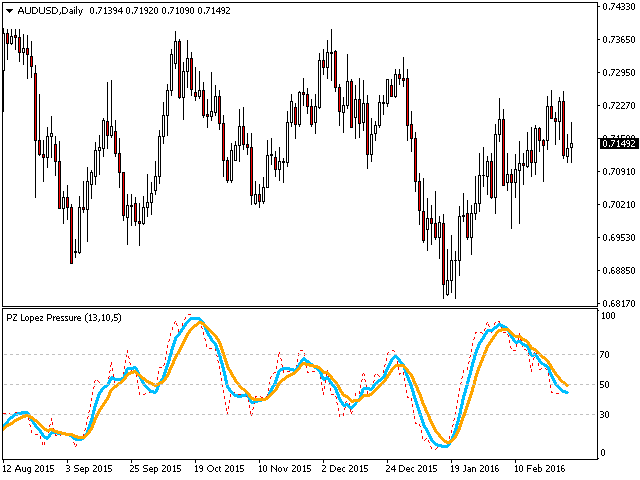
  • A ratio of 50 means the market is balanced
  • A ratio over 70 means the market is overbought
  • A ratio below 30 means the market is oversold
  • The red dotted line is the current ratio
  • The blue line is the signal line
  • The orange line is the main line

It has straightforward trading implications.

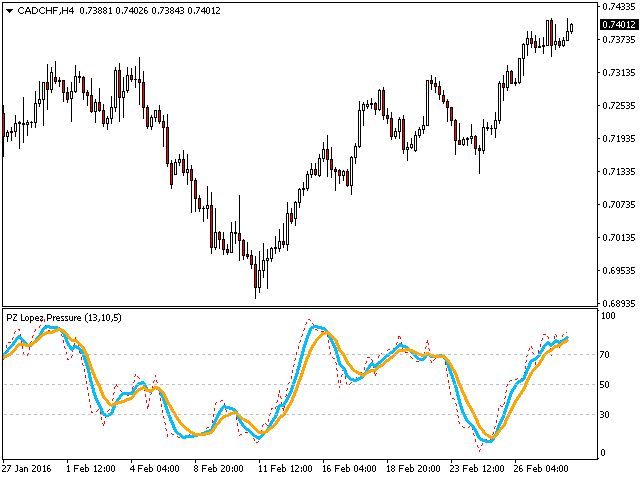
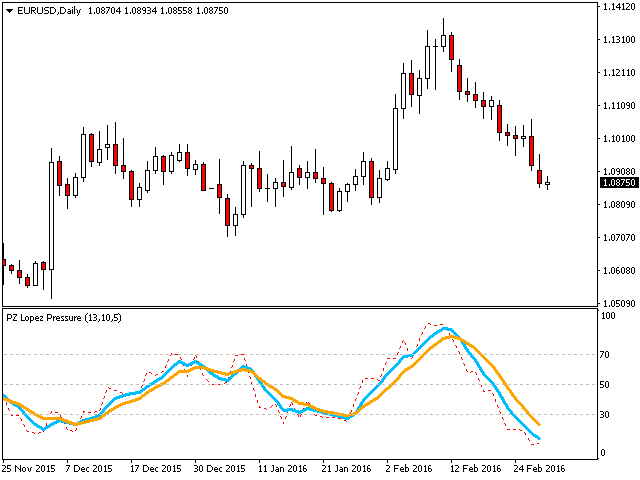
  • Look for buying opportunities when the market is oversold
  • Look for selling opportunities when the market is overbought
  • If the signal line is above the main line the pressure is bullish
  • If the signal line is below the main line the pressure is bearish


Input Parameters

  • Period: Number of bars studied to calculate the pressure
  • Fast MA: Fast averaging period for the histogram
  • Slow MA: Slow averaging period for the histogram

Author

Arturo López Pérez, private investor and speculator, software engineer and founder of Point Zero Trading Solutions.


Prodotti consigliati
VWAP Cloud
Flavio Javier Jarabeck
4.1 (10)
Do you love VWAP? So you will love the VWAP Cloud . What is it? Is your very well known VWAP indicator plus 3-levels of Standard Deviation plotted on your chart and totally configurable by you. This way you can have real Price Support and Resistance levels. To read more about this just search the web for "VWAP Bands" "VWAP and Standard Deviation". SETTINGS VWAP Timeframe: Hourly, Daily, Weekly or Monthly. VWAP calculation Type. The classical calculation is Typical: (H+L+C)/3 Averaging Period to
FREE
Trend Strength Analyzer
Andrey Sorokin
4.8 (5)
The technical indicator Trend Strength Analyzer measures the deviation of the price of an instrument from average values ​​over a specific period of time. A comparative analysis of the relative strength of bulls and bears underlies the indicator. If bulls prevail, an upward trend. If bears are stronger - a downward trend.      Settings: Strike Energy (2 solid lines) = 14. Influence Power (2 dotted lines) = 50. The TSA oscillator is effective in an active market. The most commonly used indicator
FREE
Daily HiLo
Nicanor Jr Cagape Layco
DailyHiLo Indicator Master the daily range like a pro. This indicator automatically plots the previous day’s high and low levels —a core element in the (Beat The Market Maker) trading approach—directly on your chart. These levels act as natural boundaries for intraday price action, helping traders identify potential reversal zones, breakout points, and liquidity targets. Key Features Accurate plotting of yesterday’s high and low for any symbol and timeframe. Works seamlessly with BTMM-inspired
FREE
VFI Quantum
Nikita Berdnikov
5 (1)
Introducing VFI (Volume Flow Indicator) – a trading indicator that analyzes the relationship between volume and price movement to identify key trading opportunities. The indicator displays the strength and direction of volume flow, providing clear signals about potential entry and exit points. Signals are formed based on zero line crossovers, crossovers between the VFI line and its exponential moving average (EMA), and when the indicator exits overbought and oversold zones. Attention! This stra
FREE
Graphic Alignment Context
Ricardo Alexandre Laurentino
The Graphic Alignment Context (GAC) Technical Indicator measures the vertical difference of the simple average price of a financial instrument in the context of three different timeframes determined by a defined number of bars or candles (periods) to determine the strength of the buy or sell trend. sale. Ascending average prices indicate Buying strength (1), Descending average prices indicate Selling strength (-1) and any scenario different from the previous two conditions indicates Neutrality
FREE
FT ADX Color Candles
FELIPE MISAEL MORAES KRUGER
5 (7)
Trading can be quite tiring when you need to look at several things at the same time. Format of candles, supports, resistances, schedules, news and indicators. This tool aims to facilitate the analysis of the ADX indicator. It colors the candles based on the levels of the indicator and the DI lines. The period, the limit of the indicator and the colors of the candles are customizable. You can also place a visual aid on the lower right side of the graph to view the values of ADX, DI + and DI-
FREE
Pivot Reversal Free
Fyodor Korotkov
5 (1)
Hi there! Since I am starting commercial and non-commercial product publishing I would highly appreciate: If you like this product, please rate it. That will help to promote not only this product, but indirectly another ones. So, such promotion will help to make some money from commercial products. Thus, I will have opportunity to fund my another directions of trading researches like bot development using mql4 and mql5 programming languages as well as python written products like crypto bots. If
FREE
Vegas indicador
Valter Cezar Costa
3.5 (2)
Esse Indicador é uma boa opção para quem gosta de operar a longo prazo e com paciência. Ele trabalho com os níveis de fibo na media de 200 são  9 níveis  onde você pode operar nas reversões o mercado partir do níveis abaixo.    Level 1 = 550 pontos    Level 2 = 890 pontos    Level 3 = 1440 pontos    Level 4 = 2330 pontos    Level 5 = 3770 pontos    Level 7 = 9870 pontos    Level 8 = 15970 pontos   Level 9 = 25840 pontos      Level 6 = 6100 pontos
FREE
Color Trend
Bruno Goncalves Mascarenhas
Combining the best of Price Action , Directional Movement , and Divergence / Convergence analysis, the Candle Color Trend is the easy and reliable way to identify the direction of the trend. The indicator automatically paints the candles according to the premise that the upward trend is defined by prices that form a series of ascending tops and bottoms. On the other hand, the downward trend is defined by prices that form a series of descending tops and bottoms. Color Trend is certainly one of
FREE
Smart Flow Bands
Mohamad Sami Taleb
How the Sell Signal Works 1. Bollinger Band condition The current candle must close at or above the Upper Bollinger Band . This signals potential overbought conditions. 2. OBV confirmation (On Balance Volume) OBV must be falling → OBV_now < OBV_prev . Stronger confirmation: OBV decreasing for 2–3 consecutive bars. This shows that buying pressure is weakening . 3. ATR filter (Average True Range) Current ATR must be below its moving average (e.g., ATR_now < ATR_SMA(14) * 1.2 ). Purpose: avoid ente
FREE
TilsonT3
Jonathan Pereira
5 (1)
Tillson's T3 moving average was introduced to the world of technical analysis in the article ''A Better Moving Average'', published in the American magazine Technical Analysis of Stock Commodities. Developed by Tim Tillson, analysts and traders of futures markets soon became fascinated with this technique that smoothes the price series while decreasing the lag (lag) typical of trend-following systems.
FREE
Strong movement levels
Nikolay Mitrofanov
5 (2)
Looks for strong price movements and draws levels upon their completion. You determine the strength of the movement yourself by specifying in the settings the number of points and the number of candles of the same color in a row in one direction. There are 2 types of building in the settings: extrenum - high / low close - close price You can also adjust the number of displayed levels and the number of candles for calculations. By default, the settings indicate 5 levels for 360 candles. That
FREE
Touch VWAP MT5
Danrlei Hornke
4.8 (5)
O Touch VWAP é um indicador que permite calcular uma Média Ponderada por Volume (VWAP) apenas apertando a tecla 'w' no seu teclado e após clicando no candle do qual deseja realizar o calculo, clicando abaixo do candle é calculada a VWAP baseado na minima dos preços com o volume, clicando sobre o corpo do candle é calculado uma VWAP sobre o preço medio com o volume e clicando acima do candle é calculado uma VWAP baseado na máxima dos preços com o volume, voce tambem tem a opção de remover a VWAP
FREE
Lows And Highs
Ali Gokay Duman
5 (5)
This indicator draws the highest and the lowest prices of the previous periods on the chart. And If you want, Indicator can alert you when the current price arrives   these levels. For example: If you are watching the H1 timeframe, Indicator shows you the  lowest and the highest prices of H4, D1, W1 and M1 periods. So you don't need to open the other periods of chart windows. Alert Options: Send Mobil Message, Send E-mail, Show Message, Sound Alert Time Periods:  M1, M5, M15, M30, H1, H2, H3, H
FREE
MAM Forecast Indicator
Matei-Alexandru Mihai
Overview MAM Forecast is an indicator designed to replace guesswork with probabilities. It generates two adaptive levels—UP and DN—along with probabilities that always sum to 100%, giving you a clear idea of which level price is more likely to reach within the chosen horizon. Key Features Displays UP (upper) and DN (lower) adaptive levels calibrated to market volatility. Shows touch probabilities (e.g., 62% vs 38%) for likelihood within the defined horizon. Clean, informative HUD indicates sym
FREE
Hilo Power
Dorival Cardozo
HiloPower – Advanced Trend and Market Strength Indicator for MetaTrader 5 HiloPower is not just another trend indicator developed from the traditional Hi-Lo. It was designed to offer a more complete and intelligent reading of the market, combining direction, strength, and intensity of movements. With it, the trader can see not only where the price is going, but also how strong and volatile that movement really is.
FREE
Nyse Usdxy
Mitchell Dean Ede
5 (1)
Displays a USD DXY chart in a seperate window below the main chart. YOUR BROKER MUST HAVE THESE SYMBOLS FOR THE INDICATOR TO WORK Based on EUR/USD, USD/JPY, GBP/USD, USD/CAD, USD/CHF and USD/SEK All these pairs must be added to Market Watch for the indicator to work correctly As this is calculated using a formula based on the 6 pairs it will only work when the market is open. YOUR BROKER MUST HAVE THESE SYMBOLS FOR THE INDICATOR TO WORK Displays a USD DXY chart in a seperate window below the m
FREE
Rejection Zones
Paulo Henrique Faquineli Garcia
Este poderoso indicador analisa o gráfico e mostra zonas de Rejeição de Preços! Isto é, locais onde o preço foi, mas não foi aceito pelo mercado! A visualização desta zona de Rejeição, facilita o entendimento do trader na tomada de decisões de onde operar e como operar! O indicador é composto por 4 linhas, sendo classificadas em 2 grupos: Linhas Vermelha e Amarela: Denotam os extremos onde o preço conseguiu chegar, mas não foi aceito! Linhas Laranja e Azul: A partir delas, denotam o Início da z
FREE
RSI abcd
Francisco Gomes Da Silva
3 (1)
RSI ABCD Pattern Finder: Strategia Tecnica 1. Come Funziona l'Indicatore Combina il RSI classico con il rilevamento automatico di pattern armonici ABCD . Componenti Principali RSI standard (periodo regolabile) Marcatori di massimi e minimi (frecce) Pattern ABCD (linee verdi/rosse) Filtri ipercomprato (70) e ipervenduto (30) 2. Configurazione su MT5 period = 14 ; // Periodo RSI size = 4 ; // Dimensione massima del pattern OverBought = 70 ; // Livello ipercomprato OverSold = 30 ; // Livello iperve
FREE
Introducing the AI Keltner Channel , a cutting-edge Forex indicator that leverages machine learning to dynamically calculate Keltner Channels in real-time. Unlike traditional Keltner Channel indicators, which rely on static inputs, the AI Keltner Channel adapts continuously to ever-changing market conditions, providing traders with a more accurate and responsive view of price trends and volatility. Powered by advanced machine learning algorithms, the AI Keltner Channel analyzes historical and re
FREE
BullBea Display
Everton Fernando Da Silva Messias
1. INFORMAZIONI GENERALI Nome Indicatore:   BullBear Display Versione:   1.00 Sviluppatore:   [Il Tuo Nome] Società:   MT5TOOLSLAB Tipo:   Indicatore di Grafico Mercato:   Forex, Azioni, Futures, Criptovalute 2. DESCRIZIONE BullBear Display   è un indicatore visivo che mostra in tempo reale: Forza dei tori (compratori) Forza degli orsi (venditori) Dominanza del mercato (chi controlla il prezzo) L'indicatore mostra queste informazioni nell'angolo superiore sinistro del grafico, consentendo un'an
(Special New Year promotion - free price!) The indicator displays the actual 'Scale in points per bar' (identical to the manual setting in the Terminal, see screenshot) in the upper right corner of the chart. The displayed value changes INSTANTLY whenever the chart scale is changed! (This is very convenient when planning screenshots). In Settings: Change language (Russian/English), font size of the displayed text, text label offset coefficient from the graph corner, equally in X and Y directi
FREE
Trendy Stocks
Innovicient Limited
5 (2)
Trendy Stock is a price following indicator that uses Stochastic to show when the price is out of the oversold or overbought areas.  The algorithm allows you to stay longer in a trend where the bulls or bears are in control. The indicator changes color immediately the price exits oversold/overbought state. In short, the downtrend [red] bars start to paint when the buying pressure decreases while the uptrend [green] bars form as the buy pressure kicks in.    For MT4 version, follow :: https://www
FREE
Pivot Classic, Woodie, Camarilla, Fibonacci and Demark Floor/Classic I punti pivot, o semplicemente pivot, sono utili per identificare potenziali livelli di supporto/resistenza, range di trading, inversioni di tendenza e sentiment di mercato esaminando i valori massimi, minimi e di chiusura di un asset. I Pivot Point Floor/Classic possono essere calcolati come segue. Pivot Point (P) = (High + Low + Close)/3 S1 = P * 2 - High S2 = P - (High - Low) S3 = Low – 2*(High - P) R1 = P * 2 - Low R2 = P +
FREE
Dark Bands MT5
Marco Solito
4.89 (281)
Dark Bands   is an Indicator for intraday trading. This Indicator is based on Counter Trend  strategy but use also Volatility. We can enter in good price with this Indicator, in order to follow the inversions on the current instrument. Key benefits Easily visible take profit/stop loss lines Reliable bands lines with futuristic colors, and  Intuitive directional arrows Useful statistics , which indicate the win rate of the signals Plus Package  available, leave a feedback to receive it for fr
FREE
Supertrend Line
Flavio Javier Jarabeck
4.87 (23)
The Supertrend indicator was originally created by a french fellow named Olivier Seban , and its goal is to identify the Primary Trend of prices . Its calculation is easy and based on the average of Highs and Lows and then we add the volatility of a custom period, plus a multiplier. This way we get the Supertrend Line. You can find in the web several approaches and trading strategies using this very useful indicator. HOW TO "READ" THIS INDICATOR If the closing prices are above Supertrend Line,
FREE
Quarter EMA
Jithin Sajan Sajan
5 (2)
Kindly rate and comment about the product for upgradation & Support The 5 EMA is plotted in green color ( Lime ). The 14 EMA is plotted in red color ( Red ). The 20 EMA is plotted in blue color ( Blue ). The 200 EMA is plotted in yellow color ( Yellow ). The Quarter EMA that provided calculates and plots four Exponential Moving Averages (EMAs) on the chart using different periods: 5, 14, 20, and 200. Each EMA is represented by a different color on the chart. Here's a description of each EMA:
FREE
Quintet EMA
Jithin Sajan Sajan
Kindly rate and comment about the product for upgradation & Support The   5 EMA   is plotted in   green   color ( Lime ). The  14 EMA  is plotted in  red  color ( Red ). The   20 EMA   is plotted in   blue   color ( Blue ). The  200 EMA  is plotted in  black  color ( Black ). The   200 EMA   is plotted in   yellow   color ( Yellow ). The Quarter EMA that provided calculates and plots four Exponential Moving Averages (EMAs) on the chart using different periods: 5, 14, 20, and 200. Each EMA is
FREE
This indicator uses a different approach from the previous version to get it's trendlines. This method is derived from Orchard Forex, and the process of making the indicator is demonstrated in there video   https://www.youtube.com/watch?v=mEaiurw56wY&t=1425s . The basic idea behind this indicator is it draws a   tangent line   on the highest levels and lowest levels of the bars used for calculation, while ensuring that the lines don't intersect with the bars in review (alittle confusing? I know
FREE
Daily Volatility Tracker   is a practical and lightweight indicator designed to help traders monitor and analyze market volatility based on historical daily price movements. Whether you're a day trader, swing trader, or scalper, understanding how much a market moves per day is critical for: Choosing the right pairs to trade Setting accurate stop-loss and take-profit levels Adapting to changing market conditions MT4 Version -  https://www.mql5.com/en/market/product/134958/ Join To Learn Market De
FREE
Gli utenti di questo prodotto hanno anche acquistato
Se acquisti questo indicatore, riceverai il mio Trade Manager Professionale + EA  GRATUITAMENTE. Innanzitutto è importante sottolineare che questo sistema di trading è un indicatore Non-Repainting, Non-Redrawing e Non-Lagging, il che lo rende ideale sia per il trading manuale che per quello automatico. Corso online, manuale e download di preset. Il "Sistema di Trading Smart Trend MT5" è una soluzione completa pensata sia per i trader principianti che per quelli esperti. Combina oltre 10 indicat
Power Candles MT5
Daniel Stein
5 (3)
Power Candles – Segnali di ingresso basati sulla forza per tutti i mercati Power Candles porta l’analisi di forza collaudata di Stein Investments direttamente sul grafico dei prezzi. Invece di reagire solo al prezzo, ogni candela viene colorata in base alla reale forza di mercato, consentendo di identificare immediatamente accumuli di momentum, accelerazioni della forza e transizioni di trend pulite. Un’unica logica per tutti i mercati Power Candles funziona automaticamente su tutti i simboli di
Divergence Bomber
Ihor Otkydach
4.96 (77)
Ogni acquirente dell’indicatore riceverà inoltre gratuitamente: L’utilità esclusiva “Bomber Utility”, che gestisce automaticamente ogni operazione, imposta i livelli di Stop Loss e Take Profit e chiude le posizioni secondo le regole della strategia I file di configurazione (set file) per adattare l’indicatore a diversi asset I set file per configurare il Bomber Utility in tre modalità: “Rischio Minimo”, “Rischio Bilanciato” e “Strategia di Attesa” Una guida video passo-passo per installare, conf
ARICoins
Temirlan Kdyrkhan
ARICoin is a powerful trading companion designed to generate high-probability entry signals with dynamic TP/SL/DP levels based on volatility. Built-in performance tracking shows win/loss stats, PP1/PP2 hits, and success rates all updated live. Key Features: Buy/Sell signals with adaptive volatility bands Real-time TP/SL/DP levels based on ATR Built-in MA Filter with optional ATR/StdDev volatility Performance stats panel (Success, Profit/Loss, PP1/PP2) Alerts via popup, sound, push, or email Cust
Entry In The Zone and SMC Multi Timeframe è uno strumento di analisi di mercato in tempo reale sviluppato sulla base degli Smart Money Concepts (SMC). È progettato per aiutare i trader ad analizzare la struttura del mercato in modo sistematico e ottenere una visione più chiara della direzione generale del mercato. Il sistema analizza automaticamente i Punti di Inversione, le Zone Chiave e la Market Structure su più timeframe, mostrando Point of Interest (POI), segnali No Repaint e Auto Fibonacci
AriX
Temirlan Kdyrkhan
1 (4)
AriX Indicator for MT5 A powerful trend-following and signal-evaluation tool AriX is a custom MT5 indicator that combines Moving Averages and ATR-based risk/reward logic to generate clear buy/sell signals. It visualizes dynamic SL/TP levels, evaluates past trade outcomes, and displays win/loss statistics in a clean on-chart panel. Key features include: Buy/Sell signals based on MA crossovers ATR-based SL/TP1/TP2/TP3 levels with visual lines and labels Signal outcome tracking with real-time stat
Atomic Analyst MT5
Issam Kassas
4.19 (27)
Innanzitutto, vale la pena sottolineare che questo indicatore di trading non è repaint, non è ridisegno e non presenta ritardi, il che lo rende ideale sia per il trading manuale che per quello automatico. Manuale utente: impostazioni, input e strategia. L'Analista Atomico è un indicatore di azione del prezzo PA che utilizza la forza e il momentum del prezzo per trovare un miglior vantaggio sul mercato. Dotato di filtri avanzati che aiutano a rimuovere rumori e segnali falsi, e aumentare il pote
ARIScalping
Temirlan Kdyrkhan
ARIScalp is a powerful trading companion designed to generate high-probability entry signals with dynamic TP/SL/DP levels based on volatility. Built-in performance tracking shows win/loss stats, PP1/PP2 hits, and success rates all updated live. Key Features: Buy/Sell signals with adaptive volatility bands Real-time TP/SL/DP levels based on ATR Built-in MA Filter with optional ATR/StdDev volatility Performance stats panel (Success, Profit/Loss, PP1/PP2) Alerts via popup, sound, push, or email Cus
Azimuth Pro
Ottaviano De Cicco
5 (1)
LAUNCH PROMO Azimuth Pro price is initially set at 299$ for the first 100 buyers. Final price will be 499$ . THE DIFFERENCE BETWEEN RETAIL AND INSTITUTIONAL ENTRIES ISN'T THE INDICATOR — IT'S THE LOCATION. Most traders enter at arbitrary price levels, chasing momentum or reacting to lagging signals. Institutions wait for price to reach structured levels where supply and demand actually shift. Azimuth Pro maps these levels automatically: swing-anchored VWAP, multi-timeframe structure lines, an
FX Power MT5 NG
Daniel Stein
5 (28)
FX Power: Analizza la Forza delle Valute per Decisioni di Trading Più Intelligenti Panoramica FX Power è lo strumento essenziale per comprendere la reale forza delle principali valute e dell'oro in qualsiasi condizione di mercato. Identificando le valute forti da comprare e quelle deboli da vendere, FX Power semplifica le decisioni di trading e rivela opportunità ad alta probabilità. Che tu segua le tendenze o anticipi inversioni utilizzando valori estremi di Delta, questo strumento si adatta
Game Changer è un indicatore di tendenza rivoluzionario, progettato per essere utilizzato su qualsiasi strumento finanziario, per trasformare il tuo Metatrader in un potente analizzatore di trend. L'indicatore non ridisegna e non subisce ritardi. Funziona su qualsiasi intervallo temporale e aiuta a identificare i trend, segnala potenziali inversioni, funge da meccanismo di trailing stop e fornisce avvisi in tempo reale per risposte tempestive del mercato. Che tu sia un trader esperto, un profess
Gold Sniper Scalper Pro
Ich Khiem Nguyen
3.29 (7)
Gold Sniper Scalper Pro è un indicatore professionale per MetaTrader 5, progettato per supportare i trader nell'identificare punti di ingresso e gestire il rischio in modo efficace. L'indicatore fornisce un set completo di strumenti analitici che include un sistema di rilevamento dei segnali, gestione automatica di Entry/SL/TP, analisi del volume e statistiche delle performance in tempo reale. Guida utente per comprendere il sistema   |   Guida utente per altre lingue CARATTERISTICHE PRINCIPALI
Smart Stop Indicator – Precisione intelligente dello stop-loss direttamente sul grafico Panoramica Smart Stop Indicator è la soluzione ideale per i trader che desiderano posizionare il loro stop-loss in modo chiaro e metodico, senza dover indovinare o affidarsi all’intuizione. Questo strumento combina la logica classica del price action (massimi e minimi strutturali) con un moderno riconoscimento dei breakout per identificare il prossimo livello di stop realmente logico. In trend, in range o i
Trend Screener Pro MT5
STE S.S.COMPANY
4.84 (99)
Indicatore di tendenza, soluzione unica rivoluzionaria per il trading di tendenze e il filtraggio con tutte le importanti funzionalità di tendenza integrate in un unico strumento! È un indicatore multi-timeframe e multi-valuta al 100% non ridipingibile che può essere utilizzato su tutti i simboli/strumenti: forex, materie prime, criptovalute, indici e azioni. Trend Screener è un indicatore di tendenza che segue un indicatore efficiente che fornisce segnali di tendenza a freccia con punti nel gra
Weis Wave with Alert MT5
Trade The Volume Waves Single Member P.C.
4.94 (17)
Rental/Lifetime Package Options and Privileges  Rent Monthly Six Months   Yearly/Lifetime Weis Wave with Speed with Alert+Speed Index x x x Manual  x x x Quick Set up Video x x x Blog x x x Lifetime Updates x x x Setup and Training Material x x Discord Access Channel "The SI traders"          x Rectangle Break Alert Tool      x How to trade with it:    http://www.tradethevolumewaves.com   ** If you purchase please contact me to setup your  : Training Room and  complete manual access.  Wei
FX Levels MT5
Daniel Stein
5 (12)
FX Levels: Supporti e Resistenze di Precisione Eccezionale per Tutti i Mercati Panoramica Rapida Cercate un modo affidabile per individuare livelli di supporto e resistenza in ogni mercato—coppie di valute, indici, azioni o materie prime? FX Levels fonde il metodo tradizionale “Lighthouse” con un approccio dinamico all’avanguardia, offrendo una precisione quasi universale. Basato sulla nostra esperienza reale con i broker e su aggiornamenti automatici giornalieri più quelli in tempo reale, FX
Innanzitutto, vale la pena sottolineare che questo Strumento di Trading è un Indicatore Non-Ridipingente, Non-Ridisegnante e Non-Laggante, il che lo rende ideale per il trading professionale. Corso online, manuale utente e demo. L'Indicatore Smart Price Action Concepts è uno strumento molto potente sia per i nuovi che per i trader esperti. Racchiude più di 20 utili indicatori in uno solo, combinando idee di trading avanzate come l'Analisi del Trader del Circolo Interno e le Strategie di Tradin
- Real price is 80$ - 45% Discount (It is 45$ now) Contact me for extra bonus   indicator, instruction or any questions! - Lifetime update free - Non-repaint - Related product: Gann Gold EA - I just sell my products in Elif Kaya Profile, any other websites are stolen old versions, So no any new updates or support. Advantages of  M1 Scalper Pro  Profitability: M1 Scalper Pro is highly profitable with a strict exit strategy. Frequent Opportunities: M1 Scalper Pro  takes advantage of numerous smal
IX Power MT5
Daniel Stein
4.92 (12)
IX Power: Scopri approfondimenti di mercato per indici, materie prime, criptovalute e forex Panoramica IX Power è uno strumento versatile progettato per analizzare la forza di indici, materie prime, criptovalute e simboli forex. Mentre FX Power offre la massima precisione per le coppie di valute utilizzando i dati di tutte le coppie disponibili, IX Power si concentra esclusivamente sui dati di mercato del simbolo sottostante. Questo rende IX Power una scelta eccellente per mercati non correlat
Berma Bands
Muhammad Elbermawi
5 (7)
L'indicatore Berma Bands (BBs) è uno strumento prezioso per i trader che cercano di identificare e capitalizzare i trend di mercato. Analizzando la relazione tra il prezzo e le BBs, i trader possono discernere se un mercato è in una fase di trend o di range. Visita il [ Berma Home Blog ] per saperne di più. Le Berma Bands sono composte da tre linee distinte: la Upper Berma Band, la Middle Berma Band e la Lower Berma Band. Queste linee sono tracciate attorno al prezzo, creando una rappresentazion
Grabber System MT5
Ihor Otkydach
4.81 (21)
Ti presento un eccellente indicatore tecnico: Grabber, che funziona come una strategia di trading "tutto incluso", pronta all’uso. In un solo codice sono integrati strumenti potenti per l’analisi tecnica del mercato, segnali di trading (frecce), funzioni di allerta e notifiche push. Ogni acquirente di questo indicatore riceve anche gratuitamente: L’utility Grabber: per la gestione automatica degli ordini aperti Video tutorial passo dopo passo: per imparare a installare, configurare e utilizzare
MetaForecast M5
Vahidreza Heidar Gholami
5 (3)
MetaForecast predice e visualizza il futuro di qualsiasi mercato basandosi sull'armonia dei dati dei prezzi. Sebbene il mercato non sia sempre prevedibile, se esiste un modello nei prezzi, MetaForecast può prevedere il futuro con la massima precisione possibile. Rispetto ad altri prodotti simili, MetaForecast può generare risultati più accurati analizzando le tendenze di mercato. Parametri di input Past size (Dimensione passata) Specifica il numero di barre che MetaForecast utilizza per creare
PZ Support Resistance MT5
PZ TRADING SLU
3.71 (7)
Unlock key market insights with automated support and resistance lines Tired of plotting support and resistance lines? This is a multi-timeframe indicator that detects and plots supports and resistance lines in the chart with the same precision as a human eye would. As price levels are tested over time and its importance increases, the lines become thicker and darker, making price leves easy to glance and evaluate. [ Installation Guide | Update Guide | Troubleshooting | FAQ | All Products ] Boos
TrendLine PRO MT5
Evgenii Aksenov
4.67 (33)
The Trend Line PRO indicator is an independent trading strategy. It shows the trend change, the entry point to the transaction, as well as automatically calculates three levels of Take Profit and Stop Loss protection. Trend Line PRO is perfect for all Meta Trader symbols: currencies, metals, cryptocurrencies, stocks and indices. The indicator is used in trading on real accounts, which confirms the reliability of the strategy. Robots using   Trend Line PRO   and real Signals can be found here: 
Quantum TrendPulse
Bogdan Ion Puscasu
5 (20)
Ecco   Quantum TrendPulse   , lo strumento di trading definitivo che combina la potenza di   SuperTrend   ,   RSI   e   Stocastico   in un unico indicatore completo per massimizzare il tuo potenziale di trading. Progettato per i trader che cercano precisione ed efficienza, questo indicatore ti aiuta a identificare con sicurezza le tendenze di mercato, i cambiamenti di momentum e i punti di entrata e uscita ottimali. Caratteristiche principali: Integrazione SuperTrend:   segui facilmente l'andame
ARIPoint
Temirlan Kdyrkhan
1 (1)
ARIPoint is a powerful trading companion designed to generate high-probability entry signals with dynamic TP/SL/DP levels based on volatility. Built-in performance tracking shows win/loss stats, PP1/PP2 hits, and success rates all updated live. Key Features: Buy/Sell signals with adaptive volatility bands Real-time TP/SL/DP levels based on ATR Built-in MA Filter with optional ATR/StdDev volatility Performance stats panel (Success, Profit/Loss, PP1/PP2) Alerts via popup, sound, push, or email Cu
How many times have you bought a trading indicator with great back-tests, live account performance proof with fantastic numbers and stats all over the place but after using it, you end up blowing your account? You shouldn't trust a signal by itself, you need to know why it appeared in the first place, and that's what RelicusRoad Pro does best! User Manual + Strategies + Training Videos + Private Group with VIP Access + Mobile Version Available A New Way To Look At The Market RelicusRoad is the
Trend indicator AI mt5
Ramil Minniakhmetov
5 (13)
Trend Ai indicator è un ottimo strumento che migliorerà l'analisi di mercato di un trader combinando l'identificazione della tendenza con punti di ingresso utilizzabili e avvisi di inversione. Questo indicatore consente agli utenti di navigare nelle complessità del mercato forex con fiducia e precisione Oltre ai segnali primari, l'indicatore Ai di tendenza identifica i punti di ingresso secondari che si presentano durante i pullback o i ritracciamenti, consentendo ai trader di capitalizzare le
Max Ribbon Mt5
Stefano Frisetti
ATTENZIONE: Questo indicatore è distribuito ESCLUSIVAMENTE su MQL5.com Versione MT4:   https://www.mql5.com/it/market/product/160363 Versione MT5:   https://www.mql5.com/it/market/product/160410 ================================================================================ MAX RIBBON ver 1.00 L'indicatore che ti mostra il TREND in modo chiaro e inequivocabile! ================================================================================ DESCRIZIONE MAX RIBBON è un indicatore di trend
MTF Supply Demand Zones MT5
Georgios Kalomoiropoulos
5 (1)
Nuova generazione di zone di domanda e offerta automatizzate. Algoritmo nuovo e innovativo che funziona su qualsiasi grafico. Tutte le zone vengono create dinamicamente in base all'azione dei prezzi del mercato. DUE TIPI DI AVVISI --> 1) QUANDO IL PREZZO RAGGIUNGE UNA ZONA 2) QUANDO SI FORMA UNA NUOVA ZONA Non ottieni un altro indicatore inutile. Ottieni una strategia di trading completa con risultati comprovati.     Nuove caratteristiche:     Avvisi quando il prezzo raggiunge la zona di
Altri dall’autore
PZ Support Resistance MT5
PZ TRADING SLU
3.71 (7)
Unlock key market insights with automated support and resistance lines Tired of plotting support and resistance lines? This is a multi-timeframe indicator that detects and plots supports and resistance lines in the chart with the same precision as a human eye would. As price levels are tested over time and its importance increases, the lines become thicker and darker, making price leves easy to glance and evaluate. [ Installation Guide | Update Guide | Troubleshooting | FAQ | All Products ] Boos
Trade smarter, not harder: Empower your trading with Harmonacci Patterns This is arguably the most complete harmonic price formation auto-recognition indicator you can find for the MetaTrader Platform. It detects 19 different patterns, takes fibonacci projections as seriously as you do, displays the Potential Reversal Zone (PRZ) and finds suitable stop-loss and take-profit levels. [ Installation Guide | Update Guide | Troubleshooting | FAQ | All Products ] It detects 19 different harmonic pri
PZ Swing Trading MT5
PZ TRADING SLU
5 (5)
Protect against whipsaws: revolutionize your swing trading approach Swing Trading is the first indicator designed to detect swings in the direction of the trend and possible reversal swings. It uses the baseline swing trading approach, widely described in trading literature. The indicator studies several price and time vectors to track the aggregate trend direction and detects situations in which the market is oversold or overbought and ready to correct. [ Installation Guide | Update Guide | Tro
PZ Goldfinch Scalper EA MT5
PZ TRADING SLU
3.33 (49)
This is the latest iteration of my famous scalper, Goldfinch EA, published for the first time almost a decade ago. It scalps the market on sudden volatility expansions that take place in short periods of time: it assumes and tries to capitalize of inertia in price movement after a sudden price acceleration. This new version has been simplified to allow the trader use the optimization feature of the tester easily to find the best trading parameters. [ Installation Guide | Update Guide | Troublesh
FREE
PZ Reversal Fractals MT5
PZ TRADING SLU
4.53 (34)
This is the latest iteration of my famous indicator, Reversal Fractals, published for the first time almost a decade ago. It examines the price structure of fractals to determine possible reversal points in the market, providing timing to positional traders that already have a fundamental or technical valuation model. [ Installation Guide | Update Guide | Troubleshooting | FAQ | All Products ] Reversal fractals can start long trends The indicator is non repainting It implements alerts of all ki
FREE
Unlock market continuations with the accurate pennants indicator This indicator finds pennants , which are continuation patterns identified by converging trendlines surrounding a price consolidation period. Trades are signaled using a breakout period alongside the formation breakout.  [ Installation Guide | Update Guide | Troubleshooting | FAQ | All Products ] Easy to use Customizable colors and sizes It implements breakout signals It implements alerts of all kinds Optimal Usage To see pennants
PZ Trade Pad MT5
PZ TRADING SLU
4.41 (22)
This simple visual expert advisor allows you to trade easily from the chart. It handles risk management for you and can perform several useful tasks with your existing trades, saving time and making risk-management for each individual trade easier.  [ Installation Guide | Update Guide | Troubleshooting | FAQ | All Products ] Trade easily from the chart Trade with precise risk management, hassle free Trade pending order with drag and drop price selection Set SL and TP levels with drag and drop pr
FREE
PZ Trend Trading MT5
PZ TRADING SLU
3.8 (5)
Capture every opportunity: your go-to indicator for profitable trend trading Trend Trading is an indicator designed to profit as much as possible from trends taking place in the market, by timing pullbacks and breakouts. It finds trading opportunities by analyzing what the price is doing during established trends. [ Installation Guide | Update Guide | Troubleshooting | FAQ | All Products ] Trade financial markets with confidence and efficiency Profit from established trends without getting whip
PZ Day Trading MT5
PZ TRADING SLU
2.83 (6)
Effortless trading: non-repainting indicator for accurate price reversals This indicator detects price reversals in a zig-zag fashion, using only price action analysis and a donchian channel. It has been specifically designed for short-term trading, without repainting or backpainting at all. It is a fantastic tool for shrewd traders aiming to increase the timing of their operations. [ Installation Guide | Update Guide | Troubleshooting | FAQ | All Products ] Amazingly easy to trade It provides
PZ Swing Trading
PZ TRADING SLU
5 (3)
Protect against whipsaws: revolutionize your swing trading approach Swing Trading is the first indicator designed to detect swings in the direction of the trend and possible reversal swings. It uses the baseline swing trading approach, widely described in trading literature. The indicator studies several price and time vectors to track the aggregate trend direction and detects situations in which the market is oversold or overbought and ready to correct. [ Installation Guide | Update Guide | Tro
PZ Goldfinch Scalper EA
PZ TRADING SLU
2.73 (41)
This is the latest iteration of my famous scalper, Goldfinch EA, published for the first time almost a decade ago. It scalps the market on sudden volatility expansions that take place in short periods of time: it assumes and tries to capitalize of inertia in price movement after a sudden price acceleration. This new version has been simplified to allow the trader use the optimization feature of the tester easily to find the best trading parameters. [ Installation Guide | Update Guide | Troublesh
FREE
PZ Harmonacci Patterns
PZ TRADING SLU
3.17 (6)
Trade smarter, not harder: Empower your trading with Harmonacci Patterns This is arguably the most complete harmonic price formation auto-recognition indicator you can find for the MetaTrader Platform. It detects 19 different patterns, takes fibonacci projections as seriously as you do, displays the Potential Reversal Zone (PRZ) and finds suitable stop-loss and take-profit levels. [ Installation Guide | Update Guide | Troubleshooting | FAQ | All Products ] It detects 19 different harmonic pric
PZ Trend Trading
PZ TRADING SLU
4.8 (5)
Capture every opportunity: your go-to indicator for profitable trend trading Trend Trading is an indicator designed to profit as much as possible from trends taking place in the market, by timing pullbacks and breakouts. It finds trading opportunities by analyzing what the price is doing during established trends. [ Installation Guide | Update Guide | Troubleshooting | FAQ | All Products ] Trade financial markets with confidence and efficiency Profit from established trends without getting whip
PZ Turtle Trading EA MT5
PZ TRADING SLU
2 (4)
This expert advisor implements the original Dennis and Eckhardt trading system, commonly known as The Turtle Trader. It trades exactly like the original turtles did, and can be used by experienced traders to capture trends in up or down markets. [ Installation Guide | Update Guide | Troubleshooting | FAQ | All Products ] Easy to use and supervise Fully configurable strategy settings Fully configurable trading settings Works for ECN/Non-ECN brokers and 2-3-4-5 digit symbols Works for CFDs and for
FREE
PZ Lopez Impulse MT5
PZ TRADING SLU
5 (4)
Transform your trading approach with reliable bullish and bearish patterns This indicator evaluates volatility and price directionality simultaneously, which finds the following events. Decisive and sudden price movements Large hammers/shooting stars patterns Strong breakouts backed by most market participants Indecisive but volatile market situations It is an extremely easy to use indicator... The blue histogram represents the bullish impulse The red histogram represents the bearish impulse The
FREE
PZ Turtle Trading MT5
PZ TRADING SLU
4.67 (6)
The Turtle Trading Indicator implements the original Dennis Richards and Bill Eckhart trading system, commonly known as The Turtle Trader. This trend following system relies on breakouts of historical highs and lows to take and close trades: it is the complete opposite to the "buy low and sell high" approach. The main rule is "Trade an N-day breakout and take profits when an M-day high or low is breached (N must me above M)".  [ Installation Guide | Update Guide | Troubleshooting | FAQ | All Pr
FREE
PZ Chart Overlay MT5
PZ TRADING SLU
4 (1)
Master the market: harness the power of statistical arbitrage This indicator showcases the price action of multiple instruments on a single chart, enabling you to compare the fluctuations of different assets and seamlessly implement statistical arbitrage strategies. Its main usage is to find correlated symbols which are temporarily out of whack. [ Installation Guide | Update Guide | Troubleshooting | FAQ | All Products ] Find overbought or oversold currency pairs easily Plot up to six currency
FREE
PZ Pivot Points MT5
PZ TRADING SLU
4.91 (22)
This indicator displays pivot points in the chart, including historical vales, and supports many calculation modes for Pivot Points and S/R levels. [ Installation Guide | Update Guide | Troubleshooting | FAQ | All Products ] It plots historical levels for backtesting purposes It allows you to select the reference timeframe It implements different Pivot Point calculation modes It implements different SR calculation modes It implements customizable colors and sizes Calculation Modes The indicato
FREE
This expert advisor implements the original Dennis and Eckhardt trading system, commonly known as The Turtle Trader. It trades exactly like the original turtles did, and can be used by experienced traders to capture trends in up or down markets. [ Installation Guide | Update Guide | Troubleshooting | FAQ | All Products ] Easy to use and supervise Fully configurable strategy settings Fully configurable trading settings Works for ECN/Non-ECN brokers and 2-3-4-5 digit symbols Works for CFDs and for
FREE
PZ Sandwich Bars MT5
PZ TRADING SLU
5 (3)
Spot high-probability trades: sandwich bar breakouts at your fingertips This indicator detects Sandwich Bars of several ranges, an extremely reliable breakout pattern. A sandwich setup consists on a single bar that engulfs several past bars, breaking and rejecting the complete price range. [ Installation Guide | Update Guide | Troubleshooting | FAQ | All Products ] Easy and effective usage Customizable bar ranges Customizable color selections The indicator implements visual/mail/push/sound aler
FREE
PZ Trendlines
PZ TRADING SLU
4.27 (11)
Tired of plotting trendlines? The PZ TrendLines indicator applies a mechanical approach to the construction of trend lines for you! [ Installation Guide | Update Guide | Troubleshooting | FAQ | All Products ] It can draw up to 18 trendlines Trendlines can be optionally based on fractals Each line represents a breakout level Each trendline can be broken or rejected Configurable amount of lines Configurable colors Author Arturo López Pérez, private investor and speculator, software engineer and
FREE
This indicator analyzes how efficient is the current market movement based on the true high-low ratio of a certain number of bars.  [ Installation Guide | Update Guide | Troubleshooting | FAQ | All Products ] The ratio is the effectiveness of the market movement A ratio below 1 means the market is going nowhere A ratio above 1 means the market is starting to show directionality A ratio above 2 means the market is showing effective movement A ratio above 3 means the market moved too much: it will
Unlock powerful breakout opportunities The 123 Pattern is one of the most popular, powerful and flexible chart patterns. The pattern is made up of three price points: a bottom, a peak or valley, and a Fibonacci retracement between 38.2% and 71.8%. A pattern is considered valid when the price breaks beyond the last peak or valley, moment at which the indicator plots an arrow, rises an alert, and the trade can be placed. [ Installation Guide | Update Guide | Troubleshooting | FAQ | All Products ]
Identify precise entry and exit points with AB=CD patterns This indicator finds AB=CD retracement patterns. The AB=CD Retracement pattern is a 4-point price structure where the initial price segment is partially retraced and followed by an equidistant move from the completion of the pullback, and is the basic foundation for all harmonic patterns. [ Installation Guide | Update Guide | Troubleshooting | FAQ | All Products ] Customizable pattern sizes Customizable AC and BD ratios Customizable b
PZ Three Drives
PZ TRADING SLU
5 (2)
This indicator finds Three Drives patterns. The Three Drives pattern is a 6-point reversal pattern characterised by a series of higher highs or lower lows that complete at a 127% or 161.8% Fibonacci extension. It signals that the market is exhausted and a reversal can happen. [ Installation Guide | Update Guide | Troubleshooting | FAQ | All Products ] Customizable pattern sizes Customizable colors and sizes Customizable breakout periods Customizable 1-2-3 and 0-A-B ratios It implements visual/s
FREE
PZ Inside Bars MT5
PZ TRADING SLU
4.5 (12)
Enhance your price action strategy: inside bar breakouts at your fingertips This indicator detects inside bars of several ranges, making it very easy for price action traders to spot and act on inside bar breakouts. [ Installation Guide | Update Guide | Troubleshooting | FAQ | All Products ] Easy to use and understand Customizable color selections The indicator implements visual/mail/push/sound alerts The indicator does not repaint or backpaint An inside bar is a bar or series of bars which is/a
FREE
Identify trending and flat markets effortlessly This indicator calculates how much has a symbol moved in relative terms to find trending or flat markets. It displays what percentage of the latest price range is directional. It can be used to avoid trading in flat markets, or to find flat markets to execute range-bound trading strategies. [ Installation Guide | Update Guide | Troubleshooting | FAQ | All Products ] A value of zero means the market is absolutely flat A value of 100 means the marke
FREE
The Stretch is a Toby Crabel price pattern which represents the minimum average price movement/deviation from the open price during a period of time, and is used to calculate two breakout levels for every single trading day. It is calculated by taking the 10 period SMA of the absolute difference between the open and either the high or low, whichever difference is smaller. This value is used to calculate breakout thresholds for the current trading session, which are displayed in the indicator as
FREE
PZ Pivot Points
PZ TRADING SLU
4.6 (10)
This indicator displays pivot points in the chart, including historical vales, and supports many calculation modes for Pivot Points and S/R levels. [ Installation Guide | Update Guide | Troubleshooting | FAQ | All Products ] It plots historical levels for backtesting purposes It allows you to select the reference timeframe It implements different Pivot Point calculation modes It implements different SR calculation modes It implements customizable colors and sizes Calculation Modes The indicator
FREE
PZ Turtle Trading
PZ TRADING SLU
3.8 (10)
The Turtle Trading Indicator implements the original Dennis Richards and Bill Eckhart trading system, commonly known as The Turtle Trader. This trend following system relies on breakouts of historical highs and lows to take and close trades: it is the complete opposite to the "buy low and sell high" approach. The main rule is "Trade an N-day breakout and take profits when an M-day high or low is breached (N must me above M)". [ Installation Guide | Update Guide | Troubleshooting | FAQ | All Prod
FREE
Filtro:
Nessuna recensione
Rispondi alla recensione