

List of Inputs
Instance Tag , For Using Multiple FMP's on one chart
Use this to differentiate (visually and technically) 2 or more different instances of the forex market profile indicator running on the same chart.
Ignore if you use one indicator (FMP) per chart.
This is not available in the demo version (the demo version is utilizing the instance "DEMO" ,only one allowed).
FMP ENGINE SETTINGS
Settings for the calculation process of the Forex Market Profile Indicator
FMP Default Start Bar
The starting bar (leftmost) for the indicators calculation range ,for the first time its applied to a chart.
In mt4 the bars go from 0 (most recent) to Max(oldest)
FMP Default End Bar
The end bar (rightmost) for the indicators calculation range , for the first time its applied to a chart. 0 means the live bar will be the right end of the indicators calculation range.
FMP Data Resolution TF :
The timeframe used for performing the profile calculation in the indicators calculation range.
The LowestPossible choice will utilize the lowest (higher resolution) available timeframe at each given point.Keep in mind ,these calculations depend on what data has MT4 downloaded for the asset.
- LowestPossible
- 1 Minute
- 5 Minute
- 15 Minute
- 30 Minute
- Hourly
- 4 Hour
- Daily
- Weekly
High To Low Multiplier >=0(default 1)
In the profile calculation a bars price range increases the “weight” of the price points within that range.
In FMP ,you can differentiate the weight (significance) of the wick portion of the bar (high to low) and the body of the bar (open to close).
Note the weights are in integer form (0,1,2…etc) and if they are equal the entire bar will be calculated with the default profile calculation mode (all of it high to low)
The weight input for the body of the bar is Open To Close Multiplier >=0(default 1)
Volume Weighting
Enables Volume (tick volume in forex pairs) weighting in the profile calculation .The weight input is an integer again and its called Volume Multiplier >=0(default 1)
Value Area A (Forex Market Profile Offers 2 Possible Value Areas)
Value Area A Use ?
Toggle the use of Value Area A.
Value Area A % (of activity)
(default 70%) The value area marks the range where 70% of the ranges price action activity took place.
You can adjust this setting to account for more or less than 70% within the indicators calculation range.
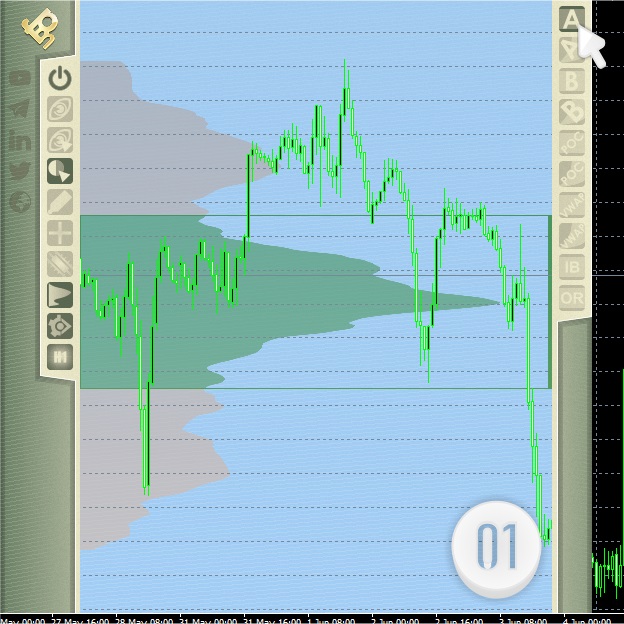
Developing Value Area A?
Enable or disable tracking of the Value Area A’s evolution across the indicators calculation range.
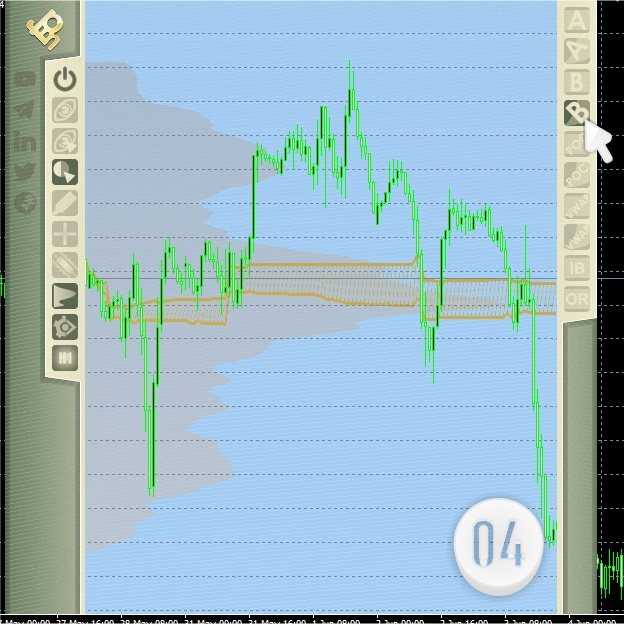
Point Of Control ?
Enable or disable the calculation of the Point Of Control (which is the point with the most activity inside the value area)[Value Area A is used for the calculation of the POC and the Developing POC respectively]
Developing Point Of Control ?
Enable or disable tracking of the POC’s evolution across the indicators calculation range.Value Area A is used for the Point Of Control calculation (in this case ,the Developing Value Area A)
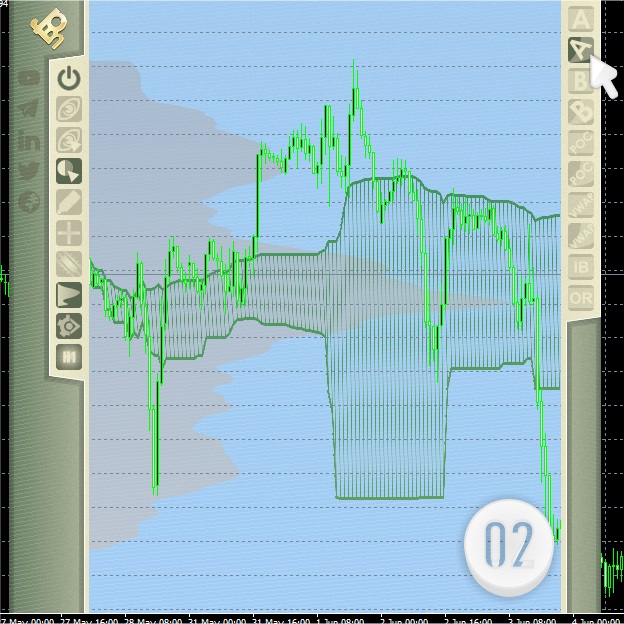
Value Area B Use ?
Toggle the use of the secondary Value Area ,Value Area B .Off by default.You can experiment with it.
Value Area B % (of activity)
(default 30%) The value area marks the range where x% of the ranges price action activity took place.You can adjust this setting freely.
Developing Value Area B?
Enable or disable tracking of the Value Area B’s evolution across the indicators calculation range.
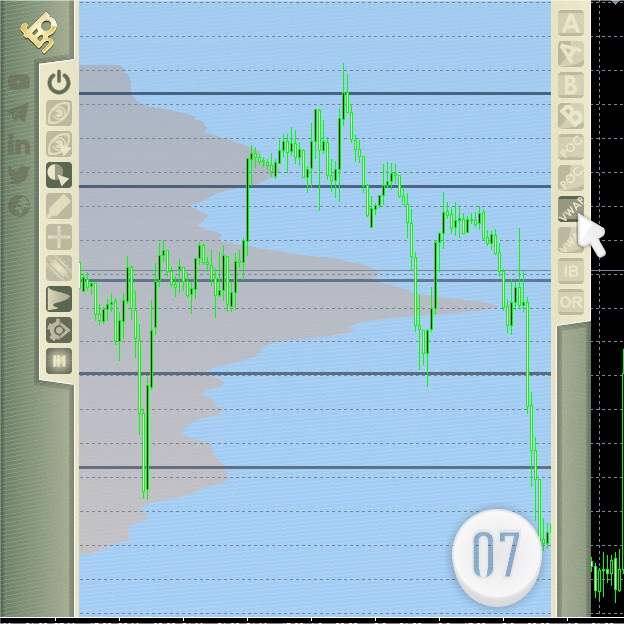
Initial Balance
Enable or disable the calculation of the Initial Balance .The initial balance is the range of the first x amount of bars of the indicators calculation range.
The amount of bars can be set with the input parameter Bars for Initial Balance (Calcs TF)-(calcs tf refers to the Calculations Timeframe chosen earlier)
Opening Range
Enable or disable the calculation of the Opening Range.The opening range is the first x bars high to low range on the timeframe defined by the input parameter Opening Range TF (if no data No Print!)(if no data No Print! Means that if MT4 has no data available for this calculation ,nothing will be shown) for the amount of bars defined by the input parameter Opening Range Bars
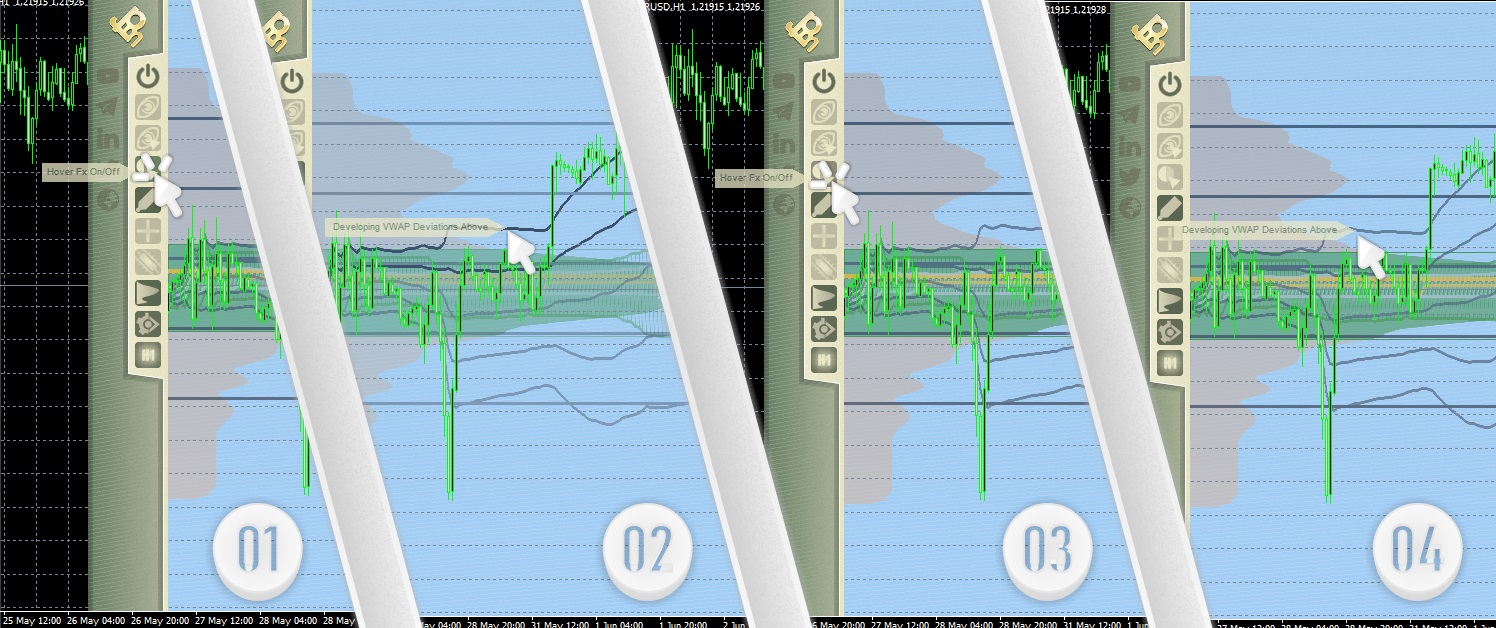
VWAP
Enable or disable the Vwap calculation for the indicators calculations range.
VWAP Deviations #
Number of deviations to plot ,both above and below the vwap
VWAP Each Deviations Value (default 1)
Additional multiplier for each deviation .Default is 1 ,leave at 1 if unsure.(value is float ,meaning it can have a decimal part 1.00 1.1 etc)
Developing VWAP
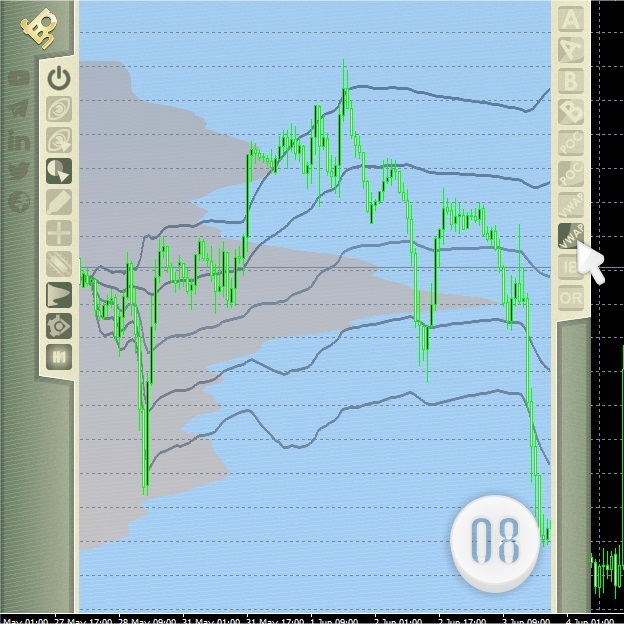
Enable or disable tracking of the Vwap (and its deviations) evolution across the indicators calculation range.Default is true as in most vwap indicators.
Show Bar Dynamics
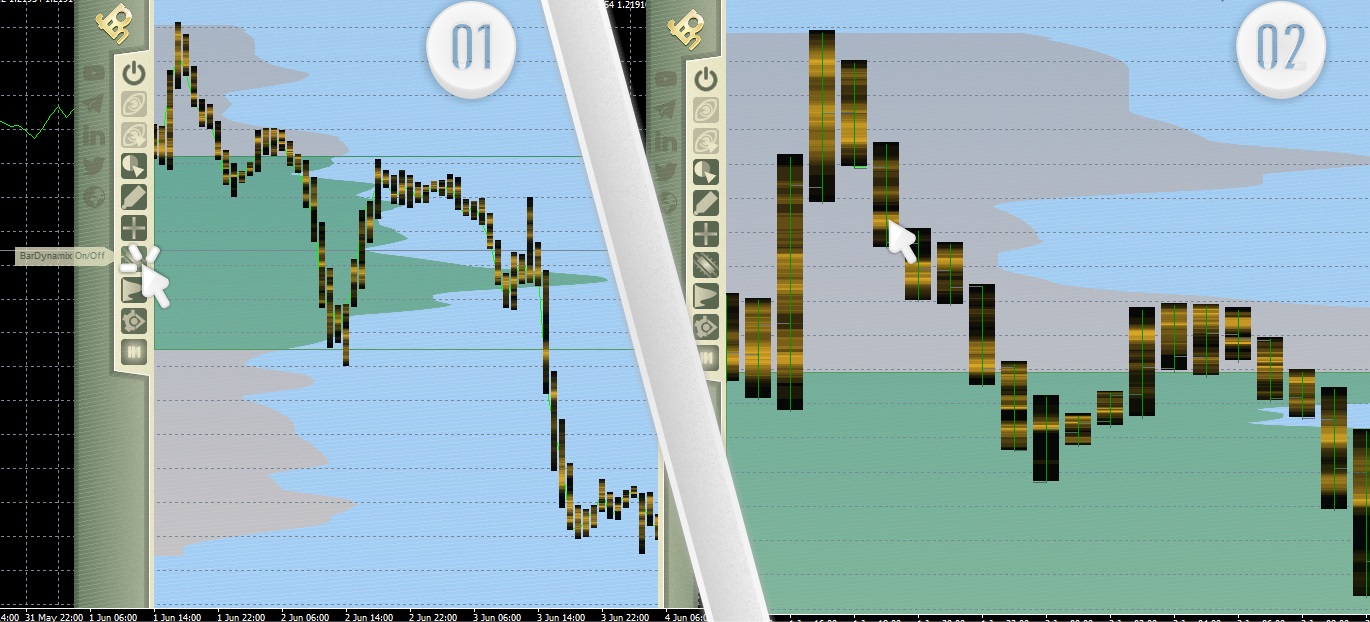
Bar Dynamics are a similar calculation to the market profile that is performed with each bar of the indicators calculation range being an independent calculation range for the duration of that bar if lower timeframes are available on MT4 .
The result is using the gradient display mode on top of each individual bar of the range.
The lowest available timeframe is used by default here ,and it can be filtered by how many bars exist (at least) in that timeframe via the input parameter BD : Min Accepted Bars in Lower TF for Calculations .
Similarly to the normal market profile ,the Bar dynamics calculations have their own weighting parameters for wicks (of the lower timeframe bars within the bar) with BD : High To Low Multiplier >=0(default 1) ,for bodies (of the lower timeframe bars within the bar) with BD : Open To Close Multiplier >=0(default 1) – volume weighting switch is BD : Volume Weighting with volume multiplier defined at BD : Volume Multiplier >=0(default 1)
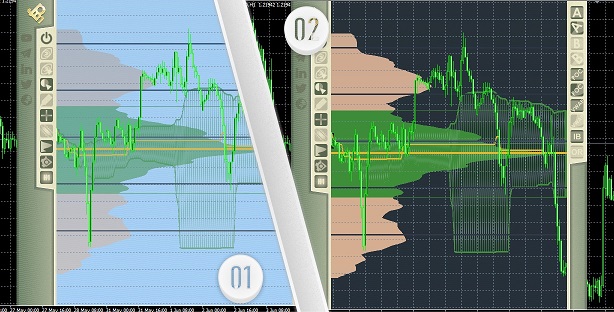
DISPLAY SETTINGS
FMP Has 13 Main Styles ,and one Custom Option.
The Custom option Enables the Advanced Section of the Display Settings where you can adjust more detailed appearance parameters.
To choose any of the 13 Main Styles ,pick any style other than “Custom” in the Main Style : setting.
Handles Width :
Choose one of the 3 predetermined sizes for the 2 edges of the FMP (the left and right dragging handles).
Choices are :
- 30 px
- 60 px
- 90 px
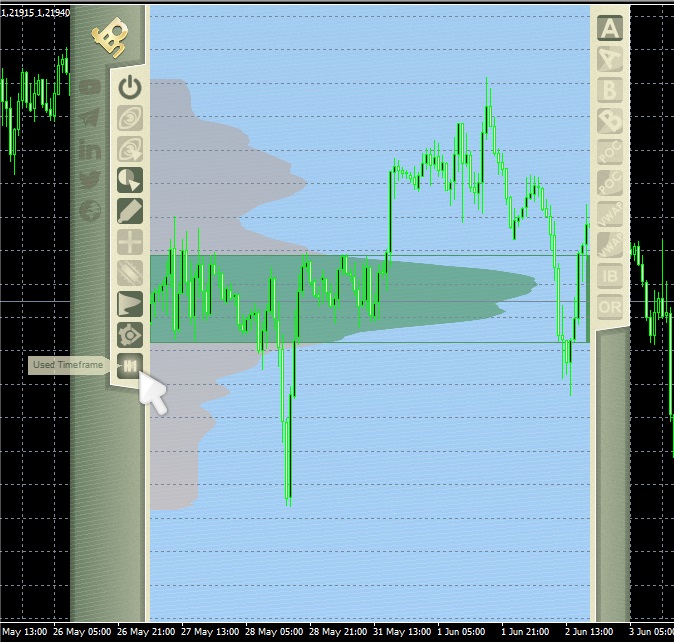
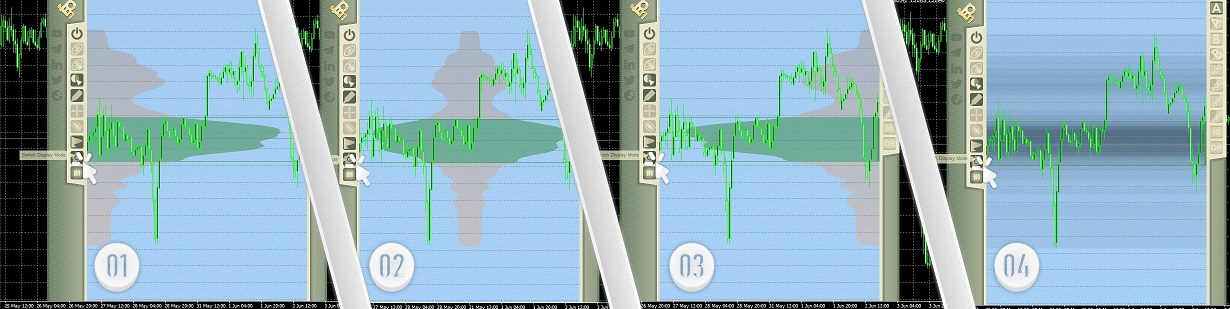
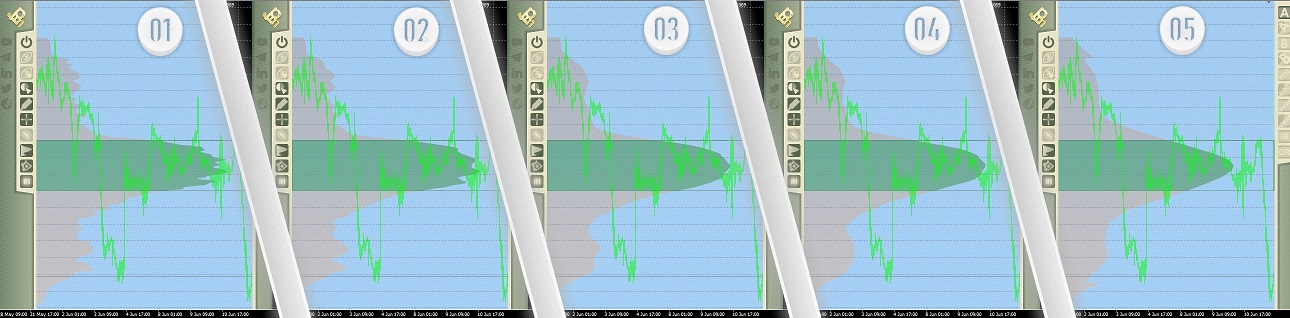
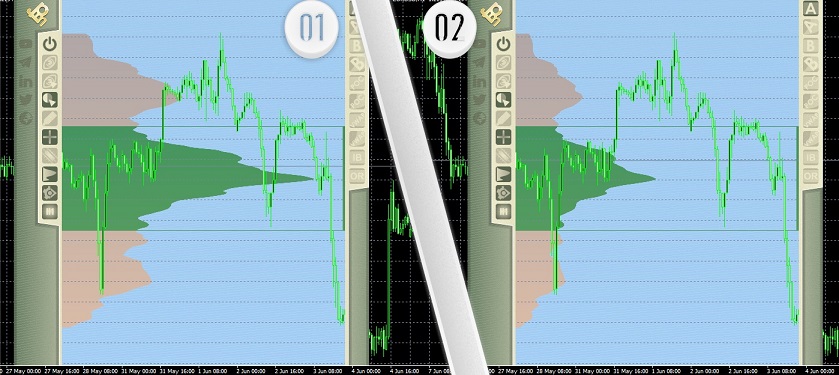
HorizontalBars (TPO) Display:
Choose the default display mode for the HorizontalBars (or TPO’s) ,note that you can toggle this from within the indicator on chart panel at any time.
- Left – display with the base at the left handle
- Center – display symmetrically from the center of the range
- Right – display with the base at the right handle
- Gradient – display a gradient map ,the more dense and opaque an area the more activity it has (similar display to BarDynamics but for the entire indicator calculation range)
- None – off
Note the usual TPO character color coded display is not available on this Market Profile Indicator
Developing Value Area A Line Width
Line width for the Developing value area A
Developing Value Area B Line Width
Line width for the Developing value area B
Developing Point Of Control Width
Line width for the Developing point of control
Point Of Control Width
Line width for the point of control
Vwap Main Width
Line width for the Main Vwap
Vwap Deviation Width
Line width for the Vwap Deviations
Hover Actions
Change the behavior of FMP when certain elements are hovered (mouse goes over them) on the FMP Panel (including data displayed)
- Fx + Tip – Highlight the hovered data point or element and display an assisting tooltip
- NoFx + Tip – Don’t Highlight the hovered data point or element ,but display an assisting tooltip
- Fx + NoTip – Highlight the hovered data point or element , don’t display an assisting tooltip
- NoFx+NoTip – Don’t highlight the hovered data point or element ,don’t display an assisting tooltip
These can be also altered from the FMP Panel directly on the chart
Tooltip Font Size
Font size of the tooltips in pixels
Crosshair ?
Enable or Disable the Crosshair display and functions .This can be toggled from the FMP Panel directly on the chart

Crosshair , allow price drop ?
Enable or disable the price level drop function (a horizontal line object is dropped when the crosshairs DROP PRICE btn is clicked)
If disabled the DROP PRICE button will not appear
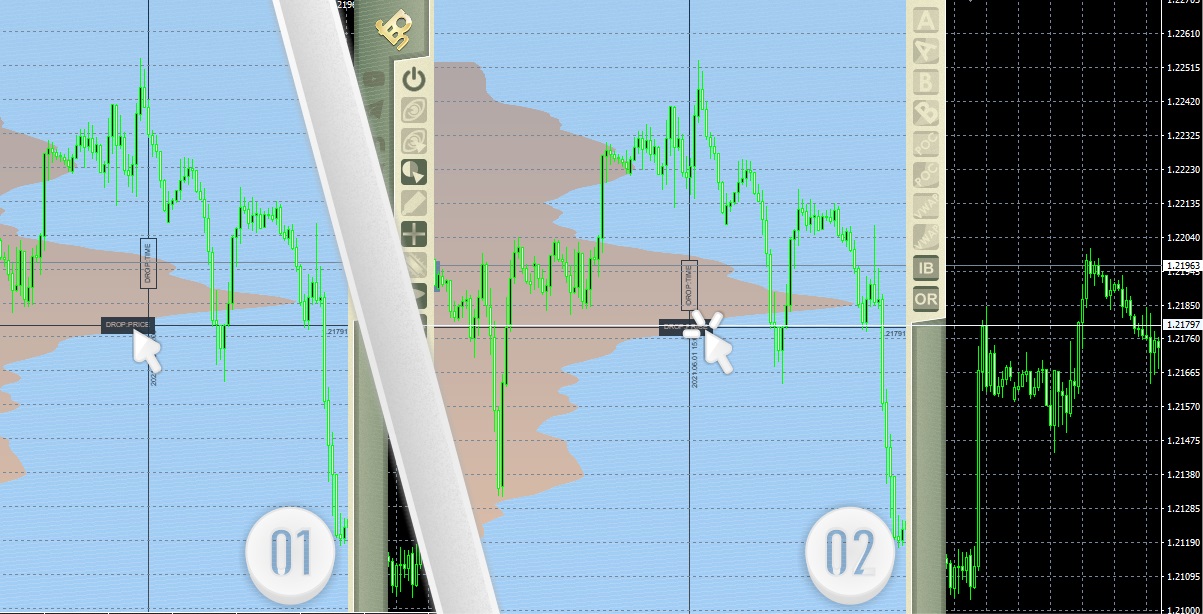
Crosshair , allow time drop ?
Enable or disable the time marker drop function (a vertical line object is dropped when the crosshairs DROP TIME btn is clicked)
If disabled the DROP TIME button will not appear
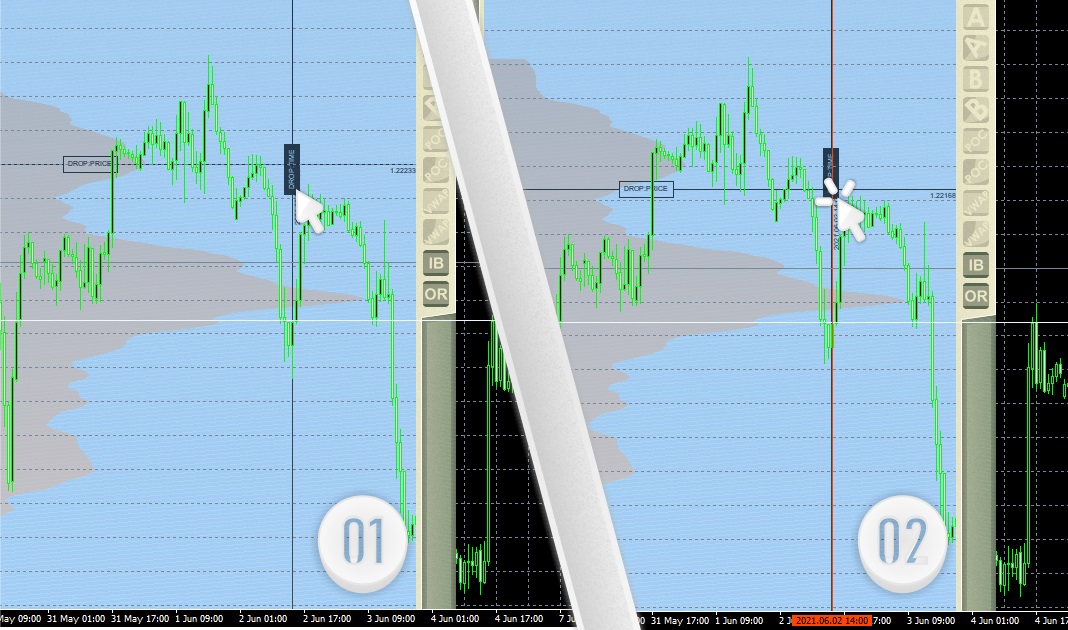
Crosshair , display time ?
Enable or disable the time display alongside the vertical axis of the crosshair.
Crosshair , display price ?
Enable or disable the price display across the horizontal axis of the crosshair.
Crosshair font size
Font size of the crosshair texts in pixels
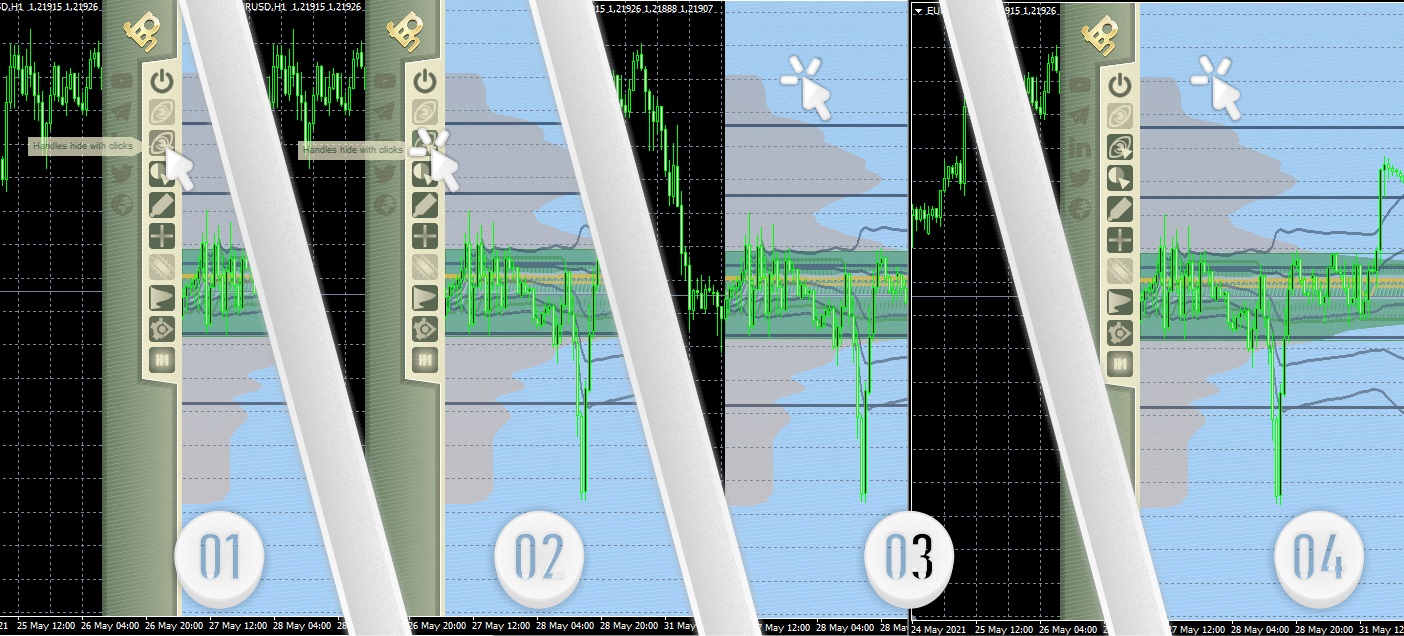
Auto Hide Handles (on mouseout)?
Enable or disable auto hiding of the left and right handles when the mouse is not over them.
This can also be changed from the FMP Panel directly on the chart.
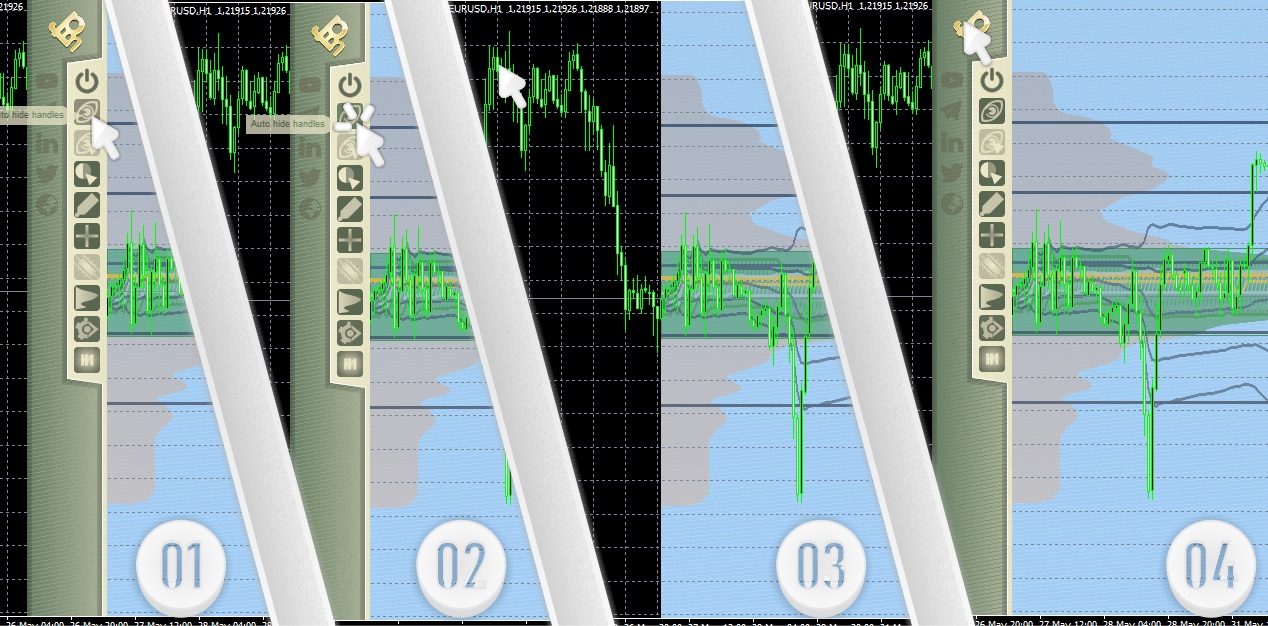
Hide on Click ?
Enable or disable the hide/show function of the left and right handles when an empty area on the data display window (within the range of the indicator) is clicked
This can also be changed from the FMP Panel directly on the chart.
Crosshair Drop Price Color
Color of the Horizontal lines that the crosshair DROP PRICE function creates
Crosshair Drop Price Style
Style of the Horizontal lines that the crosshair DROP PRICE function creates
Crosshair Drop Price Width
Width of the Horizontal lines that the crosshair DROP PRICE function creates
Crosshair Drop Price Name Tag
Tag for naming the objects the DROP PRICE function of the crosshair creates (a timestamp is appended after the tag)
Crosshair Drop Time Color
Color of the Vertical lines that the crosshair DROP TIME function creates
Crosshair Drop Time Style
Style of the Vertical lines that the crosshair DROP TIME function creates
Crosshair Drop Time Width
Width of the Vertical lines that the crosshair DROP TIME function creates
Crosshair Drop Time Name Tag
Tag for naming the objects the DROP TIME function of the crosshair creates (a timestamp is appended after the tag)
[Display Settings if you have selected the option Custom in the Main Style : setting.All these are set automatically if you do not select Custom]
Side Style :
Set the style of the left and right handles
Use Background ?
Enable or disable the background display for the data section (the part between the left and right handles)
Background Style :
Choose the style of the Background (if the background is enabled) for the data section
Data Style :
Choose the style for the data displayed in the data section
Use decoration ?
Enable or disable the decoration overlay (its faded ,not very opaque)
Decoration Style :
Choose the decoration style (if the decoration is enabled)
Smoothing Control :
Adjust the TPO's curve smoothing switch .Settings:
- Off(No Smoothing)
- Quick
- Deep
Smoothing Intensity :
Adjust the smoothing intensity of the horizontal bar curves (TPO) .
Smoothing Control : must not be on "Deep" for the following settings
Settings:
- UltraLite
- Lite
- Medi
- Strong
- UltraStrong
(Ultra smoothing) Method : ( Smoothing Control : must be on "Deep" for these settings)
Smoothing method (similar to ma)
Base Visibility % (10-100)
Base visibility of the data section minimum is 10%
% of hbars width (for l,r,c)
Percentage of the width between the 2 handles that will be used to display the horizontal bars (TPO).This can be changed even if you choose a non custom Main style!
AntiAliasing :
AntiAlias Intensity for the data .Can be set even if you don’t choose a Custom main style.
Choices:
- Off
- Single
- Ultra
![]()


 & AMD Framework")
")