• Panoramica
  • Recensioni
  • Commenti

Pinbar Outside Pattern

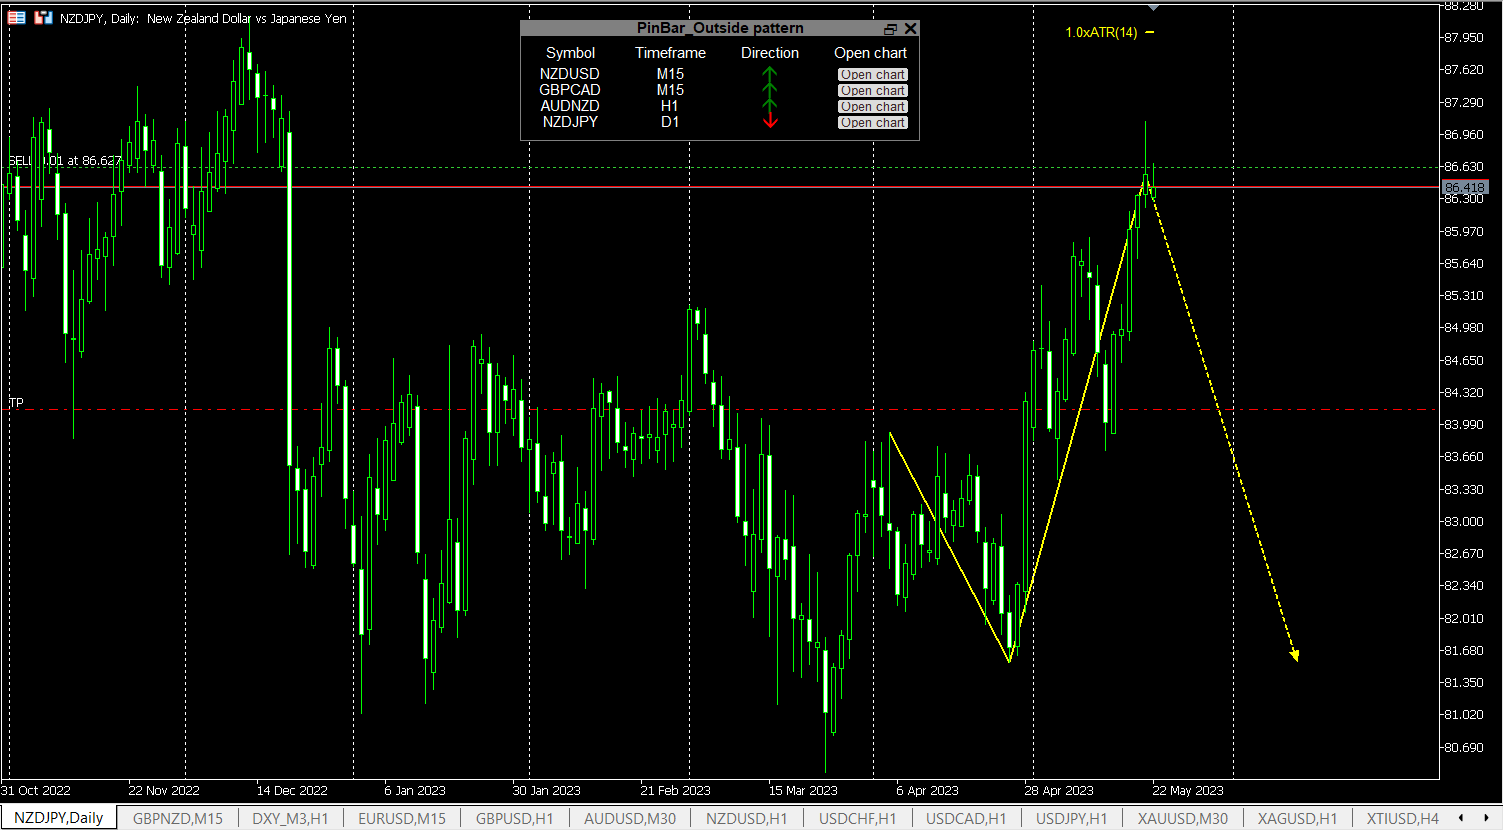
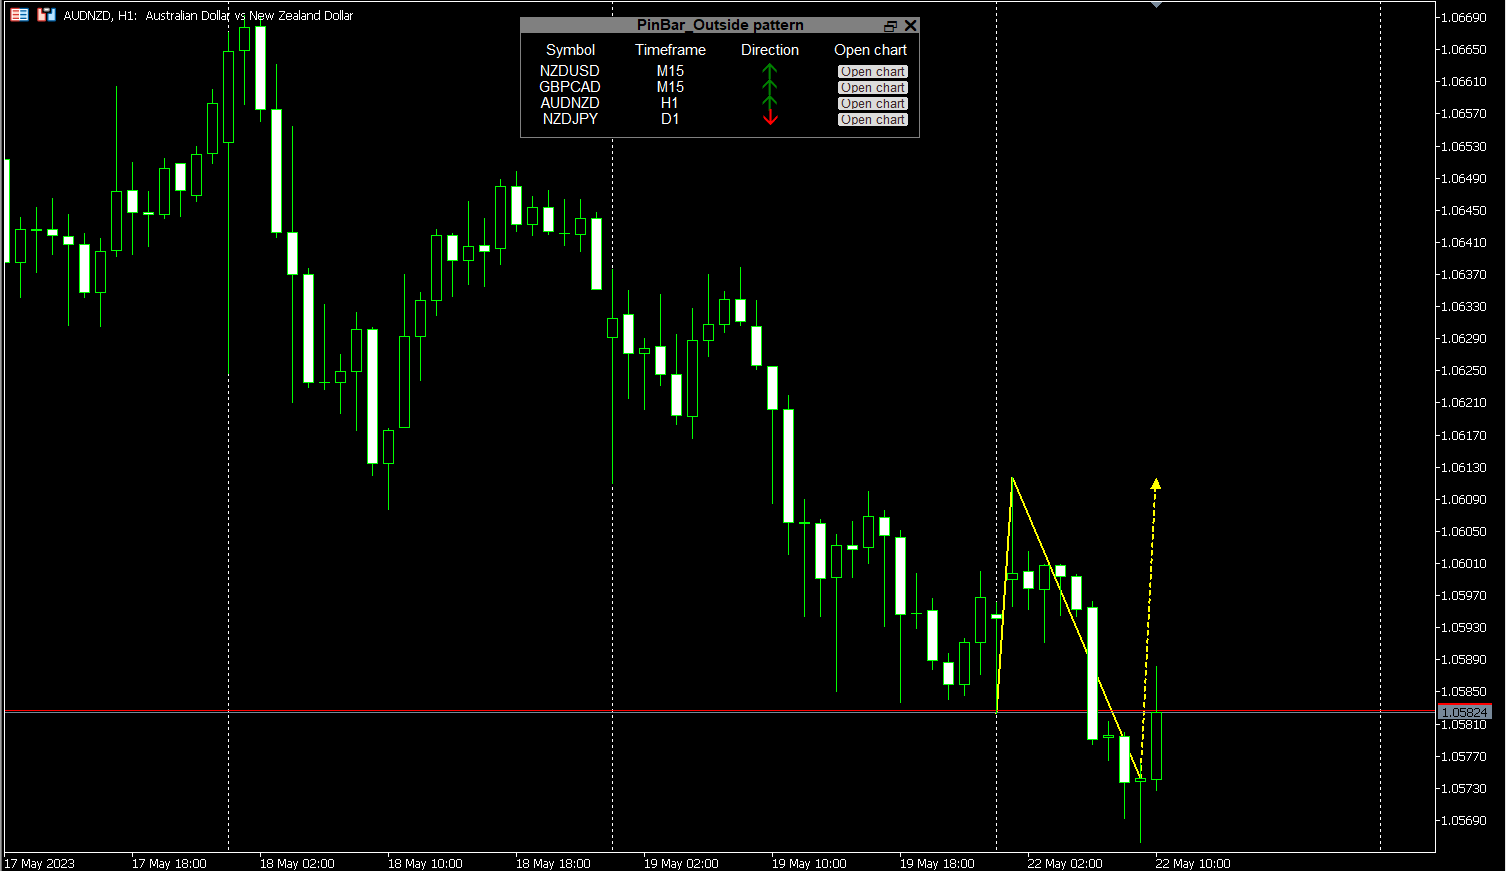
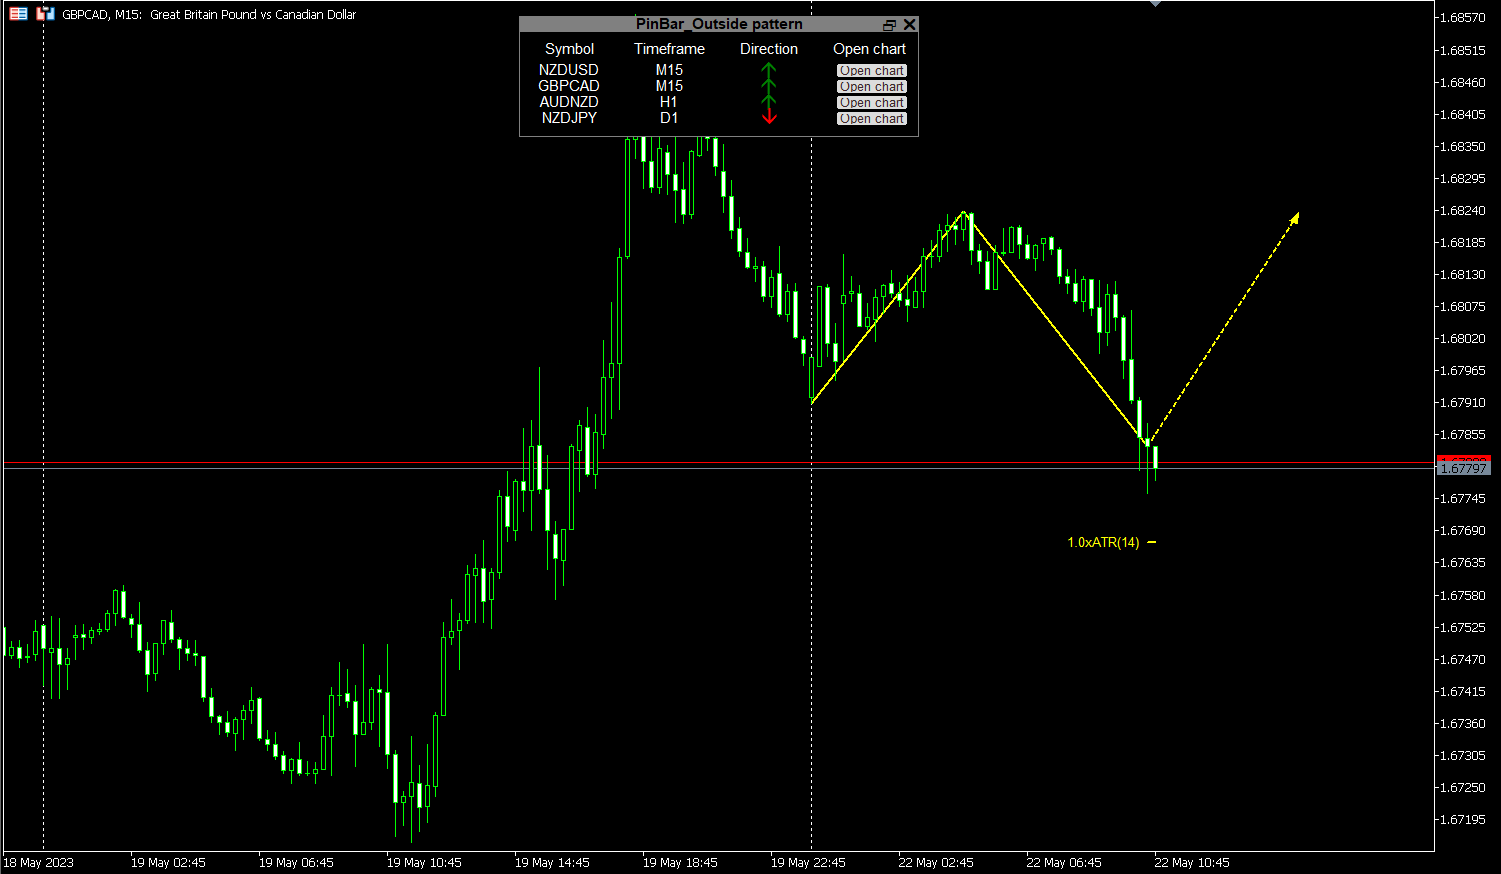
Pinbar Outside Pattern indicator shows in a table symbol, time frame and direction of the last price candle if it matches outside pinbar input parameters. Outside pinbar means that the candle is extreme in the chosen time frame. By clicking 'Open chart' button you can view drawn pattern. You can choose to scan through all the symbols in Market Watch or enter your favorite symbols, and also you can enter time frames you need to scan.

---------Main settings--------

  • Select all symbols from Market Watch? - if Yes the program scans through all the symbols displayed in Market Watch, if No - only selected in the next input symbols are scanned
  • Enter symbols separated by commas - enter symbols separated by commas (they must be selected in Market Watch)
  • Enter timeframes separated by commas - enter time frames separated by commas, e.g. M1,M2...M30,H1,H2...H12, D1,W1,MN1.

--------Candle parameters--------

  • Min candle length in points - enter min candle length in points
  • Min candle wick length in percent (0-100%) - enter min candle wick length in percent from total candle length (0-100%)

----------Draw pattern-----------

  • Line color - choose the color for drawing
  • Line width - enter number for line thickness
  • Place mark for stop loss (in ATR units)? - choose Yes or No
  • Multiplier for stop loss (in ATR units) - enter number what size for stop loss in ATR units you want
  • ATR period - period for ATR indicator

---------Alerts---------

  • Show alerts when PinBar detected? - choose Yes or No from dropdown menu
  • Send email alert when PinBar detected? - choose Yes or No from dropdown menu. If Yes, you need to configure your email settings in Options/Email menu
  • Send push notification when PinBar detected? - choose Yes or No from dropdown menu. If Yes, you need to set your MetaQuotes ID in Options/Notifications menu  

Warning:

  • When placing trades take only clear pinbars, good risk/reward ratio and when there is no big news background

    Notes:

    • In testing mode you can see alerts only in Journals tab


    Useful links:

    Mt5 simuliator: https://mt5simulator.com?bg_ref=rmeiuTuSXA

    For rebates go to https://premiumtrading.co/?ref=13525 and choose broker.


      Prodotti consigliati
      Edge EA Pro MT5
      Aleksandr Zheltikov
      4.75 (4)
      Edge is a fully automated trading system that finds trading opportunities and places trades by combining technical indicators, price action analysis, wave analysis and all-day market pattern analysis using Fibonacci areas. Based on historical market data, the system's thinly layered multilayer neural network is trained to identify patterns and relationships that can be used to predict future price movements. The neural network processes various inputs, including price data, technical indicators
      Breakout Lines MT5
      Carl Gustav Johan Ekstrom
      Note: EA included, download here <----- The Breakout Line in technical analysis serves as a crucial tool for understanding market dynamics and potential shifts in price direction. It's designed to highlight rapid accelerations or declines in the market's trajectory. Unconventional Analysis : The Breakout Line is not your typical technical indicator; it's tailored to capture swift market movements, offering a unique perspective on price trends. Angle of the Breakout Line : The sharper the angle
      Supply Demand Ranger
      Krzysztof Janusz Stankiewic
      5 (2)
      The indicator draws supply and demand zones. The zone timeframe can be set independently of the chart timeframe. For instance, it is possible to set M5 zones on an H4 chart. The importance of zones can be adjusted using the zone strength parameter. Demand zones are displayed if at least one candle in the range of the zone is entirely above the zone. Similarly, supply zones are displayed if at least one candle within the zone is entirely below the zone.
      Description Very precise patterns to detect: entry signals as well as breakout, support and resistance reversal patterns. It points out zones in which, with a high probability, institutional orders with the potential to change the price’s direction and keep moving towards it, have been placed. Support:   We create great tools for the entire trading community. Most of them are free. If you believe in what we do  Support Us Here.   KEY LINKS:   Indicator Manual  -  All Products  How is this ind
      The indicator detects divergence signals - the divergences between the price peaks and the MACD oscillator values. The signals are displayed as arrows in the additional window and are maintained by the messages in a pop-up window, e-mails and push-notifications. The conditions which formed the signal are displayed by lines on the chart and in the indicator window. The indicator parameters MacdFast - fast MACD line period MacdSlow - slow MACD line period MacdSignal - MACD signal line period Mac
      This plots  Fibonacci deviation levels above and below a moving average of the price. Companion indicator to the " Golden Bull Wave Trader "  expert advisor which uses volume\price trend to determine price reversals. https://www.mql5.com/en/market/product/56291 The expert advisor and this indicator were created in order to: Identify ideal and repeatable trade entries with high level of certainty Create a day trading strategy which doesn’t require a hard SL and TP Use alternate risk management me
      This Expert Advisor can be applied to many markets because It exploits basic supply/demand and price action concepts. It identifies the major rotation zones (PRZ), supply and demand zones and supports and resistances within major price trends. It buys at discount zones and sells at premium prices. It can and should be optimized through the Metatrader tester to find the best parameters to use for current market conditions. This is not a fixed strategy rather a full trading algo that will find whi
      Outside Day Reversal EA
      Munkh Od Jargalsaikhan
      Outside day trading strategy looks for a specific pattern in the price chart of a security. The pattern is characterized by a larger range than the previous day, with the high of the day higher than the previous day's high and the low of the day lower than the previous day's low. Works with many symbols, such as BTCUSD, GBPUSD,USDCAD, oil, gas, and others. PLEASE RATE! Thank you very much! FEATURES: - Real Strategy - Daily Bar Strategy - Exit the trade if the day was profitable - ATR multip
      FREE
      This is a multi-symbol and multi-timeframe table-based indicator designed for a candlestick patterns detection with 46 patterns for META TRADER 5. Each formation has own image for easier recognition. Here you find most popular formations such as "Engulfing", "Hammer", "Three Line Strike", "Piercing" or Doji - like candles. Check my full list of patterns on my screenshots below. Also you can not only switch all bearish or bullish patterns from input, but also select formation for a specified symb
      AV Monitor MT5
      Anja Vivia Vogel
      5 (1)
      "AV Monitor MT5" is an indicator for MetaTrader 5, which alowes a history analysis of the closed orders. It helps to achieve a quick visual analysis of your own trading or different expert advisors among themselves. Compare and analyze your expert advisors: Which one is the best? I use an "AV Monitor MT5" indicator per running expert advisor chart to track its performance split into long & short, as well as an index chart e.g. DOW with this indicator and the setting "Show Balance & Equity" to
      Waves Of Fibonacci
      Roman Vashchilin
      3 (2)
      The principle of the indicator operation lies in the analysis of the currency pair history and determining the beginning and the end of the "power" driving the current trend. It also determines the Fibonacci levels in the main window. The indicator also shows how long ago the local Highs and Lows have been reached. How to Use Waves in the subwindow show the strength and the stage of the trend movement. That is, if the waves only start rising, then the trend is in the initial stage. If the wave
      Fractal Advanced MT5
      Siarhei Vashchylka
      5 (3)
      Fractal Advanced - displays Fractal and Alligator indicators on the price chart. Has wide options for settings and customization. It is also equipped with alerts and a hotkey system. Manual (Be sure to read before purchasing) | Version for MT4 Advantages 1. The indicator does not fill the entire chart with fractals, but allows you to display only relevant signals. 2. The number of fractals is adjusted by scrolling the mouse while holding down the Shift key. 3. Instantly show/hide the Alligator
      Bober Real MT5
      Arnold Bobrinskii
      4.76 (17)
      Bober Real MT5 is a fully automatic Forex trading Expert Advisor. This robot was made in 2014 year and did a lot of profitbale trades during this period. So far over 7000% growth on my personal account. There was many updates but 2019 update is the best one. The robot can run on any instrument, but the results are better with EURGBP, GBPUSD, on the M5 timeframe. Robot doesn't show good results in tester or live account if you run incorrect sets. Set files for Live accounts availible only for c
      Strumenti per il guadagno e la ricerca. Il nucleo dei segnali e della strategia di trading si basa sull'algoritmo dell'autore per la formazione di modelli di previsione dei prezzi. Applicabile a qualsiasi strumento! Integrato con un sistema di controllo basato sull'MA "Volpe a nove code" , aggiornando e regolando il segnale nel modo più accurato possibile per il mercato, lo strumento e il periodo di lavoro. Idoneo: tutti gli strumenti in tutti i mercati (ci sono eccezioni). A chi è rivolto: h
      A unique professional tool is a divergence/convergence indicator between  MACD and price, which allows you to receive a signal about a trend reversal in a timely manner or catch price pullback movements (depending on the settings). It is indispensable for those who trade divergences manually or with an Expert Advisor. The indicator settings allow you to adjust the strength of the divergence/convergence due to the angle of the  MACD peaks and the percentage change in price, which makes it possib
      FREE
      HiLo Activator Plus
      Rodrigo Galeote
      5 (1)
      HiLo Activator is one of the most used indicators to determine trend. Find it here with the ability to customize period and colors. This indicator also plots up and down arrows when there is a change on the trend, indicating very strong entry and exit points. HiLo fits well to different types of periods for day trading. You can easily understand when it is time to buy or sell. It works pretty good also for other periods like daily and monthly signalizing long-term trends. The use of the indicato
      MiniMACD
      Kiyoshi Mizu Miyabi Nori
      4.6 (5)
      This is just a MACD with multi symbols, multi timeframes, and multi colors. features. different symbols and timeframes from the main chart. draw main line, signal line, and histogram. each line can be erased. the ascent and descent can be distinguished.  Due to the above features, this MACD is suitable for multiple lineups in a single chart. This can be used in the same way as MiniCandles.  
      FREE
      Leave a review for this product, and receive another "Free" product that you choose. You can see my other products here: https://www.mql5.com/en/users/zakri/seller Trend Detective is an advanced trend detection indicator which shows accurate entry points in direction of trend. It uses smart technology in order to detect entry points, trend changing points, and TP points. It also shows hit rate for current chart using selected parameters. Hit rate for this indicator on different charts can be
      KT Inside Bar Advanced MT5
      KEENBASE SOFTWARE SOLUTIONS
      Despite the popularity of inside bar pattern among the traders, using it as a standalone signal doesn't provide any edge in the market. KT Inside Bar Advanced indicator solves this problem by combining the classic inside bar pattern with the "ECE" cycle and Fibonacci extensions. Using this indicator in place of our classic inside bar indicator will provide a tremendous advantage and edge in the market. What is the ECE cycle? In financial markets, the price never moves in a straight line bu
      Supertrend indicator uses a combination of a moving average and average true range to detect the trend of a trading instrument. Supertrend indicator for MetaTrader 5 easily shows the trend as a line following the price. Triple SuperTrend Histo indicator  calculate  three supertrends to show the trend as a histogram. Changing the color from red to green means you can BUY , from green to red means you can SELL . Description of the method of drawing a histogram. The price is above the EMA 20
      With this easy to set up indicator you can display and set alerts for the following candlestick formations: Bull Breakout, Bear Breakout, Hammer, Pin, Bullish Engulfing, Bearish Engulfing. Input parameters: ShortArrowColor: The color of the Arrows, displaying a Bearish candle formation LongArrowColor: The color of the Arrows displaying a Bullish candle formation BullishEngulfing: Disabled/Enabled/EnabledwithAlert BearishEngulfing: Disabled/Enabled/EnabledwithAlert Pin:  Disabled/Enabled/Enabledw
      FREE
      Gartley Hunter MT5
      Siarhei Vashchylka
      5 (13)
      Gartley Hunter - An indicator for searching for harmonic patterns (Gartley patterns) and their projections. The indicator is equipped with a system of alerts and push notifications. Manual (Be sure to read before purchasing) | Version for MT4 Advantages 1. 12 harmonic patterns: 7 classical and 5 exotic. New patterns will be added as the indicator develops. 2. Constant automatic search for harmonic patterns. The indicator is capable of finding from the smallest to the largest patterns. 3. Autom
      Forex traders often observe increased market activity near Supply and Demand zones, which are levels formed based on zones where strong price movements have previously occurred. The Supply Demand Strong Weak Confirm Indicator utilizes fractals and the ATR indicator to identify and plot support and resistance zones on the price chart. These zones are categorized as follows: - Weak: significant high and low points in the trend. - Untested: crucial turning points in the price chart that the pr
      AW Candle Patterns
      AW Trading Software Limited
      L'indicatore AW Candle Patterns è una combinazione di un indicatore di tendenza avanzato combinato con un potente scanner di modelli di candele. È uno strumento utile per riconoscere ed evidenziare i trenta modelli di candele più affidabili. Inoltre, è un analizzatore di trend attuale basato su barre colorate con a       pannello di trend multi-timeframe plug-in che può essere ridimensionato e posizionato. Una capacità unica di regolare la visualizzazione dei modelli in base al filtraggio delle
      LT Regression Chanel MT5
      Sie Samuel Roland Youl
      Scopri il Canale di Regressione LT, un potente indicatore tecnico che combina elementi dell'analisi di Fibonacci, dell'analisi d'involucro e dell'extrapolation di Fourier. Questo indicatore è progettato per valutare la volatilità di mercato, migliorando al contempo la precisione nell'individuazione dei livelli di ipercomprato e ipervenduto attraverso l'analisi di Fibonacci. Sfrutta inoltre l'extrapolation di Fourier per prevedere le evoluzioni di mercato, integrando dati da questi indicatori. I
      The 123 Pattern is one of the most popular, powerful and flexible chart patterns. The pattern is made up of three price points: a bottom, a peak or valley, and a Fibonacci retracement between 38.2% and 71.8%. A pattern is considered valid when the price breaks beyond the last peak or valley, moment at which the indicator plots an arrow, rises an alert, and the trade can be placed. [ Installation Guide | Update Guide | Troubleshooting | FAQ | All Products ] Clear trading signals Customizable c
      Advanced 4xZeovo MT5 Indicator (MetaTrader 5)   Product Description  4xZeovo is a powerful trading indicator system monitoring 24/7 financial markets. Metatrader5 tool designed to find the best buying/selling opportunities and notifies the user.    Making life easy for traders in helping with the two most difficult decisions with the use of advanced innovate trading indicators aiming to encourage users to hold the winning positions and take profit at the best times.    Equipped with a unique tra
      GriffonArgos
      Haruki Teranaka
      “Griffon Argos” supera le onde agitate del mercato e guarda al futuro degli investimenti, aprendo nuovi orizzonti come vostro partner commerciale. Questo consulente esperto avanzato utilizza algoritmi proprietari per analizzare istantaneamente i dati di mercato e identificare le migliori opportunità di trading. Utilizza l'oscillatore stocastico e l'oscillatore impressionante (AO) per catturare con precisione i movimenti del mercato e generare segnali di trading affidabili. Caratteristiche pri
      FREE
      Fractals
      Mikhail Nazarenko
      The Fractals indicator displays on the chart only fractals with the specified parameters in the indicator settings. This allows you to more accurately record a trend reversal, excluding false reversals. According to the classical definition of a fractal, it is a candlestick - an extremum on the chart, which was not crossed by the price of 2 candles before and 2 candles after the appearance of a fractal candle. This indicator provides the ability to adjust the number of candles before and after t
      Pick Trend
      Nadiya Mirosh
      Pick Trend is a reliable indicator without redrawing that will not leave any trader indifferent. Pick Trend tool, which, based on mathematical calculations, analyze all five aspects: opening price, high, low, closing price and volume. Using the Pick Trend Forex indicator algorithm, you can quickly understand what trend is currently developing in the market. As a result of the calculations, the Pick Trend technical indicator is plotted on the chart in the form of a set of points for easy inter
      Gli utenti di questo prodotto hanno anche acquistato
      Atomic Analyst MT5
      Issam Kassas
      5 (12)
      Innanzitutto, vale la pena sottolineare che questo indicatore di trading non è repaint, non è ridisegno e non presenta ritardi, il che lo rende ideale sia per il trading manuale che per quello automatico. L'Analista Atomico è un indicatore di azione del prezzo PA che utilizza la forza e il momentum del prezzo per trovare un miglior vantaggio sul mercato. Dotato di filtri avanzati che aiutano a rimuovere rumori e segnali falsi, e aumentare il potenziale di trading. Utilizzando più strati di in
      Innanzitutto è importante sottolineare che questo sistema di trading è un indicatore Non-Repainting, Non-Redrawing e Non-Lagging, il che lo rende ideale sia per il trading manuale che per quello automatico. Il "Sistema di Trading Smart Trend MT5" è una soluzione completa pensata sia per i trader principianti che per quelli esperti. Combina oltre 10 indicatori premium e offre più di 7 robuste strategie di trading, rendendolo una scelta versatile per diverse condizioni di mercato. Strategia di Tre
      FX Volume MT5
      Daniel Stein
      4.94 (17)
      Ricevi il tuo aggiornamento quotidiano sul mercato con dettagli e schermate tramite il nostro Morning Briefing qui su mql5 e su Telegram ! FX Volume è il PRIMO e UNICO indicatore di volume che fornisce una visione REALE del sentiment del mercato dal punto di vista del broker. Fornisce informazioni straordinarie su come gli operatori di mercato istituzionali, come i broker, sono posizionati sul mercato Forex, molto più velocemente dei rapporti COT. Vedere queste informazioni direttamente sul vo
      Quantum Trend Sniper
      Bogdan Ion Puscasu
      5 (38)
      Presentazione       Quantum Trend Sniper Indicator   , l'innovativo indicatore MQL5 che sta trasformando il modo in cui identifichi e scambi le inversioni di tendenza! Sviluppato da un team di trader esperti con un'esperienza di trading di oltre 13 anni,       Indicatore Quantum Trend Sniper       è progettato per spingere il tuo viaggio di trading verso nuove vette con il suo modo innovativo di identificare le inversioni di tendenza con una precisione estremamente elevata. *** Acquista Quant
      Trend Screener Pro MT5
      STE S.S.COMPANY
      4.87 (62)
      Indicatore di tendenza, soluzione unica rivoluzionaria per il trading di tendenze e il filtraggio con tutte le importanti funzionalità di tendenza integrate in un unico strumento! È un indicatore multi-timeframe e multi-valuta al 100% non ridipingibile che può essere utilizzato su tutti i simboli/strumenti: forex, materie prime, criptovalute, indici e azioni. Trend Screener è un indicatore di tendenza che segue un indicatore efficiente che fornisce segnali di tendenza a freccia con punti nel gra
      Presentazione       Quantum Breakout PRO   , l'innovativo indicatore MQL5 che sta trasformando il modo in cui scambi le zone di breakout! Sviluppato da un team di trader esperti con un'esperienza di trading di oltre 13 anni,       Quantum Breakout PRO       è progettato per spingere il tuo viaggio di trading a nuovi livelli con la sua strategia innovativa e dinamica della zona di breakout. Quantum Breakout Indicator ti fornirà frecce di segnalazione sulle zone di breakout con 5 zone target
      Innanzitutto, vale la pena sottolineare che questo Strumento di Trading è un Indicatore Non-Ridipingente, Non-Ridisegnante e Non-Laggante, il che lo rende ideale per il trading professionale. L'Indicatore Smart Price Action Concepts è uno strumento molto potente sia per i nuovi che per i trader esperti. Racchiude più di 20 utili indicatori in uno solo, combinando idee di trading avanzate come l'Analisi del Trader del Circolo Interno e le Strategie di Trading dei Concetti del Denaro Intelligen
      A key element in trading is zones or levels from which decisions to buy or sell a trading instrument are made. Despite attempts by major players to conceal their presence in the market, they inevitably leave traces. Our task was to learn how to identify these traces and interpret them correctly. Reversal First Impulse levels (RFI)   -  Version MT4                  INSTRUCTIONS                 RUS                 ENG                         R ecommended to use with an indicator   -  TREND PRO  
      TPSproTREND PrO MT5
      Roman Podpora
      5 (6)
      TPSpro TRENDPRO  - is a trend indicator that automatically analyzes the market and provides information about the trend and each of its changes, as well as giving signals for entering trades without redrawing! The indicator uses each candle, analyzing them separately. referring to different impulses - up or down impulse. Exact entry points into transactions for currencies, crypto, metals, stocks, indices!  -  Version MT4                  DETAILED DESCRIPTION        /       TRADING SETUPS       
      MetaForecast M5
      Vahidreza Heidar Gholami
      5 (2)
      MetaForecast predice e visualizza il futuro di qualsiasi mercato basandosi sull'armonia dei dati dei prezzi. Sebbene il mercato non sia sempre prevedibile, se esiste un modello nei prezzi, MetaForecast può prevedere il futuro con la massima precisione possibile. Rispetto ad altri prodotti simili, MetaForecast può generare risultati più accurati analizzando le tendenze di mercato. Parametri di input Past size (Dimensione passata) Specifica il numero di barre che MetaForecast utilizza per creare
      Quantum Heiken Ashi PRO MT5
      Bogdan Ion Puscasu
      4.5 (8)
      Ti presentiamo   Quantum Heiken Ashi PRO Progettate per fornire informazioni chiare sulle tendenze del mercato, le candele Heiken Ashi sono rinomate per la loro capacità di filtrare il rumore ed eliminare i falsi segnali. Dì addio alle confuse fluttuazioni dei prezzi e dai il benvenuto a una rappresentazione grafica più fluida e affidabile. Ciò che rende il Quantum Heiken Ashi PRO davvero unico è la sua formula innovativa, che trasforma i dati tradizionali delle candele in barre colorate di faci
      Advanced Supply Demand MT5
      Bernhard Schweigert
      4.53 (15)
      La migliore soluzione per qualsiasi principiante o trader esperto! Questo indicatore è uno strumento di trading unico, di alta qualità e conveniente perché abbiamo incorporato una serie di funzionalità proprietarie e una nuova formula. Con questo aggiornamento, sarai in grado di mostrare fusi orari doppi. Non solo potrai mostrare una TF più alta, ma anche entrambe, la TF del grafico, PIÙ la TF più alta: SHOWING NESTED ZONES. Tutti i trader di domanda di offerta lo adoreranno. :) Informazioni imp
      AW Trend Predictor MT5
      AW Trading Software Limited
      4.77 (56)
      La combinazione di trend e livelli di rottura in un unico sistema. Un algoritmo di indicatore avanzato filtra il rumore del mercato, determina la tendenza, i punti di ingresso e i possibili livelli di uscita. I segnali indicatori sono registrati in un modulo statistico, che permette di selezionare gli strumenti più adatti, mostrando l'efficacia dello storico dei segnali. L'indicatore calcola i segni Take Profit e Stop Loss. Manuale e istruzioni ->   QUI   / versione MT4 ->   QUI Come fare tradi
      FX Power MT5 NG
      Daniel Stein
      5 (5)
      Ricevi il tuo aggiornamento quotidiano sul mercato con dettagli e schermate tramite il nostro Morning Briefing qui su mql5 e su Telegram ! FX Power MT5 NG è la nuova generazione del nostro popolare misuratore di forza delle valute, FX Power. Cosa offre questo misuratore di forza di nuova generazione? Tutto ciò che avete amato dell'FX Power originale IN PIÙ Analisi della forza di ORO/XAU Risultati di calcolo ancora più precisi Periodi di analisi configurabili individualmente Limite di calcolo pe
      This is arguably the most complete harmonic price formation auto-recognition indicator you can find for the MetaTrader Platform. It detects 19 different patterns, takes fibonacci projections as seriously as you do, displays the Potential Reversal Zone (PRZ) and finds suitable stop-loss and take-profit levels. [ Installation Guide | Update Guide | Troubleshooting | FAQ | All Products ] It detects 19 different harmonic price formations It plots primary, derived and complementary Fibonacci p
      Gartley Hunter Multi
      Siarhei Vashchylka
      5 (6)
      Gartley Hunter Multi - An indicator for searching for harmonic patterns simultaneously on dozens of trading instruments and on all classic timeframes: (m1, m5, m15, m30, H1, H4, D1, Wk, Mn). Manual (Be sure to read before purchasing) | Version for MT4 Advantages 1. Patterns: Gartley, Butterfly, Shark, Crab. Bat, Alternate Bat, Deep Crab, Cypher 2. Simultaneous search for patterns on dozens of trading instruments and on all classic timeframes 3. Search for patterns of all possible sizes. Fr
      Noize Absorption Index - is the manual trading system that measures the difference of pressure between bears forces and bulls forces. Green line - is a noize free index that showing curent situation. Zero value of index shows totally choppy/flat market.Values above zero level shows how powerfull bullish wave is and values below zero measures bearish forces.Up arrow appears on bearish market when it's ready to reverse, dn arrow appears on weak bullish market, as a result of reverse expectation.
      IX Power MT5
      Daniel Stein
      5 (2)
      IX Power   porta finalmente l'imbattibile precisione di FX Power ai simboli non-Forex. Determina con precisione l'intensità delle tendenze a breve, medio e lungo termine dei vostri indici preferiti, azioni, materie prime, ETF e persino criptovalute. Potete   analizzare tutto ciò che   il vostro terminale ha da offrire. Provatelo e sperimentate come   il vostro tempismo migliori significativamente   durante il trading. Caratteristiche principali di IX Power Risultati di calcolo precisi al
      RelicusRoad Pro MT5
      Relicus LLC
      4.82 (22)
      Ora $ 147 (aumentando a $ 499 dopo alcuni aggiornamenti) - account illimitati (PC o MAC) Manuale utente di RelicusRoad + Video di formazione + Accesso al gruppo Discord privato + Stato VIP UN NUOVO MODO DI GUARDARE IL MERCATO RelicusRoad è l'indicatore di trading più potente al mondo per forex, futures, criptovalute, azioni e indici, fornendo ai trader tutte le informazioni e gli strumenti di cui hanno bisogno per rimanere redditizi. Forniamo analisi tecniche e piani di trading per aiutar
      Top indicator for MT5   providing accurate signals to enter a trade without repainting! It can be applied to any financial assets:   forex, cryptocurrencies, metals, stocks, indices .  Watch  the video  (6:22) with an example of processing only one signal that paid off the indicator! MT4 version is here It will provide pretty accurate trading signals and tell you when it's best to open a trade and close it. Most traders improve their trading results during the first trading week with the help of
      ICT, SMC, SMART MONEY CONCEPTS, SMART MONEY, Smart Money Concept, Support and Resistance, Trend Analysis, Price Action, Market Structure, Order Blocks, BOS/CHoCH,   Breaker Blocks ,  Momentum Shift,   Supply&Demand Zone/Order Blocks , Strong Imbalance,   HH/LL/HL/LH,    Fair Value Gap, FVG,  Premium  &   Discount   Zones, Fibonacci Retracement, OTE, Buy Side Liquidity, Sell Side Liquidity, BSL/SSL Taken, Equal Highs & Lows, MTF Dashboard, Multiple Time Frame, BigBar, HTF OB, HTF Market Structure
      Matrix Arrow Indicator MT5
      Juvenille Emperor Limited
      5 (14)
      Matrix Arrow Indicator MT5   è un trend unico 10 in 1 che segue un indicatore multi-timeframe al   100% non ridipinto   che può essere utilizzato su tutti i simboli/strumenti:   forex ,   materie prime ,   criptovalute ,   indici ,   azioni .  Matrix Arrow Indicator MT5  determinerà la tendenza attuale nelle sue fasi iniziali, raccogliendo informazioni e dati da un massimo di 10 indicatori standard, che sono: Indice di movimento direzionale medio (ADX) Indice del canale delle materie prime (CCI
      Volume by Price MT5
      Brian Collard
      5 (3)
      The Volume by Price Indicator for MetaTrader 5 features Volume Profile and Market Profile TPO (Time Price Opportunity). Get valuable insights out of currencies, equities and commodities data. Gain an edge trading financial markets. Volume and TPO histogram bar and line charts. Volume Footprint charts. TPO letter and block marker charts including split structures. Versatile segmentation and compositing methods. Static, dynamic and flexible ranges with relative and/or absolute visualizations. Lay
      Golden Gate Algo MT5
      James David Lane
      4 (6)
      40% DI SCONTO PER NATALE! AUMENTO DEL PREZZO A $250 IL 1 GENNAIO! Presentiamo GoldenGate Entries: una soluzione di trading all'avanguardia! Scopri un approccio rivoluzionario al trading con GoldenGate Entries (GGE), un indicatore avanzato progettato per migliorare la tua esperienza di trading. GGE offre un set completo di funzionalità per fornire agli utenti precisione e fiducia nelle loro decisioni di trading. Coppie: Qualsiasi (FX - Materie prime - Azioni - Azioni - Cripto) TimeFrame
      Blahtech Supply Demand MT5
      Blahtech Limited
      4.57 (14)
      Was: $299  Now: $99   Supply Demand uses previous price action to identify potential imbalances between buyers and sellers. The key is to identify the better odds zones, not just the untouched ones. Blahtech Supply Demand indicator delivers functionality previously unavailable on any trading platform. This 4-in-1 indicator not only highlights the higher probability zones using a multi-criteria strength engine, but also combines it with multi-timeframe trend analysis, previously confirmed swings
      Owl Smart Levels MT5
      Sergey Ermolov
      4.49 (37)
      Versione MT4  |  FAQ L' indicatore Owl Smart Levels è un sistema di trading completo all'interno dell'unico indicatore che include strumenti di analisi di mercato popolari come i frattali avanzati di Bill Williams , Valable ZigZag che costruisce la corretta struttura a onde del mercato, e i livelli di Fibonacci che segnano i livelli esatti di entrata nel mercato e luoghi per prendere profitti. Descrizione dettagliata della strategia Istruzioni per lavorare con l'indicatore Consulente-assistente
      Good day! I present to you a trading technical indicator for Deriv broker synthetic indices. This indicator ONLY works with the following indices: Boom 300 Index Boom 500 Index Boom 1000 Index Crash 300 Index Crash 500 Index Crash 1000 Index The indicator was created to give signals to open medium-term trades in the direction of Spikes. But you can open trades in the opposite direction to Spikes, at your own risk. Trade only on M1. Other TFs do not guarantee the correct operation of the indic
      Auto Order Block with break of structure based on ICT and Smart Money Concepts Futures Break of Structure ( BoS )             Order block ( OB )            Higher time frame Order block / Point of Interest ( POI )    shown on current chart           Fair value Gap ( FVG ) / Imbalance   ,  MTF      ( Multi Time Frame )    Volume Imbalance     ,  MTF          vIMB Gap’s Equal High / Low’s     ,  MTF             EQH / EQL Liquidity               Current Day High / Low           HOD /
      TrendDecoder Premium MT5
      Christophe, Pa Trouillas
      5 (1)
      Identificare i range e le prossime mosse probabili     |    Ottenere i primi segnali e la forza delle tendenze     |    Ottenere uscite chiare prima dell'inversione     |    Individuare i livelli di Fibo che il prezzo testerà   |  Indicatore non tracciante e non ritardato - ideale per il trading manuale e automatizzato - adatto a tutti gli asset e a tutte le unità temporali 50% di sconto   - per il lancio poi torna a   >>   149 $ Dopo l'acquisto,   contattatemi su questo canale  per le impostazi
      La soluzione migliore per ogni principiante o trader esperto! Questo indicatore è uno strumento di trading unico, di alta qualità e conveniente perché abbiamo incorporato una serie di caratteristiche proprietarie e una formula segreta. Con un solo grafico fornisce avvisi per tutte le 28 coppie di valute. Immaginate come migliorerà il vostro trading perché sarete in grado di individuare l'esatto punto di innesco di una nuova tendenza o opportunità di scalping! Costruito su nuovi algoritmi so
      Altri dall’autore
      SFP pattern mql5
      Egidijus Bikulcius
      A Swing Failure Pattern ( SFP ) is a trade setup in which big traders hunt stop-losses above a key swing high or below a key swing low for the purpose of generating the liquidity needed to push price in the opposite direction. When price 1) pierces above a key swing high but then 2) closes back below that swing high, we have a potential bearish SFP . Bearish SFPs offer opportunities for short trades. When price 1) dumps below a key swing low but then 2) closes back above that swing low, we have
      SR levels true mql4
      Egidijus Bikulcius
      5 (1)
      Indicator SR levels true in small time frames is very useful for scalping while in bigger ones it is good for day or position trading. SR levels true can draw 4 support/resistance levels based on defined maximum rebouds from price level. Indicator scans  defined number of bars in time axis and defined number of pips in price axis (both sides - up and down) and calculates how much times price was rejected from scanned price levels. At the price levels where maximum rebounds are counted, support
      FREE
      FZR Fractal Zigzag Reversal
      Egidijus Bikulcius
      4 (5)
      FZR indicator determines fractal zigzag reversal pattern of all the time frames of the chosen symbol and shows the information in the Info label. Indicator draws the detected pattern in the chosen time frame and also you can select in the menu to draw the trend line according to FZR peaks. What it is FZR? See the first picture in the screenshots. As you can see for every peak of FZR the AO indicator must cross zero line. FZR indicator determines the trend direction. How to use FZR for trading?
      FREE
      Candle Pattern Alert mql4
      Egidijus Bikulcius
      5 (1)
      Candle Pattern Alert indicator alerts when the last price closed candle matches the set input parameters. You can choose to scan through all the symbols in Market Watch or enter your favorite symbols and also you can enter time frames you need to scan. --------- Main settings- ------- Select all symbols from Market Watch? - if Yes the program scans through all the symbols displayed in Market Watch, if No - only selected in next input symbols are scanned Enter symbols separated by commas - enter
      FREE
      Pivot levels
      Egidijus Bikulcius
      4.5 (2)
      Pivot levels is indicator showing 7 pivot levels. It is adjusted for major use, including: all standard time frames choice of periods to show three popular calculation formulas (typical, median, weighted) 9 level Camarilla pivot pivot day shift choice of properties for lines and labels choice of showing alerts when crossing pivot lines Parameters: ----------Main parameters----------- Timeframe - time frame for pivot levels Number of periods to show - displays pivot levels for number of period
      FREE
      SFP pattern mql4
      Egidijus Bikulcius
      4.33 (3)
      A Swing Failure Pattern ( SFP ) is a trade setup in which big traders hunt stop-losses above a key swing high or below a key swing low for the purpose of generating the liquidity needed to push price in the opposite direction. When price 1) pierces above a key swing high but then 2) closes back below that swing high, we have a potential bearish SFP . Bearish SFPs offer opportunities for short trades. When price 1) dumps below a key swing low but then 2) closes back above that swing low, we have
      FZR indicator determines fractal zigzag reversal pattern of all the time frames of the chosen symbol and shows the information in the Info label. Indicator draws the detected pattern in the chosen time frame and also you can select in the menu to draw the trend line according to FZR peaks. What it is FZR? See the first picture in the screenshots. As you can see for every peak of FZR the AO indicator must cross zero line. FZR indicator determines the trend direction. How to use FZR for trading?
      Pivot levels mql5
      Egidijus Bikulcius
      Pivot levels indicator shows 7(9 for Camarilla) pivot levels. It is adjusted for major use, including: all standard time frames choice of periods to show four popular calculation formulas (typical, median, weighted and Camarilla) pivot day shift choice of properties for lines and labels choice of showing alerts when crossing pivot lines Parameters: ----------Main parameters----------- Timeframe - time frame for pivot levels Number of periods to show - displays pivot levels for number of perio
      SR levels true
      Egidijus Bikulcius
      Indicator SR levels true in small time frames is very useful for scalping while in bigger ones it is good for day or position trading. SR levels true can draw 4 support/resistance levels based on defined maximum rebouds from price level. Indicator scans  defined number of bars in time axis and defined number of pips in price axis (both sides - up and down) and calculates how much times price was rejected from scanned price levels. At the price levels where maximum rebounds are counted, support
      Candle Pattern Alert indicator alerts when the last price closed candle matches the set input parameters. You can choose to scan through all the symbols in Market Watch or enter your favorite symbols and also you can enter time frames you need to scan. ---------Main settings-------- Select all symbols from Market Watch? - if Yes the program scans through all the symbols displayed in Market Watch, if No - only selected in next input symbols are scanned Enter symbols separated by commas - enter s
      Indicator Constant TF Moving Average basically is the same Moving Average indicator, but differently it always shows the price values of chosen time frame. Also, number of periods to show can be selected. Indicators purpose is to use it as support and resistance level in smaller time frames than selected in Input menu. How it looks like you can see in screenshots and video. ---------Main settings-------- Timeframe - choose time frame from dropdown menu Number of periods to show - enter the integ
      Impuls Fibo
      Egidijus Bikulcius
      Impulse Fibo indicator is used to determine price levels after some price impulse occurs. How to use it you can see in screenshots and video. In the indicator setup you can fix two different setups for two different patterns. For drawing convenience also two different rectangles can be easy put on the screen to draw support/resistance levels. . Inputs Draw pattern 1 Line color - choose color from dropdown menu Line style - choose style from dropdown menu Line width - enter integer number 1,2
      Filtro:
      Nessuna recensione
      Rispondi alla recensione