Impulse correction and SCOB mapper WinWorld

DESCRIZIONE

ICSM (Impulse-Correction SCOB Mapper) è l'indicatore che analizza il movimento dei prezzi e identifica impulsi validi, correzioni e SCOB (Single Candle Order Block). È uno strumento potente che può essere utilizzato con qualsiasi tipo di analisi tecnica perché è flessibile, informativo, facile da usare e migliora sostanzialmente la consapevolezza del trader delle zone di interesse più liquide.

IMPOSTAZIONI

Generale | Visivi

Tema colore — definisce il tema colore dell'ICSM.

SCOB | Visivi

Mostra SCOB — abilita/disabilita SCOB;
Marca SCOB con — rappresenta un elenco di opzioni di stile per la rappresentazione SCOB;
Colore SCOB — definisce il colore dello SCOB;

ICM | Visivi

Mostra linee ICM — abilita/disabilita le linee ICM (Impulse-Correction Mapper);
Mostra tendenza IC — abilita/disabilita la visualizzazione della tendenza impulso-correzione tramite un divisore colorato nella parte inferiore del grafico;
Colore linea — definisce il colore delle linee ICM;
Stile linea — definisce lo stile delle linee ICM;

Avvisi

ICM — abilita/disabilita l'avviso per la rottura delle linee ICM;
SCOB — abilita/disabilita l'avviso per la creazione di SCOB;
ICM+SCOB — abilita/disabilita l'avviso per l'occorrenza di SCOB alla fine dell'impulso/correzione singola, che cattura la liquidità della linea ICM.
ICM+SCOB (stessa candela) — abilita/disabilita l'avviso per l'occorrenza di SCOB sulla candela che cattura la liquidità della linea ICM.

CONCETTI IMPORTANTI

Per comprendere appieno cosa può fare ICSM, facciamo una rapida panoramica dei concetti più importanti su cui si basa questo indicatore.

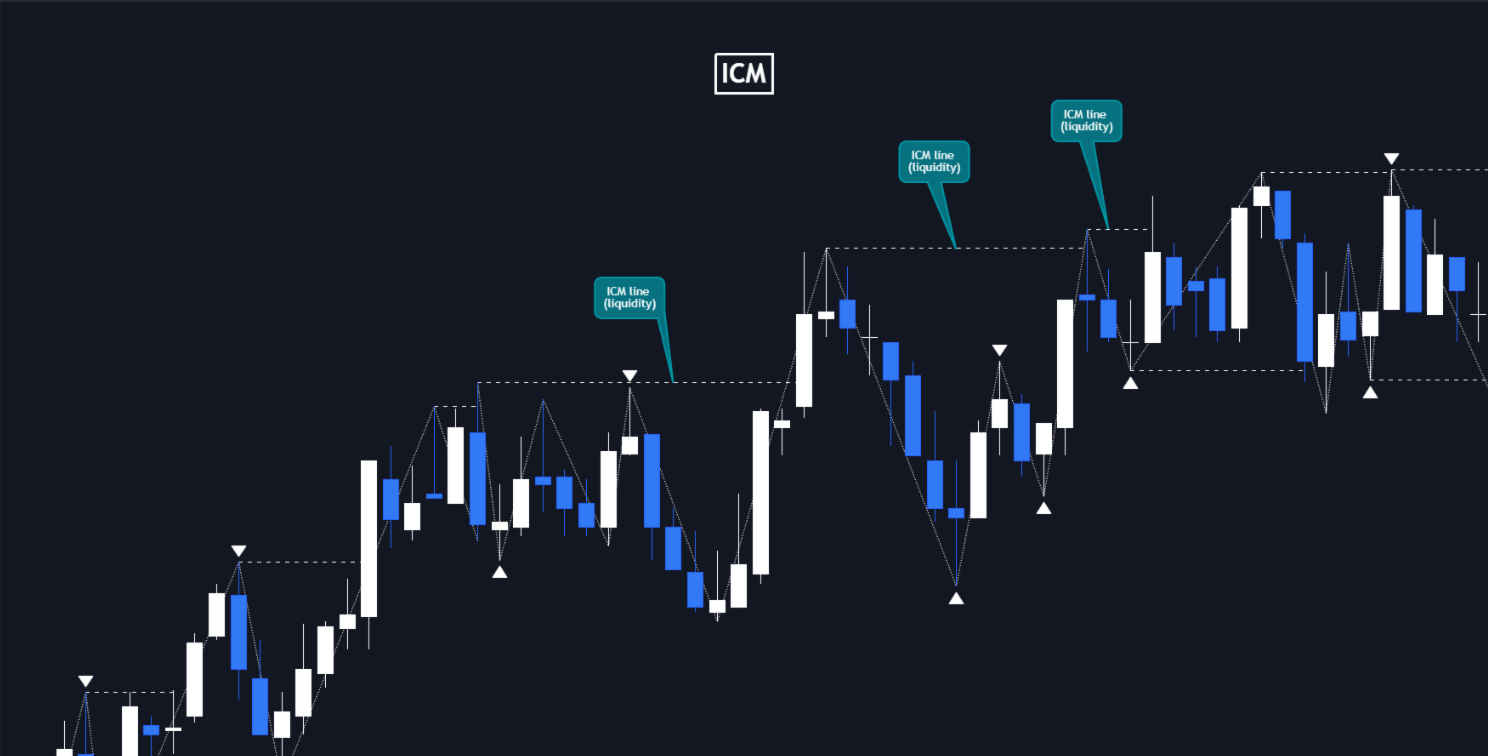
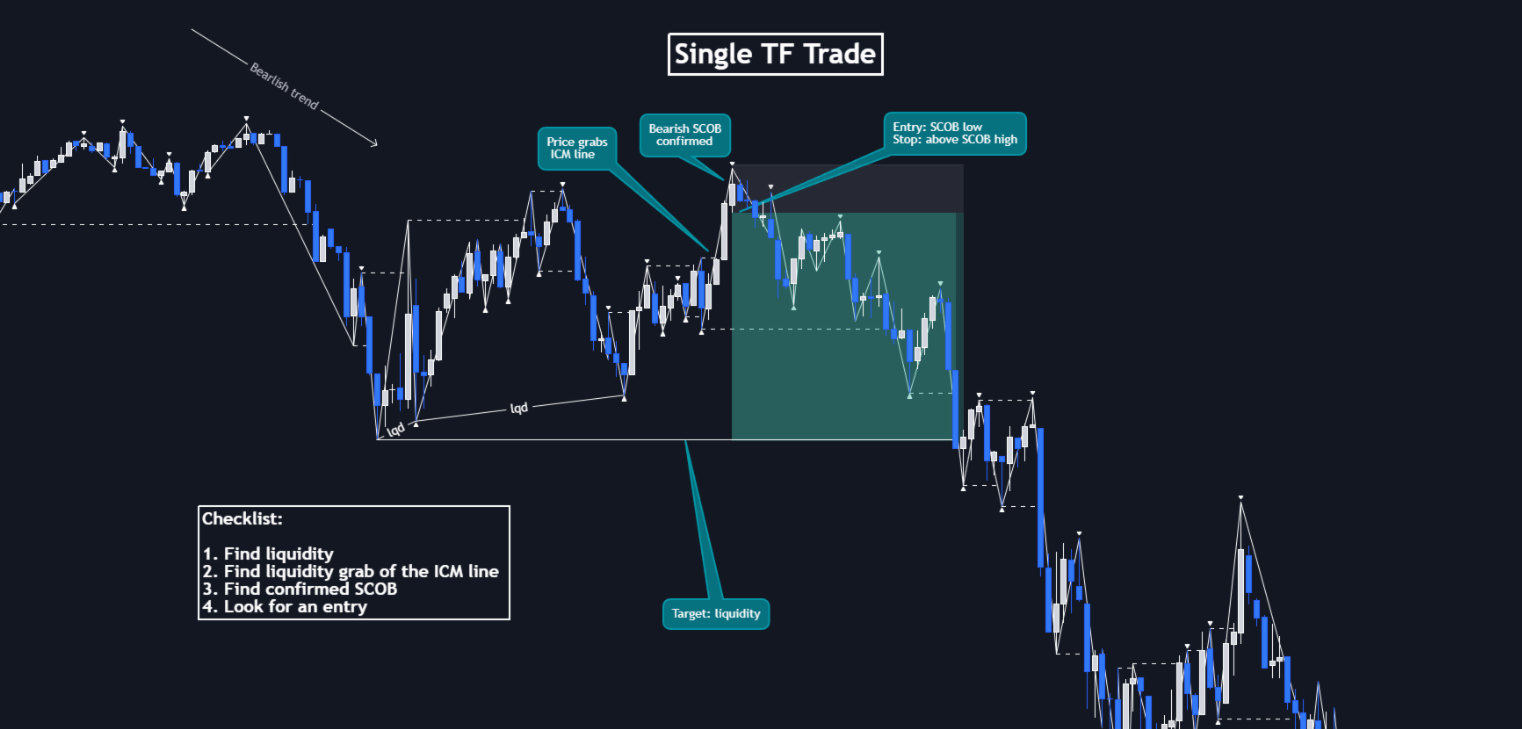
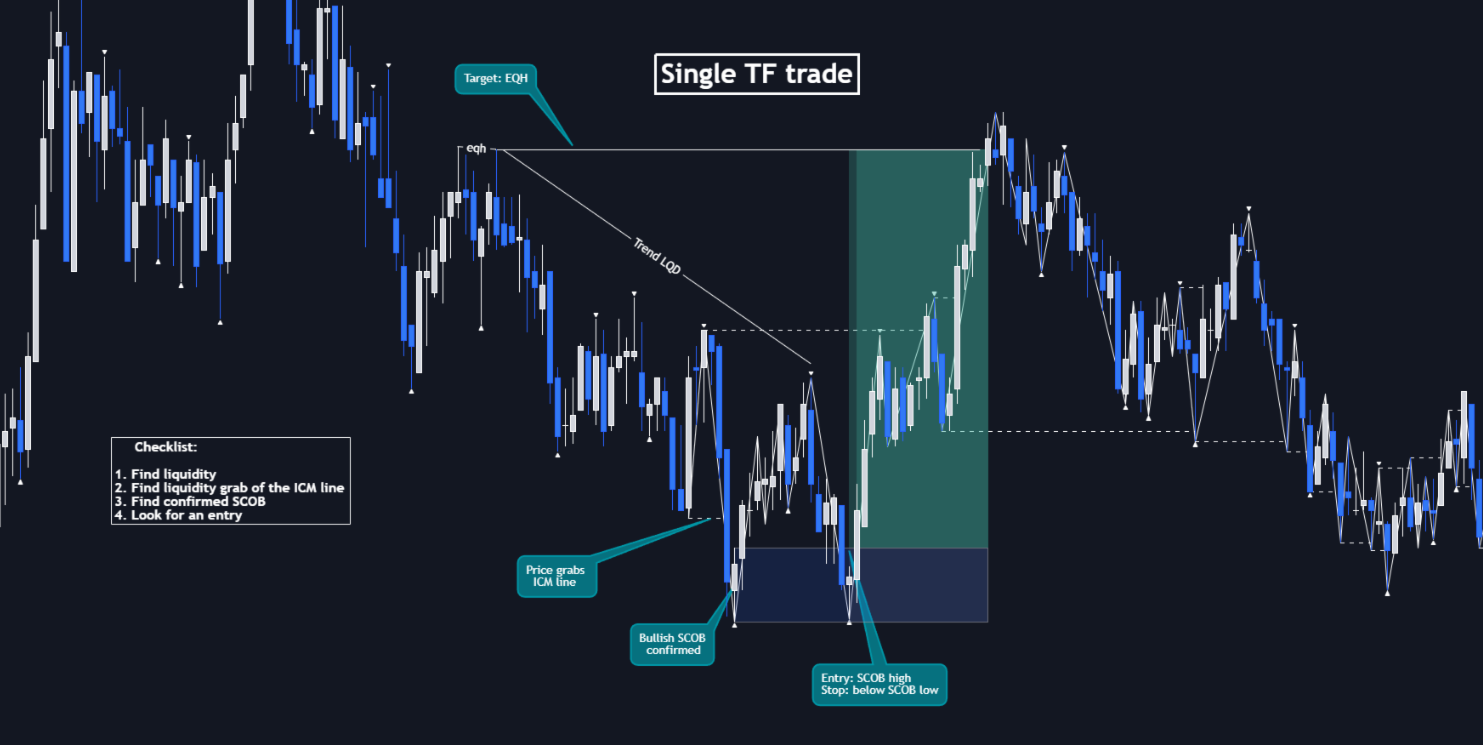
Per ICM intendiamo la cattura di liquidità delle linee dell'Impulse-Correction Mapper (linee ICM; rappresentate come linee orizzontali tratteggiate sul grafico). In breve, le catture di liquidità delle linee ICM offrono grandi opportunità per trovare ottimi punti di ingresso.

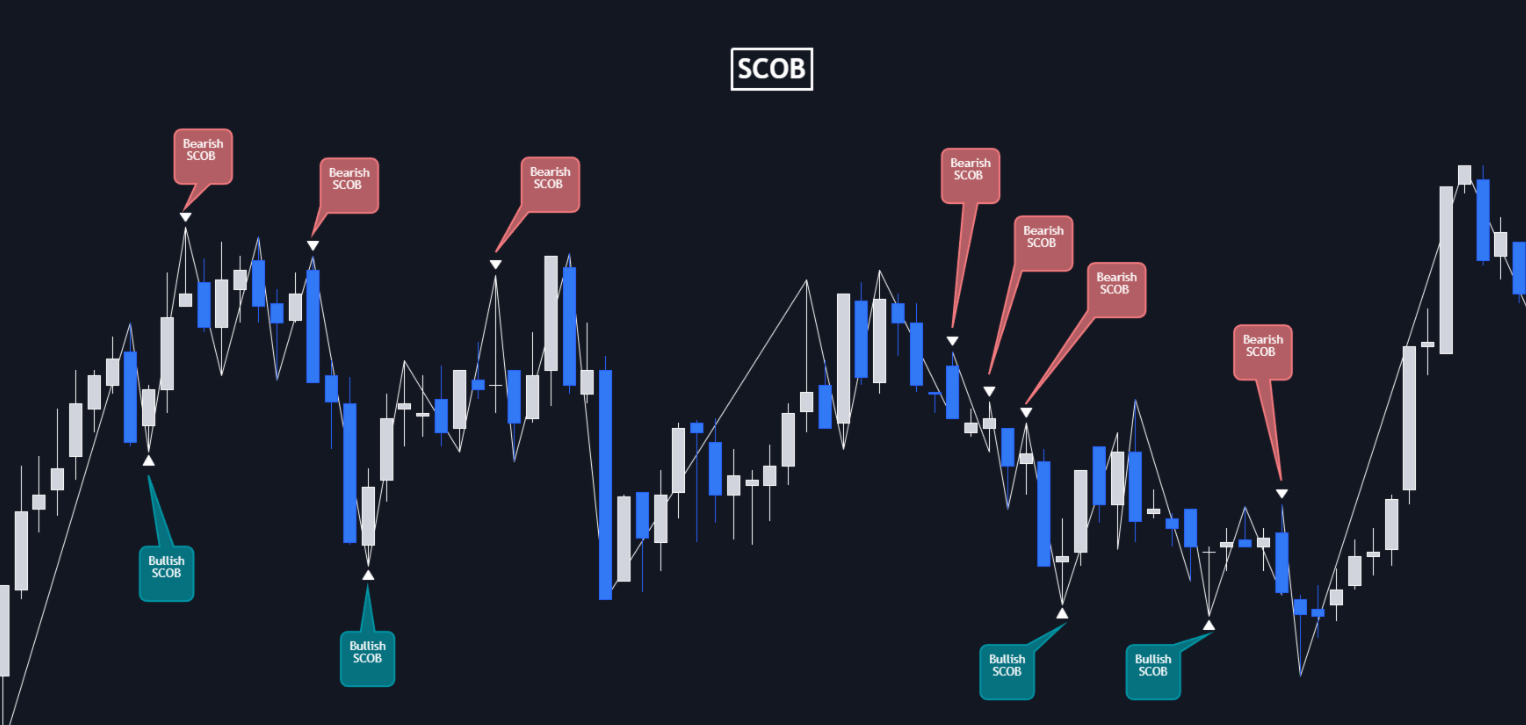
SCOB (Single Candle Order Block) si costruisce secondo 3 semplici regole:

1. La liquidità della candela precedente viene catturata;
2. La candela attuale si chiude all'interno della candela precedente;
3. Si verifica uno squilibrio sulla candela successiva.

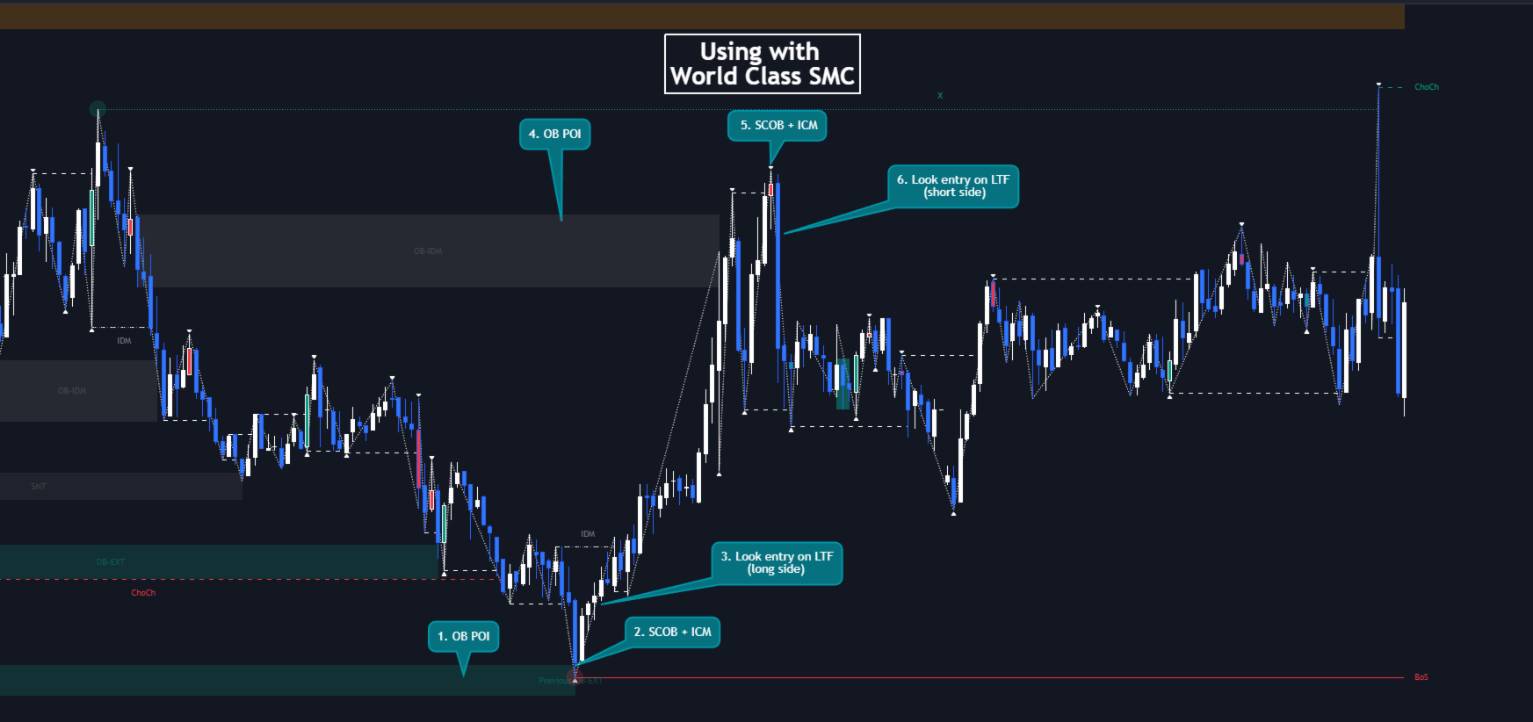
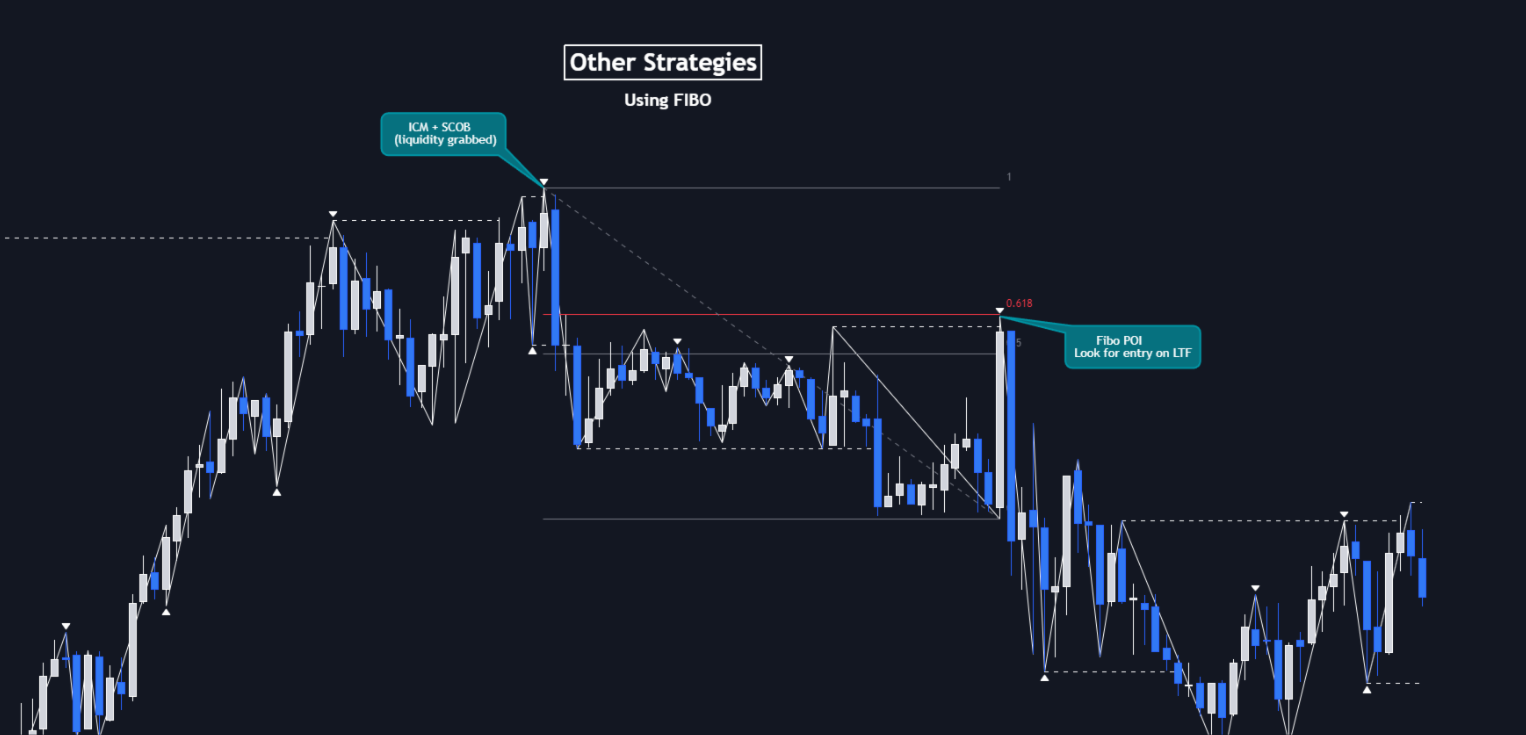
SCOB è una zona di interesse molto utile, da cui il prezzo di solito inverte. Puoi anche usare SCOB come POI* su HTF** o come zona di ingresso su LTF***.

* POI — Punto di Interesse
** HTF — Timeframe Superiore
*** LTF — Timeframe Inferiore

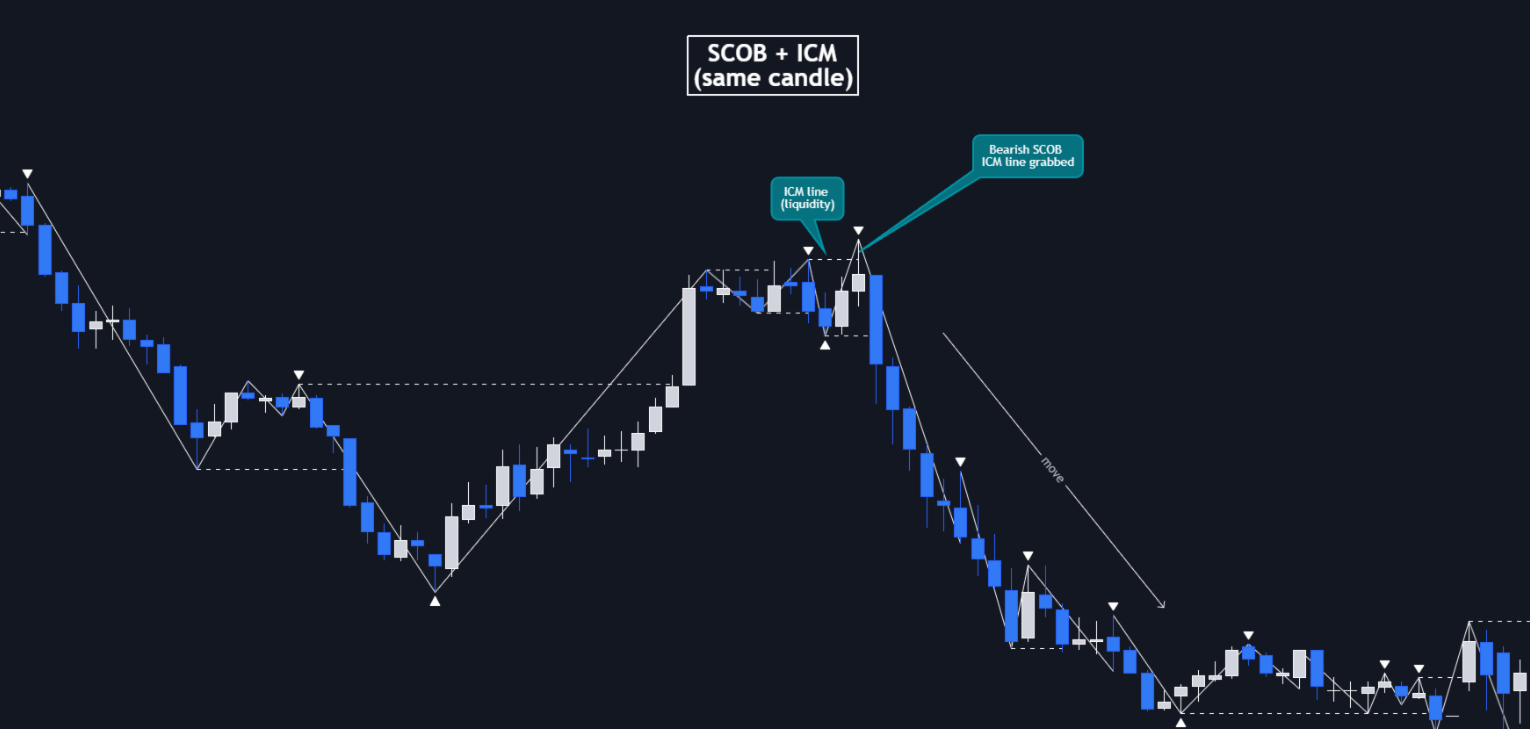
"ICM+SCOB" è un nome breve che usiamo per l'evento in cui il prezzo prima cattura la liquidità dalla linea ICM e poi crea uno SCOB nello stesso movimento di impulso/correzione (sulla stessa linea ICM che effettua la cattura di liquidità). Di solito lo SCOB che si verifica dopo questo evento rappresenta una zona di interesse altamente liquida, che dovrebbe essere considerata quando si sceglie il livello di ingresso.

"ICM+SCOB (stessa candela)" è fondamentalmente lo stesso dell'evento "ICM+SCOB" ma con una differenza importante — la candela che cattura la liquidità della linea ICM è anche la candela in cui si verifica lo SCOB, rendendo tale SCOB una zona di interesse ancora migliore rispetto a uno SCOB regolare dall'evento ICM+SCOB.

MAGGIORI VANTAGGI

ICSM identifica con precisione impulsi e correzioni. Un'enorme quantità di indicatori su TradingView mostra solo le zone di interesse più semplici, mentre ICSM utilizza gli algoritmi esclusivi del nostro team per identificare con precisione veri impulsi e correzioni nel mercato, permettendo ai trader di vedere meglio sia la direzione del prezzo locale che globale e allo stesso tempo fornendo ai trader le zone di interesse più liquide;

ICSM mostra punti di interesse e liquidità. L'indicatore identifica i punti di interesse e le zone più vicine, dove la liquidità è concentrata, permettendoti di trovare ottimi punti di ingresso e uscita per i tuoi trade;

ICSM ha una funzione di rilevamento SCOB (Single Candle Order Block). ICM è dotato della funzione di rilevamento SCOB estremamente utile nel trading SMC, che ti permette di trovare punti di interesse ancora più solidi;

ICSM ha un design super minimalista, che contiene solo le cose di cui hai davvero bisogno. Il tuo grafico non sarà sovraccaricato di informazioni inutili. Vedrai solo chiari punti di interesse, liquidità e movimento dei prezzi.

PERCHÉ DOVRESTI USARLO?

Come detto sopra, ICSM ti permette di vedere i punti e le zone di interesse più redditizi, che i trader SMC professionisti considerano tra i migliori sul mercato, perché storicamente sono le aree da cui il prezzo rimbalza di più, permettendo ai trader più intelligenti di ottenere profitti rapidi e puliti con un basso drawdown.

Nell'indicatore ICSM queste zone sono SCOB e catture di liquidità della linea ICM. Utilizzando queste zone di interesse per trovare punti di ingresso, aumenti la possibilità di aprire un trade al prezzo più redditizio e riduci i rischi di trading.

Considerando quanto detto sopra, questo indicatore può aiutare i trader a ridurre i rischi di drawdown e aumentare i potenziali profitti semplicemente mostrando le zone di interesse più liquide, che sono perfette per aprire una posizione di trading.

AVVISI

ICSM fornisce una personalizzazione degli avvisi semplice e facile, permettendo di scegliere solo gli avvisi che si desidera ricevere. Puoi scegliere tra le seguenti opzioni di avviso:

ICM — cattura di liquidità di impulso o correzione;
SCOB — SCOB si forma, che la liquidità sia catturata o meno dall'impulso o dalla correzione;
SCOB+ICM — SCOB si forma dopo aver catturato la liquidità della linea ICM;

COME POSSO OTTENERE IL MASSIMO DA ESSO?

ICSM visualizza solo la prima liquidità di un impulso o correzione, che corrisponde all'IDM (Inducement) nella strategia SMC avanzata. Questa strategia è completamente coperta nell'indicatore World Class SMC ed è disponibile gratuitamente in PDF in tre parti.

Puoi anche usare ICSM con qualsiasi altra strategia, perché ICSM è un indicatore molto flessibile e aiuterà chiunque a migliorare il proprio trading rendendo consapevoli della liquidità di alta qualità sul grafico.

RIEPILOGO

ICSM è un indicatore unico che identifica zone e punti di interesse con liquidità di alta qualità e può essere sia uno strumento autonomo che può essere integrato in qualsiasi altra strategia per aumentare l'efficienza dell'analisi, l'accuratezza degli ingressi di trading e ridurre i rischi di trading.

Se vuoi imparare le strategie SMC che il nostro team usa nei nostri prodotti, puoi fare riferimento ai nostri materiali educativi.

Speriamo che tu possa trovare un grande uso per ICSM e che ti aiuti a migliorare le tue prestazioni come trader. Buona fortuna, trader!

— con amore, il team WinWorld
Prodotti consigliati
MercariaPattern1-2-3 відстежує рух ціни, знаходить трьоххвильові структури 1-2-3 та підсвічує момент, коли сценарій підтверджується пробоєм ключового рівня. MercariaPattern1-2-3 tracks price movement, detects three-leg 1-2-3 structures and highlights the moment when the scenario is confirmed by a key level breakout. Індикатор збирає локальні свінги в компактну фігуру 0–1–2–3 , чекає підтвердженого пробою та будує стрілку входу з готовими рівнями SL/TP. The indicator combines local swings into a
Noize Absorption Index - is the manual trading system that measures the difference of pressure between bears forces and bulls forces. Green line - is a noize free index that showing curent situation. Zero value of index shows totally choppy/flat market.Values above zero level shows how powerfull bullish wave is and values below zero measures bearish forces.Up arrow appears on bearish market when it's ready to reverse, dn arrow appears on weak bullish market, as a result of reverse expectation.
The RSI Divergence + FVG Signal indicator combines Relative Strength Index (RSI) Divergence with Fair Value Gap (FVG) detection to generate high-probability buy and sell signals based on both momentum shifts and institutional imbalance zones. Core Features: RSI Divergence Detection : Identifies both regular and hidden bullish/bearish divergences between price and RSI. Divergences indicate potential trend reversals or continuation. FVG Zone Recognition : Detects Fair Value Gaps (imbalances caused
# DRAWDOWN INDICATOR V4.0 - The Essential Tool to Master Your Trading ## Transform Your Trading with a Complete Real-Time Performance Overview In the demanding world of Forex and CFD trading, **knowing your real-time performance** isn't a luxury—it's an **absolute necessity**. The **Drawdown Indicator V4.0** is much more than a simple indicator: it's your **professional dashboard** that gives you a clear, precise, and instant view of your trading account status. --- ## Why This Indicator
Owl Smart Levels MT5
Sergey Ermolov
4.03 (32)
Versione MT4  |  FAQ L' indicatore Owl Smart Levels è un sistema di trading completo all'interno dell'unico indicatore che include strumenti di analisi di mercato popolari come i frattali avanzati di Bill Williams , Valable ZigZag che costruisce la corretta struttura a onde del mercato, e i livelli di Fibonacci che segnano i livelli esatti di entrata nel mercato e luoghi per prendere profitti. Descrizione dettagliata della strategia Istruzioni per lavorare con l'indicatore Consulente-assistente
Il livello Premium è un indicatore unico con una precisione superiore all'80% delle previsioni corrette! Questo indicatore è stato testato dai migliori Specialisti di Trading per più di due mesi! L'indicatore dell'autore che non troverai da nessun'altra parte! Dagli screenshot puoi vedere di persona la precisione di questo strumento! 1 è ottimo per il trading di opzioni binarie con un tempo di scadenza di 1 candela. 2 funziona su tutte le coppie di valute, azioni, materie prime, criptovalu
ATrend
Zaha Feiz
4.82 (17)
"ATREND: Come funziona e come utilizzarlo" ### Come funziona L'indicatore "ATREND" per la piattaforma MT5 è progettato per fornire ai trader robusti segnali di acquisto e vendita utilizzando una combinazione di metodologie di analisi tecnica. Questo indicatore sfrutta principalmente l'Average True Range (ATR) per la misurazione della volatilità, insieme ad algoritmi di individuazione dei trend per identificare potenziali movimenti di mercato. Lascia un messaggio dopo l'acquisto e ricevi un rega
Trade smarter, not harder: Empower your trading with Harmonacci Patterns This is arguably the most complete harmonic price formation auto-recognition indicator you can find for the MetaTrader Platform. It detects 19 different patterns, takes fibonacci projections as seriously as you do, displays the Potential Reversal Zone (PRZ) and finds suitable stop-loss and take-profit levels. [ Installation Guide | Update Guide | Troubleshooting | FAQ | All Products ] It detects 19 different harmonic pri
Innanzitutto, vale la pena sottolineare che questo Strumento di Trading è un Indicatore Non-Ridipingente, Non-Ridisegnante e Non-Laggante, il che lo rende ideale per il trading professionale. Corso online, manuale utente e demo. L'Indicatore Smart Price Action Concepts è uno strumento molto potente sia per i nuovi che per i trader esperti. Racchiude più di 20 utili indicatori in uno solo, combinando idee di trading avanzate come l'Analisi del Trader del Circolo Interno e le Strategie di Tradin
Indicatore Crypto_Forex Pattern PINBAR per MT5, senza ridisegnare, senza ritardi. - L'indicatore "PINBAR Pattern" è un indicatore molto potente per il trading basato sull'azione dei prezzi. - L'indicatore rileva le PinBar sul grafico: - PinBar rialzista - Segnale a freccia blu sul grafico (vedi immagini). - PinBar ribassista - Segnale a freccia rossa sul grafico (vedi immagini). - Con avvisi su PC e dispositivi mobili. - L'indicatore "PINBAR Pattern" è eccellente da combinare con i livelli di
Rainbow EA MT5
Jamal El Alama
Description : Rainbow EA MT5 is a simple Expert advisor based on   Rainbow MT5 indicator witch is based on Moving average with period 34. The indicator is incorporated in the EA, therefore, it is not required for the EA to operate, but if you wish, you can download it from   my product page . The Expert Advisor settings are as follows : Suitable for Timeframes up to H1 The parameters below can be set according to your trading rules. StopLoss ( Stop Loss in pips) TakeProfit ( Take Profit in pips
Volume Profile V6
Andrey Kolesnik
4.67 (3)
Indicatore del profilo di volume del mercato + oscillatore intelligente. Funziona su quasi tutti gli strumenti: coppie di valute, azioni, futures, criptovalute, sia su volumi reali che su tick. È possibile impostare la definizione automatica dell'intervallo di costruzione del profilo (ad esempio, per una settimana o un mese, ecc.), oppure impostare l'intervallo manualmente spostando i confini (due linee verticali: rossa e blu). Viene visualizzato sotto forma di istogramma. La larghezza dell'isto
DAILY OH/OL SDEV QUANT MODEL - STATISTICAL TRADING WITH PRECISION RISK MANAGEMENT TRADE WITH MATHEMATICAL CERTAINTY - KNOW YOUR EXACT STOP-LOSS AND TAKE-PROFIT BEFORE YOU ENTER This indicator analyzes 5,000+ days of price history to give you: Exact entry levels (sigma bands locked at daily open) Exact stop-loss distance (from M
Trend Monitor MT5
Pavel Zamoshnikov
4.5 (2)
The indicator generates early signals basing on ADX reading data combined with elements of price patterns. Works on all symbols and timeframes. The indicator does not redraw its signals. You see the same things on history and in real time. For better visual perception signals are displayed as arrows (in order not to overload the chart). Features The best results are obtained when the indicator works on two timeframes. For example: M30 – the indicator shows the main trend; M5 – the indicator gen
Universal Soul Reaper
Pieter Gerhardus Van Zyl
Universal Soul Reaper is an atmospheric market-flow oscillator designed to interpret price behavior as a cycle of spiritual energy. Instead of reacting to raw price alone, it visualizes the state of the market’s soul —revealing when momentum is awakening, stabilizing, or fading. The indicator operates in a separate window and presents three interwoven entities: the Ectoplasmic Veil , the Spirit Boundary , and the Soul Core . Together, they form a living framework that helps traders sense pressu
All-in-One Chart Patterns Professional Level: The Ultimate 36-Pattern Trading System All-in-One Chart Patterns Professional Level is a comprehensive 36-pattern indicator well known by retail traders, but significantly enhanced with superior accuracy through integrated news impact analysis and proper market profile positioning. This professional-grade trading tool transforms traditional pattern recognition by combining advanced algorithmic detection with real-time market intelligence.  CORE FEATU
STRICTLY FOR BOOM INDEX ONLY!!!!! Here I bring the Maximum Trend Arrows OT1.0 MT5 indicator. This indicator is made up of a combination of different trend indicators for entries and exits, for entries an orange arrow will paint on the chart below the current market and a red flag for closing of trades and it produces buy arrows only. When the orange arrow appears, it will appear along with it's sound to notify you. The 1H timeframe is recommended, don't use it anywhere else than on the 1H timefr
Cumulative delta indicator As most traders believe, the price moves under the pressure of market buying or selling. When someone redeems an offer standing in the cup, the deal is a "buy". If someone pours into the bid standing in the cup - the deal goes with the direction of "sale". The delta is the difference between purchases and sales. A cumulative delta - the difference between the cumulative sum of purchases and sales for a certain period of time. It allows you to see who is currently contr
Gioteen Volatility Index (GVI) - your ultimate solution to overcoming market unpredictability and maximizing trading opportunities. This revolutionary indicator helps you in lowering your losing trades due to choppy market movements. The GVI is designed to measure market volatility, providing you with valuable insights to identify the most favorable trading prospects. Its intuitive interface consists of a dynamic red line representing the volatility index, accompanied by blue line that indicate
Was: $249  Now: $99   Market Profile defines a number of day types that can help the trader to determine market behaviour. A key feature is the Value Area, representing the range of price action where 70% of trading took place. Understanding the Value Area can give traders valuable insight into market direction and establish the higher odds trade. It is an excellent addition to any system you may be using. Inspired by Jim Dalton’s book “Mind Over Markets”, this indicator is designed to suit the
This indicator is used to compare the relative strength of the trade on the chart against the other several selected symbols. By comparing the price movement of each traded variety based on the same base day, several trend lines of different directions can be seen, reflecting the strong and weak relationship between the several different traded varieties, so that we can have a clearer understanding of the market trend. For example, you can apply this indicator on a EurUSD chart and compare it w
TRI Visualizer
Yoshimi Mon 三 Ura
TRI Visualizer MT5 – Thermodynamic Market Analysis Overview The TRI (Thermal Range Indicator) Visualizer Enhanced is a rare market analysis indicator that goes beyond conventional technical analysis, applying principles of thermodynamics from physics. It interprets market price fluctuations as “thermodynamic energy,” enabling the highly accurate detection of subtle market changes that are often overlooked. Innovative Mechanisms 1. Dual Calculation Engines Classic TRI Mode Formula: |Close
L'indicateur SMC Venom Model BPR est un outil professionnel pour les traders travaillant dans le concept Smart Money (SMC). Il identifie automatiquement deux modèles clés sur le graphique des prix: FVG   (Fair Value Gap) est une combinaison de trois bougies, dans laquelle il y a un écart entre la première et la troisième bougie. Forme une zone entre les niveaux où il n'y a pas de support de volume, ce qui conduit souvent à une correction des prix. BPR   (Balanced Price Range) est une combinaiso
Pro Gold System Indicator
PEDRO JOAQUIM GONCALVES GOMES
ADVANCED FUNCTIONALITIES: Trend Score (0-100) with visual bar Intelligent signals with adjustable strength (1-10) Risk management with automatic TP/SL Audible and visual alerts Price zones with smooth filling Multi-indicator analysis (RSI, ATR, BB, EMAs) DESIGN FEATURES Modern Visual: Smooth and well-spaced lines (EMA with 2-3px width) Vibrant and professional colors (Sky Blue, Orange, Gold) Modern arrows (code 233/234) for buy/sell signals Configurable dark/light theme Adjustable transparency f
This trading indicator is non-repainting, non-redrawing, and non-lagging, making it an ideal choice for both manual and automated trading. It is a Price Action–based system that leverages price strength and momentum to give traders a real edge in the market. With advanced filtering techniques to eliminate noise and false signals, it enhances trading accuracy and potential. By combining multiple layers of sophisticated algorithms, the indicator scans the chart in real-time and translates comple
The Trend Duration Forecast MT5 indicator is designed to estimate the probable lifespan of a bullish or bearish trend. Using a Hull Moving Average (HMA) to detect directional shifts, it tracks the duration of each historical trend and calculates an average to forecast how long the current trend is statistically likely to continue. This allows traders to visualize both real-time trend strength and potential exhaustion zones with exceptional clarity. KEY FEATURES Dynamic Trend Detection:   Utiliz
Overview Harmonic Patterns MT5 is a technical analysis indicator designed for the MetaTrader 5 platform. It identifies and displays harmonic price patterns, such as Butterfly, Cypher, Crab, Bat, Shark, and Gartley, in both bullish and bearish directions. The indicator calculates key price levels, including entry, stop loss, and three take-profit levels, to assist traders in analyzing market movements. Visual elements and customizable alerts enhance usability on the chart. Features Detects six ha
Terra Infinity is a flat indicator. This improved version of the CalcFlat indicator has three additional lines that significantly increase its effectiveness. Unlike its predecessor with two static levels, Terra Infinity adds three dynamic lines above the main histogram, which are interpreted as follows: base signal line, minimum signal line, maximum signal line. These lines are formed using the additional parameter Avg, which is the average value of the histogram. Averaging produces a line cl
##   ONLY GOLD ##   Тiльки Золото ## **Mercaria Professional Trading Zones - Complete Guide** ## **Mercaria Professional Trading Zones - Повний посібник** ### **How Mercaria Zones Work / Як працюють зони Mercaria** **English:** Mercaria Zones is an advanced trading indicator that identifies high-probability support and resistance areas using ZigZag extremes combined with mathematical zone calculations. The indicator works on multiple timeframes simultaneously, providing a comprehensive view
PipFinite Exit EDGE MT5
Karlo Wilson Vendiola
4.87 (31)
Did You Have A Profitable Trade But Suddenly Reversed? In a solid strategy, exiting a trade is equally important as entering. Exit EDGE helps maximize your current trade profit and avoid turning winning trades to losers. Never Miss An Exit Signal Again Monitor all pairs and timeframes in just 1 chart www.mql5.com/en/blogs/post/726558 How To Trade You can close your open trades as soon as you receive a signal Close your Buy orders if you receive an Exit Buy Signal. Close your Sell orders if
Gli utenti di questo prodotto hanno anche acquistato
Azimuth Pro
Ottaviano De Cicco
5 (1)
LAUNCH PROMO Azimuth Pro price is initially set at 299$ for the first 100 buyers. Final price will be 499$ . THE DIFFERENCE BETWEEN RETAIL AND INSTITUTIONAL ENTRIES ISN'T THE INDICATOR — IT'S THE LOCATION. Most traders enter at arbitrary price levels, chasing momentum or reacting to lagging signals. Institutions wait for price to reach structured levels where supply and demand actually shift. Azimuth Pro maps these levels automatically: swing-anchored VWAP, multi-timeframe structure lines, an
Ottieni l’indicatore AUX GRATUITO e il supporto EA Download diretto — Clicca qui [ D.I.C.E ] The DICE Indicator  Divergence in Chaos Environment è uno strumento MT5 specializzato per trader che applicano la Teoria delle Onde di Elliott nel contesto delle tecniche di Trading Chaos. Identifica divergenze nascoste e regolari nell’azione dei prezzi, sincronizzate con l’ambiente di mercato caotico descritto da Bill Williams. Caratteristiche principali Divergenza allineata alle Onde di Elliott: rilev
ARIPoint
Temirlan Kdyrkhan
1 (1)
ARIPoint is a powerful trading companion designed to generate high-probability entry signals with dynamic TP/SL/DP levels based on volatility. Built-in performance tracking shows win/loss stats, PP1/PP2 hits, and success rates all updated live. Key Features: Buy/Sell signals with adaptive volatility bands Real-time TP/SL/DP levels based on ATR Built-in MA Filter with optional ATR/StdDev volatility Performance stats panel (Success, Profit/Loss, PP1/PP2) Alerts via popup, sound, push, or email Cu
MetaForecast M5
Vahidreza Heidar Gholami
5 (3)
MetaForecast predice e visualizza il futuro di qualsiasi mercato basandosi sull'armonia dei dati dei prezzi. Sebbene il mercato non sia sempre prevedibile, se esiste un modello nei prezzi, MetaForecast può prevedere il futuro con la massima precisione possibile. Rispetto ad altri prodotti simili, MetaForecast può generare risultati più accurati analizzando le tendenze di mercato. Parametri di input Past size (Dimensione passata) Specifica il numero di barre che MetaForecast utilizza per creare
Ottieni l’indicatore AUX GRATUITO, il supporto EA e la guida completa, visita per favore – https://www.mql5.com/en/blogs/post/763955 Individua la tendenza. Leggi il pattern. Cronometra l'ingresso. 3 passaggi in meno di 30 secondi! Opera senza sforzo — nessuna analisi richiesta, il tuo assistente intelligente è pronto a semplificare il tuo flusso di lavoro Basta sovraccarico di grafici. Opera con fiducia utilizzando il rilevamento intelligente del bias. Compatibile con tutte le valute, criptova
Weis Wave with Alert MT5
Trade The Volume Waves Single Member P.C.
4.94 (17)
Rental/Lifetime Package Options and Privileges  Rent Monthly Six Months   Yearly/Lifetime Weis Wave with Speed with Alert+Speed Index x x x Manual  x x x Quick Set up Video x x x Blog x x x Lifetime Updates x x x Setup and Training Material x x Discord Access Channel "The SI traders"          x Rectangle Break Alert Tool      x How to trade with it:    http://www.tradethevolumewaves.com   ** If you purchase please contact me to setup your  : Training Room and  complete manual access.  Wei
Rtc ML Ai Predictor
Muhammad Faisal Sagala
Rtc ML Ai | Predictor CORE MACHINE LEARNING ENGINE Adaptive ML Market Predictor – Multi-Bar Trend & Candle Forecast What This Indicator Does This indicator is a  real-time market prediction engine  designed to analyze price behavior and estimate  future market tendencies . Unlike conventional indicators, this system  does not rely on static parameters or historical curve-fitting , but adapts its internal state dynamically during live market operation. Instead of using static rules, the indic
SHOGUN TRADE PRO [MT5] - Professional Market Structure & Dow Theory Suite Limited Release: Early Access Pricing This professional suite is currently available at an introductory price to celebrate its launch on the MT5 platform. Please note that the price will be adjusted incrementally as updates are released and the user base grows. Secure your "Commander’s Seat" at the most favorable rate today. The Developer’s Journey: From Noise to Clarity I will be honest: I was once a "knowledge colle
L’indicatore analizza il volume da qualsiasi punto e calcola i livelli di esaurimento del mercato per quel volume. Linee principali di Meravith: Linea di esaurimento del volume rialzista – funge da obiettivo. Linea di esaurimento del volume ribassista – funge da obiettivo. Linea di tendenza – indica la tendenza del mercato. Cambia colore a seconda che il mercato sia rialzista o ribassista e funge da supporto di tendenza. Come utilizzarlo: fai doppio clic sulla linea verticale viola e spostala ne
Elliott Wave Trend was designed for the scientific wave counting. This tool focuses to get rid of the vagueness of the classic Elliott Wave Counting using the guideline from the template and pattern approach. In doing so, firstly Elliott Wave Trend offers the template for your wave counting. Secondly, it offers Wave Structural Score to assist to identify accurate wave formation. It offers both impulse wave Structural Score and corrective wave Structure Score. Structural Score is the rating to sh
L'indicatore " Dynamic Scalper System MT5 " è progettato per il metodo di scalping, ovvero per il trading all'interno di onde di trend. Testato sulle principali coppie di valute e sull'oro, è compatibile con altri strumenti di trading. Fornisce segnali per l'apertura di posizioni a breve termine lungo il trend, con ulteriore supporto al movimento dei prezzi. Il principio dell'indicatore. Le frecce grandi determinano la direzione del trend. Un algoritmo per generare segnali per lo scalping sott
Presentazione dell'Indicatore Astronomico per   MT4 / MT5 : Il tuo compagno di trading celeste definitivo Sei pronto a elevare la tua esperienza di trading a livelli celesti? Non cercare oltre, il nostro rivoluzionario Indicatore Astronomico per MT4 è qui. Questo strumento innovativo va oltre gli indicatori di trading tradizionali, sfruttando algoritmi complessi per offrirti intuizioni astronomiche senza pari e calcoli di precisione. Un universo di informazioni a portata di mano:   Ammira un pan
SynaptixQuant Dominance Matrix
Devie Arevalo Montemayor
5 (1)
SynaptixQuant Dominance Matrix: Institutional-Grade Market State Extraction Engineered for traders who require a data-driven view of market behaviour beyond surface-level indicators. The Synaptix Quant (SQ) Dominance Matrix is not a conventional currency strength display. Behind its intentionally streamlined interface runs a sophisticated analytical architecture designed to quantify market conditions with precision. Every output is generated through layered signal processing built to identify d
RelicusRoad Pro: Sistema Operativo Quantitativo di Mercato 70% DI SCONTO ACCESSO A VITA (TEMPO LIMITATO) - UNISCITI A 2.000+ TRADER Perché la maggior parte dei trader fallisce anche con indicatori "perfetti"? Perché operano su Singoli Concetti isolati. Un segnale senza contesto è una scommessa. Per vincere serve CONFLUENZA . RelicusRoad Pro non è un semplice indicatore. È un Ecosistema Quantitativo completo . Mappa la "Fair Value Road", distinguendo tra rumore e rotture strutturali. Smetti di in
Max Ribbon Mt5
Stefano Frisetti
ATTENZIONE: Questo indicatore è distribuito ESCLUSIVAMENTE su MQL5.com Versione MT4:   https://www.mql5.com/it/market/product/160363 Versione MT5:   https://www.mql5.com/it/market/product/160410 ================================================================================ MAX RIBBON ver 1.00 L'indicatore che ti mostra il TREND in modo chiaro e inequivocabile! ================================================================================ DESCRIZIONE MAX RIBBON è un indicatore di trend
TrendMaestro5
Stefano Frisetti
Attenzione alle truffe, questo indicatore e' distribuito esclusivamente su MQL5.com nota: questo indicatore e' per METATRADER5, se vuoi la versione per  METATRADER4 questo e' il link:   https://www.mql5.com/it/market/product/108106 TRENDMAESTRO ver 2.5 TRENDMAESTRO   riconosce un nuovo TREND sul nascere, non sbaglia mai. La sicurezza di identificare un nuovo TREND non ha prezzo. DESCRIZIONE TRENDMAESTRO identifica un nuovo TREND sul nascere, questo indicatore prende in esame la volatilita' i
Pantera Indicator
Temirlan Kdyrkhan
5 (1)
A tool for on-chart strategy backtesting and performance analysis. A utility for developing, debugging, and testing custom trading ideas and indicator functions. An indicator designed to quickly test trading concepts and visualize the effectiveness of different input parameters. An all-in-one sandbox for testing everything from simple crossovers to complex, multi-condition trading systems.
Step into the world of Forex trading with confidence, clarity, and precision using Gold Indicator a next-generation tool engineered to take your trading performance to the next level. Whether you’re a seasoned professional or just beginning your journey in the currency markets, Gold Indicator equips you with powerful insights and help you trade smarter, not harder. Built on the proven synergy of three advanced indicators, Gold Indicator focuses exclusively on medium and long-term trends elimina
+++++++++++++++++++++++++++++++++++++++++++++++++++++++++++++++++++++++++++++++++++++++++++++++++ +++ Link to EURUSD Only Free Version -->  https://www.mql5.com/en/market/product/156904?source=Unknown +++++++++++++++++++++++++++++++++++++++++++++++++++++++++++++++++++++++++++++++++++++++++++++++++ Hallo Trader, This is a traditional GANN & FIBONACCI strategy based on detection of an impulsive move in the opposite direction. This is called a Breakout. At the moment of Breakout, the indicator draw
Orderflow Scalp Pro v2.4   delivers institutional-grade trading intelligence through advanced volume analysis, dynamic VWAP calculations, real-time aggressive score monitoring, and precision arrow signals. This complete trading system transforms complex market data into clear, actionable signals for consistent profitability on 3-4 minute timeframes. Full Documentation: [Download PDF] Four Powerful Components in One System Volume Profile HeatMap with POC/VAH/VAL Transform your charts into inst
MATADOR GOLD – XAUUSD MT5 M5 Timeframe Scalp Signals MATADOR GOLD is a professional signal indicator designed for XAUUSD (Gold) scalping on the M5 timeframe , with optional higher-timeframe confirmation. This indicator does not open or manage trades automatically . It provides structured buy and sell signals, intelligent filtering, and alerts, allowing traders to execute trades using their own strategy and risk management rules. Core Concept (Multi-Concept Architecture) MATADOR GOLD is built
Hyperbolic
Konstantin Gruzdev
The indicator is stable on noise fluctuations in price and quickly reacts to the trend. It is based on an algorithm from a system of hyperbolic functions that allows you to aggressively smooth the flat with minimal lag on the trend. It can be applied directly to the price chart, to itself, or to other indicators in order to eliminate false signals. The main purpose of the indicator is to smooth out small sawtooth price movements as much as possible. The higher the Hyperbolic parameter, the stron
This indicator belongs to the family of channel indicators. These channel indicator was created based on the principle that the market will always trade in a swinging like pattern. The swinging like pattern is caused by the existence of both the bulls and bears in a market. This causes a market to trade in a dynamic channel. it is designed to help the buyer to identify the levels at which the bulls are buying and the bear are selling. The bulls are buying when the Market is cheap and the bears a
FXLAND Smart Reversal Indicator (MT5) FXLAND Smart Reversal Indicator is a professional technical analysis tool designed to help traders identify potential price reversal zones and key market turning points with clarity and precision. The best reversal indicator and price return by choosing only one ceiling or floor in each time frame A masterpiece of combining mathematics and Gann, fractal matrix, Fibonacci, movement angle and time. Completely intelligent Key Features Detects potenti
This indicator uses support and resistance, volume and some special formula to calculate the volume to filter the candles. If the volume reaches a specific value, And at the same time, Candle breaks the support/resistance line, There would be a signal and we can enter the market. Signals appear when the current candle closes. then you can enter the trade when a new candle appears. Please don't forget to follow your money management plan. MT4 Version Support/Resistance Breakout MT4 :   https:/
First time on MetaTrader, introducing IQ Star Lines - an original Vedic Astrology based indicator. "Millionaires don't use astrology, billionaires do" . - J.P. Morgan, Legendary American financier and banker. IQ Star Lines, an unique astrological indicator purely based on   Vedic astrology   calculations, published for the   first time on Metatrader.  This unique tool plots dynamic planetary grid lines based on real-time stars, constellations, and celestial movements, which allows you to plot t
Prices move for many reasons and these can vary from one operator to another: software, private and institutional traders simultaneously contribute to the formation of the price, making predictive art very difficult. However, there are measurable factors that bind the price to an underlying trend in line with the physical reality that the financial asset represents: these are the macroeconomic indicators. Large investors use this information wisely to set their strategies. Understanding these m
Matreshka
Dimitr Trifonov
5 (2)
Matreshka self-testing and self-optimizing indicator: 1. Is an interpretation of the Elliott Wave Analysis Theory. 2. Based on the principle of the indicator type ZigZag, and the waves are based on the principle of interpretation of the theory of DeMark. 3. Filters waves in length and height. 4. Draws up to six levels of ZigZag at the same time, tracking waves of different orders. 5. Marks Pulsed and Recoil Waves. 6. Draws arrows to open positions 7. Draws three channels. 8. Notes support and re
The iChannels
BeeXXI Corporation
5 (2)
Ultra-fast recognition of parabolic channels (as well as linear, horizontal and wavy channels) throughout the depth of history, creating a hierarchy of channels. Required setting: Max bars in chart: Unlimited This indicator is designed primarily for algorithmic trading, but can also be used for manual trading.  This indicator will have a very active evolution in the near future and detailed descriptions on how to apply to create robots
TREND HARMONY MT5 – Multi Timeframe Trend and Phase and Pullback Level Visualizer indicator for Metatrader5 The TREND HARMONY indicator automates deep trend analysis and generates visualizations for you. Take control of your trades by eliminating uncertainty! Revolutionize your trading experience with precision and insight through the TREND HARMONY Multi Timeframe indicator – your ultimate MT5 trend visualization indicator. [  Features and Manual   | MT4 version |   All Products   ] Are you tir
Filtro:
sidnei carlos dias
285
sidnei carlos dias 2025.12.01 22:00 
 

L'utente non ha lasciato alcun commento sulla valutazione.

Rispondi alla recensione