EdgeMeter
- Utilità
- Versione: 1.3

Measure Your Performance. Challenge Your Results. Discover What the Data Really Says.
Edge Meter is a professional trading performance analysis utility for MetaTrader 5, designed to help traders evaluate whether their historical trading results are meaningfully different from those of comparable random market entries.
A profitable backtest does not necessarily mean a strategy has a measurable advantage.
A rising market can reward almost any long-only strategy, while a favorable market period can make ordinary trading results appear exceptional.
Edge Meter helps put those results into perspective.
By combining detailed trading statistics with a matched random-entry comparison, Edge Meter provides an evidence-based evaluation of your historical trading performance.
No trading signals. No predictions. No live trade execution. Just measurable historical evidence.
KEY FEATURES
1. Professional Trading Performance Analysis
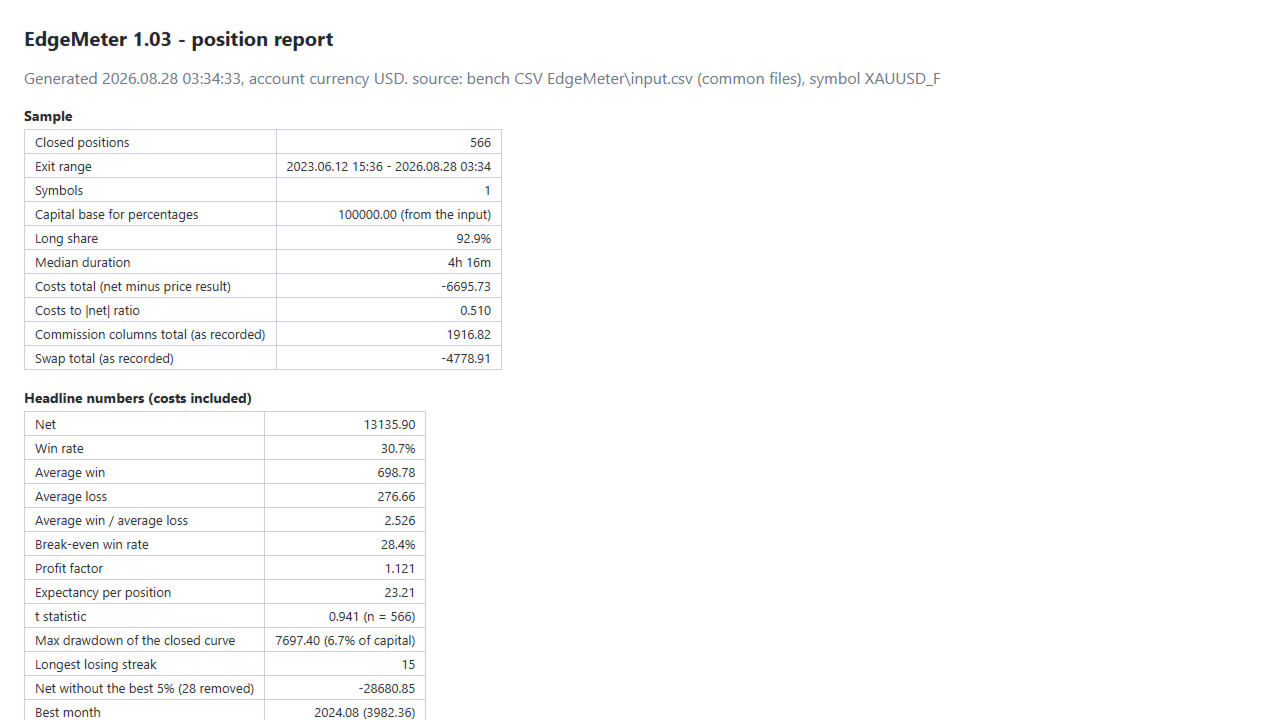
Edge Meter analyzes your closed trading positions and generates a comprehensive statistical evaluation.
Import your trading history directly from your MetaTrader 5 account or analyze an external CSV file.
Available performance metrics include:
-
Total net trading result.
-
Win rate.
-
Average winning trade.
-
Average losing trade.
-
Payoff ratio.
-
Profit factor.
-
Trade expectancy.
-
Statistical t-value.
-
Maximum closed-equity drawdown.
-
Longest consecutive losing streak.
-
Performance excluding the best trades.
-
Best performing month.
-
Trading cost analysis.
-
Historical performance consistency.
Drawdown is calculated in monetary terms and can also be expressed as a percentage when starting capital is available.
This provides a structured overview of trading results beyond basic profitability.
2. Matched Random-Entry Comparison
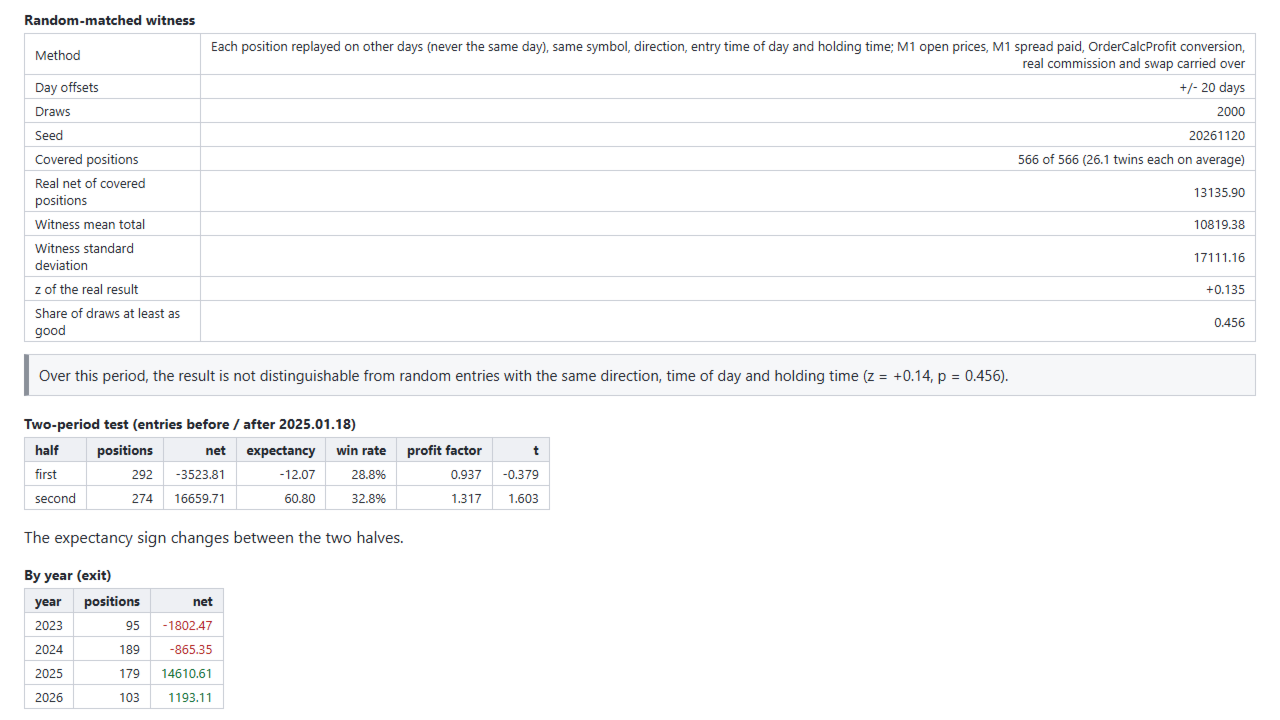
The central feature of Edge Meter is its matched random-entry benchmark.
Instead of evaluating trading performance in isolation, Edge Meter compares historical trades with simulated random entries under comparable conditions.
The benchmark preserves important characteristics of the original positions:
-
Same trading instrument.
-
Same trade direction.
-
Same entry time of day.
-
Same holding duration.
-
Historical one-minute market prices.
-
Historical spread information.
-
Recorded trading costs.
Alternative entries are selected from other trading days within a configurable historical window.
The original entry day is excluded.
Thousands of randomized comparisons are generated to construct a reference distribution.
Your actual trading results are then evaluated against that distribution.
The objective is simple: determine whether your measured historical results stand apart from comparable random entries.
This comparison helps distinguish favorable market conditions from performance potentially associated with trade selection.
It does not prove that a strategy possesses a persistent trading advantage.
3. Clear Statistical Verdicts
Edge Meter translates its statistical comparison into an understandable conclusion.
Depending on the measured results, the system can report:
BETTER THAN RANDOM
The measured trading results exceed the matched random benchmark according to the tool's evaluation.
NOT DISTINGUISHABLE FROM RANDOM
The observed results do not demonstrate a sufficiently clear difference from comparable random entries.
WORSE THAN RANDOM
The measured results fall below the matched random benchmark according to the tool's evaluation.
Each verdict is supported by quantitative measurements, including:
-
Random benchmark average.
-
Random benchmark standard deviation.
-
Z-score.
-
Share of randomized outcomes achieving at least the observed result.
-
Historical data coverage.
-
Number of evaluated positions.
Important: These verdicts describe the measured historical sample only. They do not predict future profitability or guarantee the existence of a sustainable trading edge.
4. Detailed Historical Performance Breakdown
Understand how your trading results developed across different periods.
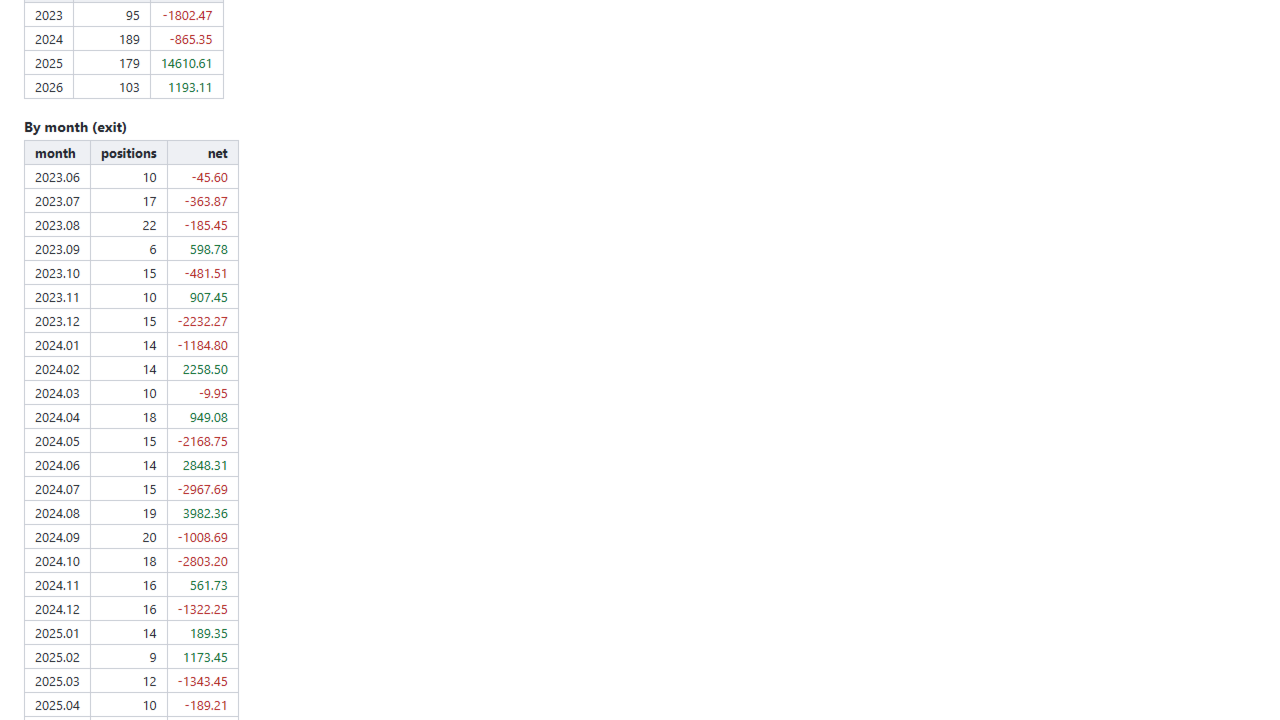
Edge Meter organizes performance statistics by:
-
Year.
-
Month.
-
Weekday.
-
Entry hour.
-
Before-and-after sample periods.
This makes it possible to examine whether results were concentrated in particular market periods.
Additional consistency checks include:
-
Performance of the first and second portions of the sample.
-
Contribution of the strongest trading month.
-
Effect of removing the best-performing trades.
-
Impact of commissions, swaps and other recorded costs.
-
Maximum drawdown of the closed-position results.
-
Consecutive trading losses.
These measurements can help reveal whether a historical result depends heavily on a small number of exceptional trades.
5. R-Multiple Analysis
When sufficient initial-risk information is available, Edge Meter can evaluate trade outcomes in R-multiples.
An R-multiple expresses a position's realized result relative to its initial planned risk.
For example:
-
+2R means a gain equivalent to twice the initial risk.
-
+1R means a gain equivalent to the initial risk.
-
−1R means a loss equivalent to the initial risk.
R-based analysis requires initial stop-loss information from the source data.
If the required information is unavailable, Edge Meter does not invent missing risk values.
6. Import Trading History or CSV Files
Edge Meter supports two primary analysis sources.
MetaTrader 5 Account History
Read closed positions directly from account history using configurable filters.
Custom CSV Files
Analyze external trading records through a flexible CSV import system.
Available options include:
-
Custom column layouts.
-
Predefined column configurations.
-
Custom field separators.
-
Optional CSV headers.
-
Multiple date formats.
-
Configurable BUY/SELL terminology.
-
Symbol mapping.
-
Date-range filtering.
-
Magic-number filtering.
-
Comment filtering.
This makes Edge Meter suitable for evaluating manual trading records, Expert Advisor activity and exported trading datasets.
7. Professional HTML Reports
Edge Meter generates a detailed HTML report that can be opened in a web browser.
The report includes:
-
Trading sample information.
-
Headline performance statistics.
-
Historical performance breakdowns.
-
Drawdown analysis.
-
Trading cost measurements.
-
Matched random benchmark statistics.
-
Statistical comparison results.
-
Data coverage information.
-
Final evaluation verdict.
A machine-readable CSV file containing the measurements is also generated.
This allows results to be reviewed independently or incorporated into other analytical workflows.
8. Integrated Information Panel
An on-chart information panel displays important measurement results directly inside MetaTrader 5.
The panel summarizes:
-
Number of evaluated positions.
-
Trading performance statistics.
-
Random benchmark results.
-
Historical data coverage.
-
Final statistical verdict.
The interface is designed to make essential information accessible without requiring users to inspect every exported report.
Edge Meter is a sample-analysis utility, not a continuous real-time performance monitoring dashboard.
9. Reproducible Statistical Results
Edge Meter includes a configurable random seed.
Using identical:
-
Trading records.
-
Historical one-minute data.
-
Measurement settings.
-
Random seed.
produces the same randomized benchmark results.
Default random comparison: 2,000 draws.
This supports repeatable historical evaluations and allows traders to compare measurements without unrelated random variation between runs.
10. Built-In Strategy Tester Demonstration
Edge Meter includes a dedicated demonstration mode available exclusively inside the MetaTrader 5 Strategy Tester.
This mode opens small demonstration positions at predefined times, using configurable stop-loss and take-profit distances.
The demonstration uses fixed trading hours without a selective entry strategy.
Its purpose is to exercise the measurement system and provide a control sample.
The expected result is that the demonstration entries are not distinguishable from comparable random entries.
On live accounts, Edge Meter never sends trading orders or manages positions.
TECHNICAL SPECIFICATIONS
| Feature | Specification |
|---|---|
| Platform | MetaTrader 5 |
| Category | Utilities |
| Program Type | Expert Advisor |
| Version | 1.03 |
| Primary Function | Historical Performance Analysis |
| Account History Analysis | Supported |
| CSV Import | Supported |
| Matched Random Benchmark | Included |
| Default Random Draws | 2,000 |
| Default Historical Offset | 20 Days |
| Minimum Sample | 10 Positions |
| Statistical Z-Score | Included |
| Benchmark Comparison | Included |
| R-Multiple Analysis | When Data Available |
| Maximum Drawdown | Included |
| Performance Breakdown | Year, Month, Day, Hour |
| Consistency Evaluation | Included |
| HTML Reports | Included |
| CSV Reports | Included |
| On-Chart Panel | Included |
| Reproducible Random Seed | Supported |
| Strategy Tester Demo | Included |
| Live Trading Execution | None |
DEFAULT CONFIGURATION
Edge Meter includes a tested default configuration.
Position Source
-
MetaTrader 5 account history.
-
Optional external CSV.
-
Customizable historical period.
-
Symbol, magic-number and comment filters.
Statistical Measurement
-
Minimum positions for a verdict: 10.
-
Sample consistency split: Midpoint.
-
Best trades removed: 5%.
-
Starting capital: Automatic when available.
Matched Random Benchmark
-
Random comparison: Enabled.
-
Historical offset: 20 days.
-
Random draws: 2,000.
-
Random seed: Fixed and configurable.
Strategy Tester Demonstration
-
Demonstration mode: Enabled in tester only.
-
Entry times: 09:00 and 15:00.
-
ATR period: 14.
-
Stop-loss: 1.5 × ATR.
-
Take-profit: 2.0 × ATR.
-
Alternating BUY/SELL positions: Enabled.
Interface
-
Information panel: Enabled.
-
Panel positioning: Configurable.
-
HTML and CSV reports: Generated automatically.
No external preset file is required.
WHO IS EDGE METER FOR?
Expert Advisor Developers
Evaluate whether the historical results of an automated strategy stand apart from comparable randomized entries.
EA Buyers
Examine trading results before deciding how much confidence to place in a system's historical performance.
Manual Traders
Analyze completed trades and investigate whether historical outcomes differ from comparable market exposure.
Trading Researchers
Use reproducible statistical measurements to investigate strategy behavior, trading costs and historical consistency.
Signal Followers
Evaluate historical signal results using matched random comparisons rather than relying exclusively on win rates or total profit.
Edge Meter is not intended to generate trading signals, make investment recommendations or automatically execute trading strategies.
INSTALLATION & GETTING STARTED
Step 1 — Install
Install Edge Meter on MetaTrader 5 and attach it to a chart of the instrument being evaluated.
Step 2 — Select Your Data Source
Choose account history or an external CSV file.
Step 3 — Configure the Sample
Select the desired historical period and apply optional symbol, magic-number or comment filters.
Step 4 — Prepare Market Data
Ensure that sufficient one-minute historical data is available for the matched random comparison.
Step 5 — Run the Analysis
Edge Meter processes the selected closed positions, calculates performance statistics and generates the randomized reference distribution.
Step 6 — Review the Verdict
Examine the on-chart panel and open the generated HTML report for additional statistical details.
Step 7 — Verify Your Findings
Repeat the analysis with the same data and random seed to reproduce the reported measurements.
For CSV inputs, enter the starting capital when percentage-based drawdown calculations are required.
TESTING & VALIDATION
Edge Meter was evaluated using a reference dataset containing 566 closed trading positions.
Reported validation procedures included:
-
Independent calculation of key performance statistics.
-
Comparison of historical drawdown measurements.
-
Verification of the random benchmark average.
-
Verification of benchmark standard deviation.
-
Z-score comparison.
-
Final verdict verification.
-
Reproducibility checks using a fixed random seed.
-
A fixed-hour demonstration control.
The reported measurements matched the independent reference calculations.
The fixed-hour control produced the expected result: not distinguishable from random entries.
These checks evaluate the measurement system's behavior. They do not establish the profitability of any trading strategy.
IMPORTANT LIMITATIONS
Historical Measurements Only
Edge Meter analyzes completed historical trading samples.
Its verdicts do not forecast future returns or guarantee that observed performance will continue.
One-Minute Data Requirement
The matched random benchmark requires sufficient M1 historical market data.
Positions without adequate comparable historical coverage cannot be included in that benchmark.
The report identifies missing coverage rather than generating unsupported estimates.
Statistical Interpretation
A result classified as better than random is not proof that a strategy has a persistent or exploitable edge.
The comparison is limited to the selected benchmark design, available data and measured period.
Trading Costs
The tool uses recorded trading costs where available.
Differences in source accounting, commission structures or swap recording may influence the calculated results.
Sample Size
A minimum of 10 closed positions is required for a verdict under the default settings.
Larger samples generally provide more information, but sample size alone does not eliminate statistical uncertainty.
No Live Trading
Edge Meter does not open or manage trades on live accounts.
Demonstration trading takes place only inside the Strategy Tester.
Financial Risk
Past trading results, even when statistically distinguishable from a randomized benchmark, do not guarantee future profitability.
FREQUENTLY ASKED QUESTIONS
Does Edge Meter trade automatically?
No. It is a historical measurement utility. Automated demonstration entries are limited to the Strategy Tester.
What makes Edge Meter different from a standard trading journal?
In addition to conventional trading statistics, Edge Meter compares historical outcomes against randomized entries with matched trading characteristics.
Can it analyze another Expert Advisor's trades?
Yes. You can isolate historical positions using the relevant magic number and other filters.
Can I import my own CSV trading history?
Yes. Configurable column layouts, separators, date formats and trade-direction labels are supported.
Does a better-than-random verdict guarantee a profitable strategy?
No. It describes a historical statistical comparison, not a prediction or guarantee of future results.
Why does the tool need M1 historical data?
The random benchmark uses historical one-minute prices and spreads to evaluate alternative entry dates with comparable trading characteristics.
What happens if historical data is missing?
The report displays the available coverage. If the required comparison cannot be constructed, no unsupported verdict is generated.
Can I reproduce the same results?
Yes. Identical position data, one-minute history, settings and random seed produce identical results.
Does it calculate maximum drawdown?
Yes. Closed-position drawdown is measured in money and also as a percentage when starting capital is available.
What does the Z-score represent?
It measures the observed result's distance from the random benchmark average in units of the benchmark's standard deviation.
Can I use it with a demo account?
Yes. A demo account with sufficient closed trading history can be used to evaluate the measurement and reporting features.
Does it work with any trading instrument?
It can analyze supported trading records across instruments for which the necessary historical data is available.
Measure Results Before Trusting Them
A profitable trading history is only the beginning of a meaningful evaluation.
Edge Meter combines detailed performance analytics, historical consistency measurements, and randomized benchmark comparisons to provide additional context for completed trading results.
Designed for traders who want to examine evidence rather than rely on attractive backtest numbers alone.
Edge Meter — Measure the Results. Compare Against Random. Understand the Evidence.
Statistical measurements describe historical observations only. They do not constitute trading advice or guarantees of future performance.