Quantum Imbalance Profiles MT4

  • Indicatori
  • Stanislav Konin
    Stanislav Konin
    4.9 (42)
    📊 Order Flow · Volume · Footprint for MetaTrader
    I'm Stanislav Konin, a trader and developer. I started with Forex in 2017; today I trade CME futures and the stock market myself.
    I develop and test trading strategies and Expert Advisors, and my indicators grow out of that work.
  • Versione: 1.0
  • Attivazioni: 7

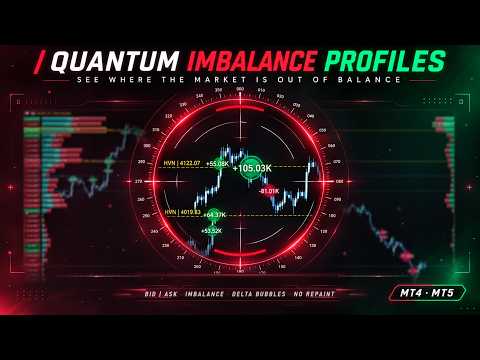
Quantum Imbalance Profiles è un indicatore delle fasi di equilibrio e squilibrio. Mostra a quali prezzi il mercato ha scambiato volume, quale parte ha dominato all'interno di quella zona e attraverso quali livelli il prezzo si è poi espanso con un impulso.

Un profilo di volume classico risponde a una sola domanda: dove sono avvenuti gli scambi. Non mostra quale parte ha dominato a ogni prezzo, come si è conclusa la fase laterale né in quale direzione il mercato ne è uscito. Quantum Imbalance Profiles costruisce il profilo in modalità Volume Bid/Ask — il volume di ogni livello è suddiviso in vendite e acquisti — e lo integra con un profilo di squilibrio proprietario: la distribuzione delle espansioni impulsive per prezzo. Il profilo di volume e il delta descrivono la fase di equilibrio, il profilo di squilibrio descrive l'uscita da essa, e le bolle di delta sulle candele segnalano picchi di aggressività rispetto alla norma dello strumento.

Equilibrio e squilibrio

Il mercato alterna due stati. In equilibrio il prezzo resta in un intervallo stretto, il volume si concentra su un numero limitato di livelli e si forma un blocco di volume: una zona in cui un grande operatore costruisce la posizione a tranche contro la liquidità opposta. Quando la liquidità opposta si esaurisce, il prezzo esce dall'intervallo con un impulso: inizia lo squilibrio. Il profitto si realizza nello squilibrio, ma si prepara nell'equilibrio. L'indicatore mostra entrambe le fasi contemporaneamente: si vede non solo dove era il volume, ma anche in quale direzione il mercato lo ha realizzato.

Il calcolo non richiede lo storico dei tick e funziona con qualsiasi broker. I profili sono costruiti su un timeframe inferiore, il volume di ogni barra è distribuito su tutto il suo range e il rapporto tra acquisti e vendite è stimato in base alla posizione della chiusura nella barra, ponderata per volume tick o reale. Si tratta di una stima calcolata della pressione delle due parti, non di dati di borsa sull'iniziatore delle operazioni (Bid/Ask).

Caratteristiche principali

  • Profilo Volume Bid/Ask. Invece di una sola barra di volume, ogni livello ne mostra due: vendite (Bid) e acquisti (Ask) con la quota percentuale di ciascuna parte, e accanto una colonna del delta. Questa modalità è nota dalle piattaforme a cluster di borsa; qui è disponibile su qualsiasi simbolo MetaTrader senza storico dei tick. Si vede non solo dove si è scambiato, ma chi ha dominato a ogni prezzo.
  • Profilo di squilibrio proprietario. Non si basa sul volume ma sulle espansioni impulsive: contano solo le barre di spinta uscite da un intervallo di equilibrio stretto e la loro prosecuzione nella stessa direzione. Le normali oscillazioni e le barre con ombre lunghe sono escluse.
  • Direzione su ogni livello. La barra è divisa in una parte verde e una rossa: si vede quale parte ha spinto il prezzo attraverso il livello e quanto è marcato lo squilibrio direzionale.
  • Equilibrio e uscita su un'unica schermata. Il profilo di volume e il profilo di squilibrio si trovano ai bordi opposti del grafico (i lati si possono invertire). Non serve tenere più indicatori e confrontarli manualmente.
  • Delta per prezzo con estremi evidenziati. La luminosità della cella corrisponde all'entità dello squilibrio Bid/Ask; i prezzi con il delta massimo di acquisti e di vendite sono evidenziati separatamente.
  • Selezione dei livelli per rilevanza. HVN e LVN sono scelti in base alla prominenza sul profilo e i livelli vicini vengono uniti; i livelli di squilibrio del delta in base a una soglia definita. Le linee terminano al profilo di squilibrio e non coprono le etichette.
  • Soglia adattiva delle bolle. Il delta della candela è valutato rispetto alla norma statistica dello strumento (Z-score), quindi il numero di segnali è paragonabile in mercati calmi e volatili. Un filtro a media mobile esclude i segnali contro trend.
  • Segnali senza repaint. La bolla di delta e l'avviso compaiono solo dopo la chiusura della candela. Il valore e la dimensione della bolla sono definitivi: il segnale non compare né scompare all'interno della barra, e lo storico sul grafico coincide con ciò che avete visto in tempo reale.
  • Disegno sincronizzato. I profili si ridisegnano insieme al grafico durante zoom e scorrimento, senza ritardi né sfarfallio.
  • Sei temi di colore e controllo dal pannello inferiore; le impostazioni sono salvate separatamente per ogni grafico.

Elementi sul grafico

  • Colonna del delta (DELTA) — differenza tra acquisti e vendite a ogni livello di prezzo: verde — squilibrio verso gli acquisti (Ask), rosso — verso le vendite (Bid); la luminosità è proporzionale all'entità del delta.
  • Delta massimo — il livello con il delta positivo massimo è evidenziato in verde, quello delle vendite in rosso.
  • Profilo Bid | Ask (VP PROFILE) — volume del livello suddiviso in vendite e acquisti, con la quota percentuale di ciascuna parte.
  • POC (Point of Control) — livello di volume massimo, evidenziato da una cornice.
  • Profilo di squilibrio (IMBALANCE PROFILE) — al bordo opposto del grafico (a destra per impostazione predefinita): parte verde della barra — espansioni al rialzo, rossa — al ribasso.
  • Etichette dei livelli chiave di squilibrio — direzione prevalente e forza del livello in percentuale del massimo, in una cornice del colore della parte dominante.
  • Linee HVN, LVN e D-IMB con etichetta di tipo e prezzo.
  • Bolle di delta sulle candele con il valore all'interno: verdi — acquisti, rosse — vendite; la dimensione cresce con la forza della deviazione.

Profilo di squilibrio

L'elemento principale dell'indicatore. Si basa sul legame tra liquidità e volatilità: il range di una barra mostra quanta liquidità opposta il mercato ha assorbito lungo il suo percorso. Finché la liquidità è sufficiente, il prezzo si muove entro il range abituale dello strumento. Quando gli ordini opposti si esauriscono, la barra si espande bruscamente: il prezzo attraversa i livelli senza resistenza.

Per questo ogni barra del timeframe inferiore è valutata rispetto alla norma statistica di volatilità dello strumento. Sono considerate barre di spinta quelle il cui range supera nettamente la norma, il cui corpo occupa la maggior parte del range e che sono uscite da un intervallo di equilibrio stretto. Se l'espansione è proseguita per più barre consecutive, si considera l'intero tratto. Ogni livello attraversato riceve un peso proporzionale al superamento della norma: più forte l'espansione, più lunga la barra. La norma è calcolata in continuo, quindi il profilo è ugualmente valido in mercati calmi e volatili.

  • Barra prevalentemente verde — il livello è stato attraversato da espansioni al rialzo, iniziativa del compratore.
  • Prevalentemente rossa — da espansioni al ribasso, iniziativa del venditore.
  • Rapporto simile — il livello è stato attraversato con impulso in entrambe le direzioni e non indica una direzione propria.
  • Nessuna barra — non ci sono state espansioni impulsive attraverso il prezzo: il mercato lo ha attraversato senza accelerazione oppure vi ha scambiato in equilibrio.

I livelli più forti sono etichettati sul profilo. Sono zone prioritarie per un retest dopo l'uscita dall'equilibrio. I criteri di impulso sono regolabili: si possono mantenere solo le espansioni più marcate oppure includere anche quelle più moderate.

Profilo di volume e delta

POC. Prezzo di volume massimo — centro della zona di scambio, prezzo medio di costruzione delle posizioni.

Squilibrio Bid | Ask. Uno squilibrio marcato indica il dominio di una parte sul livello; valori di Bid e Ask vicini indicano scambi bilaterali (equilibrio sul livello).

Delta. Mostra quale parte è stata aggressiva all'interno dell'equilibrio. Un delta forte in una direzione senza prosecuzione del movimento è segno di assorbimento: un grande operatore passivo assorbe gli ordini a mercato con ordini limite e difende il livello.

Livelli

  • HVN (High Volume Node) — nodi ad alto volume. Qui il mercato ha accettato il prezzo; al ritorno il movimento di solito rallenta. Usati come zone di supporto e resistenza.
  • LVN (Low Volume Node) — nodi a basso volume. Qui il mercato ha rifiutato il prezzo. Gli LVN separano zone di equilibrio adiacenti e fungono da riferimento per i target.
  • D-IMB BUY / D-IMB SELL — livelli di squilibrio del delta: prezzi in cui lo squilibrio Bid/Ask (delta) supera la soglia definita.

Come leggere D-IMB. Il livello viene tracciato dove il delta a un prezzo raggiunge una quota definita (60% per impostazione predefinita) del delta massimo del profilo. D-IMB BUY è un prezzo in cui i compratori (Ask) hanno dominato i venditori (Bid), D-IMB SELL il contrario. Sono le zone in cui una parte ha mostrato la maggiore aggressività all'interno dell'equilibrio. Quando il prezzo torna su un livello D-IMB conta la reazione: se la stessa parte lo difende di nuovo, funge da supporto (BUY) o resistenza (SELL); se il prezzo lo attraversa senza reazione, l'aggressività è stata assorbita e il livello ha perso significato.

D-IMB e profilo di squilibrio sono strumenti diversi. D-IMB mostra lo squilibrio Bid/Ask all'interno della zona di scambio, cioè chi è stato più aggressivo dove si è scambiato volume. Il profilo di squilibrio mostra le espansioni impulsive del prezzo, cioè attraverso quali livelli il mercato è uscito dall'equilibrio. La concordanza tra la direzione di D-IMB nella zona di equilibrio e il colore del profilo di squilibrio all'uscita è una forte conferma dello scenario.

Ogni tipo di livello si attiva con un pulsante dedicato sul pannello; è possibile visualizzarli tutti contemporaneamente.

Bolle di delta

Le candele con delta anomalo sono contrassegnate da bolle. Il segnale viene fissato solo sulla candela chiusa, quindi il valore e la dimensione della bolla sono definitivi e non vengono ridisegnati. In modalità adattiva il delta della candela è confrontato con lo storico recente dello strumento (Z-score), quindi la soglia si adatta all'attività corrente. La sensibilità si cambia con il pulsante Z sul pannello: 2, 3 o 4 deviazioni standard — più alto il valore, più rari e significativi i segnali. In modalità fissa la soglia è impostata come percentuale del delta massimo. Il filtro a media mobile lascia passare le bolle di acquisto solo sopra la media e quelle di vendita solo sotto.

Metodo di lavoro

  1. Individuate la zona di equilibrio: la parte larga del profilo di volume, il POC e i livelli HVN.
  2. Valutate il delta all'interno dell'equilibrio: i livelli di delta massimo di acquisti o vendite mostrano quale parte è stata più aggressiva.
  3. Controllate il profilo di squilibrio sopra e sotto la zona di equilibrio: il colore delle barre indica la direzione di uscita. La concordanza tra la parte del delta e la direzione dell'espansione conferma lo scenario.
  4. Attendete il retest di un livello di squilibrio etichettato e una bolla di delta nella direzione dell'espansione originale. Stop di protezione — oltre il limite opposto della zona di equilibrio da cui è partita l'espansione. Target — l'LVN più vicino e l'HVN successivo.

Se i segnali divergono. Delta forte senza espansione — l'aggressività viene assorbita da un grande operatore con ordini limite, il livello probabilmente terrà. C'è espansione, ma il delta nell'equilibrio era contrario — l'uscita potrebbe essere stata una caccia agli stop, è probabile un ritorno nella zona di equilibrio.

Pannello di controllo

  • LEVELS — pulsanti HVN, LVN e D-IMB.
  • SIGNALS — il pulsante BUBBLES attiva e disattiva le bolle di delta, Z ne imposta la sensibilità.
  • THEME — CLASSIC, NEON, OCEAN, SUNSET, LIGHT per un grafico chiaro e CUSTOM con colori personalizzati. Il tema LIGHT ricolora il grafico e ripristina i colori originali alla rimozione dell'indicatore.

Lo stato dei pulsanti, il tema e la soglia sono salvati per ogni grafico e non si azzerano al cambio di timeframe.

Strumenti consigliati

  • Metalli: XAUUSD, XAGUSD — frequenti zone di equilibrio e uscite brusche, il profilo di squilibrio è particolarmente informativo.
  • Indici: US30, NASDAQ, SP500, DAX.
  • Criptovalute: BTCUSD, ETHUSD.
  • Forex: EURUSD, GBPUSD, USDJPY e altre coppie liquide.

Timeframe consigliati

  • M5–M30 — trading intraday, modalità principale.
  • H1 — zone di equilibrio di più sessioni e grandi espansioni.
  • H4–D1 — struttura settimanale e mensile.

Avvisi

Avvisi Pop-up, Push ed Email su una nuova bolla di delta dopo la chiusura della candela. Per le notifiche Push inserite il vostro MetaQuotes ID nelle impostazioni del terminale (Strumenti → Opzioni → Notifiche). Il terminale deve essere in esecuzione (oppure usate un VPS).

Parametri di input

  • Layout Mode: profilo di volume a sinistra e profilo di squilibrio a destra, o viceversa.
  • Profile + Delta Style / Imbalance Profile Style: stile sfumato o classico.
  • Lookback Period: numero di barre per profili e bolle.
  • Number of Bins: numero di livelli di prezzo.
  • Max Profile Width: larghezza del profilo in percentuale della larghezza del grafico.
  • Imbalance labels: numero di livelli di squilibrio etichettati.
  • Impulse: min bar strength, min body: quante volte il range della barra deve superare la norma di volatilità e quota minima del corpo.
  • Impulse: accumulation bars, max accumulation width: durata e larghezza massima dell'intervallo di equilibrio prima dell'impulso (in norme di volatilità).
  • HVN / LVN / D-IMB levels: livelli attivi all'avvio.
  • HVN min volume, LVN max volume, HVN/LVN min prominence: soglie e rilevanza dei livelli.
  • D-IMB threshold: soglia dei livelli di squilibrio del delta.
  • Show Imbalance Profile, Max Imbalance Profile Width: visualizzazione e larghezza del profilo di squilibrio in pixel.
  • Color Theme e colori di Bid, Ask, delta e profili per il tema CUSTOM.
  • Show Delta Column, Delta Cell Width, Show Bid/Ask % Text: colonna del delta ed etichette.
  • Bubble Detection Mode: Off, Adaptive o Fixed; Statistical Period, Z-Threshold, Fixed %: soglia delle bolle.
  • Scale Bubble Size, Glow Effect, Show Bullish / Bearish Bubbles: aspetto delle bolle.
  • MA Filter: attivazione, periodo, metodo e prezzo della media mobile.
  • Alerts, Alerts Email, Alerts Mobile: modalità di avviso.
  • Global Text Size, Vertical Shift, Use Real Volume, Disable Chart Autoscroll: altre impostazioni.

Provate prima di acquistare

Scaricate la versione demo ed eseguitela nel Tester di strategie sul vostro strumento e timeframe. Vedrete la costruzione del profilo di volume, della colonna del delta e del profilo di squilibrio, oltre ai livelli e alle bolle di delta sullo storico reale delle quotazioni.

L'indicatore è uno strumento di analisi e non apre operazioni. Le decisioni di trading e la gestione del capitale restano responsabilità dell'utente.

Prodotti consigliati
Order Blocks All-in-One — SMC Indicator for MT4 For MT5 version: https://www.mql5.com/en/market/product/166409 A comprehensive Order Block technical analysis indicator designed to track the execution lifecycle of structural zones from initial formation to mitigation and potential conversion into breakout levels within a single implementation. Built upon the framework of Market Structure and Smart Money Concepts (SMC) , this tool maps key price action levels directly onto the MetaTrader 4 termina
El indicador "MR BEAST ALERTAS DE LIQUIDEZ" es una herramienta avanzada diseñada para proporcionar señales y alertas sobre la liquidez del mercado basándose en una serie de indicadores técnicos y análisis de tendencias. Ideal para traders que buscan oportunidades de trading en función de la dinámica de precios y los niveles de volatilidad, este indicador ofrece una visualización clara y detallada en la ventana del gráfico de MetaTrader. Características Principales: Canal ATR Adaptativo: Calcula
PipMaster is built using a powerful trend + momentum following algorithm. Made after years of testing and with market noise filtering built-in.  Aggressive traders can enter a trade as soon as an arrow appear. Conservative traders should wait for a visual alert after a closed candle bar. This indicator is a great tool to be used with your most trusted trend/momentum trading strategy and with solid money management rules. Key Benefits: -Super easy to use by following color coded arrow pointing t
TradingDesk
Christian Weilinger
4 (1)
TradingDesk – Performance Analyse MT4 To test the indicator download free Demo version here: https://www.mql5.com/en/market/product/40471 TradingDesk analysed MetaTrader 4 historical data by Symbol, Magic Number, Trade or Comment. All these evaluations will be displayed in real time on your MetaTrader 4 chart window. All this information will be displayed in the following dashboards: account info General information about the account is displayed in the account info dashboard. performance inf
Glod888EA
Dong Liang Zheng
Our team has been professionally developing gold trading EAs for three years. Every engineer is a real-account forex and gold trader with years of experience. This integrates multiple technologies, including trend following, Martingale, grid, and AI. Currently, we are using it for our own live trading and encourage everyone to download and test it. If wish to observe our trading, please feel free to contact us. Thank you all, and we wish you great success and massive profits
Pips Slayer
Tom Seljakin
3.75 (4)
Advanced Reversal Detection & Price Action Indicator BUY LOW. SELL HIGH. IDENTIFY REVERSALS. MANAGE YOUR RISK. A professional trader doesn't chase the market. The objective is to identify potential turning points, enter at advantageous price levels and maximize the potential reward relative to the risk. Pips Slayer was developed around exactly this trading philosophy. Pips Slayer is an advanced technical analysis indicator designed to identify potential market reversals using a combination of pr
FREE
The Wing Patterns indicator scans for many different kinds of Patterns using an XABCD structure. The term Wing Pattern is used to refer to all types of patterns based on a general XABCD structure, which is plotted in an alternate high-low extreme form. In other words, assume that point X is started at a low point on the chart. The point A is plotted at the next highest point within a certain number of bars. This certain number of bars is called the depth level. In this example, point B would be
Before
Nadiya Mirosh
The Before indicator predicts the most likely short-term price movement based on complex mathematical calculations. Most of the standard indicators commonly used in trading strategies are based on fairly simple calculations. This does not mean that there were no outstanding mathematicians in the world at the time of their creation. It is just that computers did not yet exist in those days, or their power was not enough for the sequential implementation of complex mathematical operations. Nowad
This is the complete REX package. It consists of the lite, pro and ULTRA version.  Perfect for beginners and intermediates. REX complete is 100% non repaint. The strategy is based on a mix of different strategies, statistics, including pivot points, oscillators and patterns.  As the trading idea consists of a variety of some classic indicators like Momentum, Williams Percent Range, CCI, Force Index, WPR, DeMarker, CCI, RSI and Stochastic, it is clear that the fundamental indicators have being u
Reback
Yazhou Liu
This index can be traced back to historical transactions, and can clearly see the trading location, trading type, profit and loss situation, as well as statistical information. Showlabel is used to display statistics. Summy_from is the start time of order statistics. This parameter is based on the opening time of the order. Backtracking can help us to correct the wrong trading habits, which is very important for beginners to learn manual transactions. This index is suitable for each time per
RaysFX Candlestick Signals RaysFX Candlestick Signals è un potente strumento progettato per migliorare la tua esperienza di trading su MT4. Questo indicatore personalizzato è stato sviluppato con l’obiettivo di fornire segnali di trading precisi e tempestivi basati su specifiche configurazioni di candele e l’indicatore RSI. Caratteristiche principali : Segnali di acquisto e vendita : L’indicatore genera segnali di acquisto e vendita basati su specifiche configurazioni di candele e valori dell’i
Insides
Ivan Simonika
Determining the market trend is an important task for traders. The Inside indicator implements an improved algorithm for visualizing the market trend. The main purpose of the indicator is to evaluate the market on small timeframes (i.e. M1, M5 and M15) for scalping. If you are a scalper looking for a reliable indicator to improve the quality of your trading, Inside is what you need. The indicator works in a separate window, showing red and green bars on the histogram. Two consecutive green (red
Quant Direction
Georgios Kalomoiropoulos
Quant Direction è uno strumento di analisi di mercato 3D. Offre un'analisi di mercato perfettamente oggettiva, basata su algoritmi, calcolando con precisione le deviazioni percentuali su diversi parametri. Sviluppato utilizzando strumenti di modellazione avanzati basati sull'intelligenza artificiale e rigorosamente testato, questo algoritmo analizza il mercato con una precisione senza pari. È possibile analizzare qualsiasi coppia di valute o strumento finanziario sulla piattaforma. Che si pratic
Fusion Cross
Adolfina Denysenko
Fusion Cross is a modern arrow indicator for MetaTrader 4 that combines the power of several proven tools: WPR (Williams Percent Range) RSI (Relative Strength Index) Their combination generates highly accurate market entry signals, rejecting false signals and displaying only those points where the probability of a reversal or continuation of the movement is truly high. Key Features: Clear buy and sell arrow signals directly on the chart. Instant notifications: sound alert, emai
Towers
Yvan Musatov
Towers - Trend indicator, shows signals, can be used with optimal risk ratio. It uses reliable algorithms in its calculations. Shows favorable moments for entering the market with arrows, that is, using the indicator is quite simple. It combines several filters to display market entry arrows on the chart. Given this circumstance, a speculator can study the history of the instrument's signals and evaluate its effectiveness. As you can see, trading with such an indicator is easy. I waited for an a
Trendiness Index
Libertas LLC
5 (3)
"The trend is your friend" is one of the best known sayings in investing, because capturing large trendy price movements can be extremely profitable. However, trading with the trend is often easier said than done, because many indicators are based on price reversals not trends. These aren't very effective at identifying trendy periods, or predicting whether trends will continue. We developed the Trendiness Index to help address this problem by indicating the strength and direction of price trend
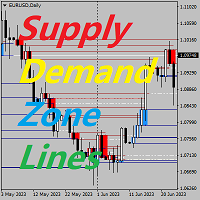
Indicatori chiave dei prezzi della zona di domanda e offerta sfondo Il sistema ricerca automaticamente le aree di domanda e offerta nella linea K e traccia in tempo reale le linee di prezzo chiave. I trader possono operare in base alle linee di negoziazione dei prezzi. Caratteristiche principali Il sistema ricerca automaticamente le aree di domanda e offerta nella linea K. Il sistema traccerà anche linee di prezzo chiave in tempo reale, e i trader potranno operare in base a tali linee di prezzo
Skynet Lasso
Roman Yablonskiy
This indicator displays entry and exit points in the market. The indicator is based on Parabolic and various mathematical and statistical methods to increase profitability and reduce the number of losing trades. The indicator helps in many cases to skip false inputs, the support and resistance lines go around the price in a certain mode, reducing losses. The dashboard shows the results of the indicator so that you can adjust it more accurately and see how the parameters affect the result. The n
The GGP Squeeze Momentum  MT4 Indicator is a volatility and momentum tool designed to help traders optimize their trading performance and providing traders with actionable insights to make well-informed trading decisions. This indicator is MT4 conversion of the Squeeze Momentum Indicator by “LazyBear “ in Trading View website and some alert methods are added to provide real-time alerts when a trading signal is generated, in order to allow traders to act quickly and efficiently. For MT5 version p
Forex Relative Performance indicator This indicator calculates the relative strength of major currencies against the US dollar. The basic idea behind this indicator is "to buy strong currency and to sell weak currency". This indicator allows you to quickly identify the best forex pair to trade according to your trading style (Intraday, Scalping, Swing, or Long Term) For demo testing please use MT5 version, because MT4 does not support Multicurrency Testing https://www.mql5.com/en/market/product/
The purpose of this new version of the MT4 standard indicator provided in your platform is to display in a sub-window multiple timeframes of the same indicator with its divergences. See the example shown in the picture below. But the display isn't like a simple MTF indicator. This is the real display of the indicator on its timeframe. Here's the options available in the FFx divergences indicator: Select the timeframes to be displayed (M1 to Monthly) Define the width (number of bars) for each tim
Pluuto Alert
Mati Maello
1 (1)
This indicator Pluuto Alert indicator.Indicator displays trend movement. Indicator calculates automatically line.Alert = arrow.When the alert is up the next alert is down,when the alert is down the next alert is up (new bar). Features FiltPer - displays indicator period.Line1. FiltPer2 - displays indicator period.Line2. Multiplier - displays indicator multiplier.(FlitPer,Line1;step) Deviation1 - displays indicator deviation.(Line2) Deviation2 - displays indicator deviation.(Arrow) Trend - displa
Levels price
Levi Kevin Midiwo
Levels price is a mt4 indicator that shows various levels to enter the market based on indicator calculations. The indicator consists of the following buffers; Red buffer Blue buffer Purple buffer The blue buffer is the resistance level where price is expected to bounce back.  The red buffer is the support level based on the current market price. There is also a purple buffer below red buffer that can indicate the current support and resistance levels have been breached when price crosses this p
Indicator without redrawing Divergent MAX The DivirgentMAX indicator is a modification based on the MACD. The tool detects divergence based on OsMA and sends signals to buy or sell (buy|sell), taking into account the type of discrepancies detected. Important!!!! In the DivirgentMAX indicator, the optimal entry points are drawn using arrows in the indicator's basement. Divergence is also displayed graphically. In this modification of the MACD, the lag problem characteristic of its predecessor i
This is Multiple Timeframe of Malaysia SNR Levels and Storyline. The single timeframe version   here Features: + Display level on multiple timeframe (higher or lower) + Turn on/off level on timeframe + Alert when price touch level 1. if high > resistance level but close of candle < resistance level , this level become unfresh - Name of level will have "(m)" meaning mitigated if   close of candle > resistance level , this level become invalid and can be removed in chart (there is setting for keep
L'indicatore costruisce le quotazioni attuali, che possono essere confrontate con quelle storiche e su questa base fanno una previsione del movimento dei prezzi. L'indicatore ha un campo di testo per una rapida navigazione fino alla data desiderata. Opzioni: Simbolo - selezione del simbolo che visualizzerà l'indicatore; SymbolPeriod - selezione del periodo da cui l'indicatore prenderà i dati; IndicatorColor - colore dell'indicatore; HorisontalShift - spostamento delle virgolette disegnate d
PABT Pattern Indicator - it's classical system one of the signal patterns. Indicator logic - the Hi & Lo of the bar is fully within the range of the preceding bar, look to trade them as pullback in trend. In the way if indicator found PABT pattern it's drawing two lines and arrow what showing trend way.  - First line - it's entry point and drawing at: 1. On the high of signal bar or on middle of the signal bar (depending from indicator mode) for buy; 2. On the low of signal bar or on middle of t
TouchGuard Alert – Advanced Price Alert & Notification Indicator for MetaTrader 4 (MT4) TouchGuard Alert   is a fast, lightweight, and highly accurate price-touch   Alert & Notification   system designed for   MetaTrader 4 (MT4)   and   MetaTrader 5 (MT5) . It automatically sends real-time   Alerts, Pop-Up Alerts, Email Notifications, Push Notifications   and early-warning notifications when price touches or approaches your chart objects. Key Features (High-Precision Alert & Notification System)
IPDA and PD Ranges MT4
Thank-god Avwerosuoghene Odukudu
5 (1)
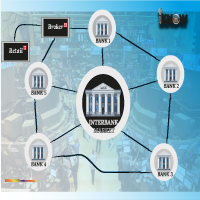
IPDA AND PD RANGES. Interbank Price Delivery Algorithm (IPDA) Range Liquidity and trades in the FX market take place in a decentralized manner as banks, brokers and electronic communication networks (ECNs) interact with one another to set prices. In FX, and ECN is a trading platform or electronic broker that hosts bids and offers and transmit them to users worldwide. ECN broadcasts a price around the world as various participants leave orders to buy and sell. Banks provide streaming prices based
TradeHistoryMapper EA
Dora Nafwa Mwabini
Visualizza il tuo vantaggio di trading con TradeHistoryMapper Ogni trader di successo lo sa: la tua cronologia è la chiave dei tuoi profitti futuri. TradeHistoryMapper trasforma la cronologia del tuo conto in una potente mappa visiva, che mostra esattamente dove vinci, dove perdi e come migliorare. Perché faticare tra infinite schede della cronologia del conto quando puoi vedere ogni operazione direttamente sul tuo grafico? 1. Visualizza istantaneamente le operazioni vincenti e quelle perden
Gli utenti di questo prodotto hanno anche acquistato
Currency Strength Wizard è un indicatore molto potente che ti fornisce una soluzione all-in-one per un trading di successo. L'indicatore calcola la potenza di questa o quella coppia forex utilizzando i dati di tutte le valute su più intervalli di tempo. Questi dati sono rappresentati in una forma di indice di valuta facile da usare e linee elettriche di valuta che puoi utilizzare per vedere il potere di questa o quella valuta. Tutto ciò di cui hai bisogno è collegare l'indicatore al grafico che
Trend SniperX MT4
Sarvarbek Abduvoxobov
5 (6)
Trend Sniper X è un indicatore di trend-following multi-timeframe per MetaTrader 5 che aiuta i trader a identificare la direzione del trend e i potenziali punti di inversione con chiarezza e precisione. Per MT5: https://www.mql5.com/en/market/product/181101 Informazioni sul prezzo: Il prezzo attuale è promozionale ed è soggetto a modifiche con il rilascio dei prossimi aggiornamenti e nuove funzionalità. Canale Code2Profit Domina il mercato con l'analisi multi-timeframe! Come massimizzare il tuo
M1 Sniper
Oleg Rodin
4.97 (30)
M1 SNIPER è un sistema di indicatori di trading facile da usare. Si tratta di un indicatore a freccia progettato per l'intervallo temporale M1. L'indicatore può essere utilizzato come sistema autonomo per lo scalping sull'intervallo temporale M1 e come parte del tuo sistema di trading esistente. Sebbene questo sistema di trading sia stato progettato specificamente per il trading sull'intervallo temporale M1, può comunque essere utilizzato anche con altri intervalli temporali. Inizialmente ho pro
SIO Oscillator: oscillatore auto-ottimizzante dello squilibrio di semivarianza Acquista l’indicatore e ricevi GRATIS l’Expert Advisor (EA) basato su di esso. La maggior parte degli oscillatori tratta ogni movimento di prezzo allo stesso modo. SIO separa la pressione rialzista da quella ribassista e misura lo squilibrio tra le due, mostrando quale parte controlla davvero il mercato: compratori o venditori. Quando lo squilibrio raggiunge un estremo, SIO genera un segnale chiaro con livelli di ingr
Gann Made Easy
Oleg Rodin
4.84 (174)
Gann Made Easy è un sistema di trading Forex professionale e facile da usare che si basa sui migliori principi del trading utilizzando la teoria di mr. WD Gann. L'indicatore fornisce segnali ACQUISTA e VENDI accurati, inclusi i livelli di Stop Loss e Take Profit. Puoi fare trading anche in movimento utilizzando le notifiche PUSH. CONTATTAMI DOPO L'ACQUISTO PER RICEVERE GRATUITAMENTE LE ISTRUZIONI DI TRADING E OTTIMI INDICATORI EXTRA! Probabilmente hai già sentito parlare molte volte dei metodi d
Questo indicatore è un indicatore per l'analisi automatica delle onde perfetto per il trading pratico! Caso... Nota:   non sono abituato a usare nomi occidentali per la classificazione delle onde a causa dell'influenza della convenzione di denominazione di Tang Lun (Tang Zhong Shuo Zen), ho chiamato l'onda base come   penna   e la banda dell'onda secondaria come   segmento   At allo stesso tempo, il segmento ha la direzione del trend. La denominazione   è principalmente segmento di trend   (que
Attualmente 30% di sconto! La soluzione migliore per ogni principiante o trader esperto! Questo software per cruscotti funziona su 28 coppie di valute. Si basa su 2 dei nostri indicatori principali (Advanced Currency Strength 28 e Advanced Currency Impulse). Offre un'ottima panoramica dell'intero mercato Forex. Mostra i valori di forza delle valute avanzate, la velocità di movimento delle valute e i segnali per 28 coppie Forex in tutti i (9) timeframe. Immaginate come migliorerà il vostro tra
Scalper Vault
Oleg Rodin
4.9 (41)
Scalper Vault è un sistema di trading potente e completo, progettato per i trader che desiderano ottenere risultati costanti nel trading intraday. Questo indicatore ad alta precisione funge da sistema di trading autonomo, offrendo analisi di livello istituzionale sia per il mercato Forex che per le Opzioni Binarie. CONTATTAMI DOPO L'ACQUISTO PER RICEVERE I MIEI CONSIGLI DI TRADING E UN FANTASTICO BONUS! Eliminando le congetture e le complesse analisi manuali, Scalper Vault ti permette di concen

Vi presentiamo ON Trade Waves Patterns Harmonic Elliot Wolfe, un indicatore avanzato progettato per rilevare vari tipi di pattern sul mercato utilizzando metodi sia manuali che automatici. Ecco come funziona: Pattern Armonici: Questo indicatore è in grado di individuare pattern armonici che appaiono sul vostro grafico. Questi pattern sono fondamentali per i trader che praticano la teoria del trading armonico, come descritta nel libro di Scott Carney "Harmonic Trading vol 1 & 2". Che li disegniat
RFI levels PRO
Roman Podpora
5 (2)
L'indicatore mostra accuratamente i punti di inversione e le zone di ritorno dei prezzi in cui il       Principali attori   . Vedi dove si formano le nuove tendenze e prendi decisioni con la massima precisione, mantenendo il controllo su ogni operazione. VERSION MT5     -     Rivela il suo massimo potenziale se combinato con l'indicatore   TREND LINES PRO Cosa mostra l'indicatore: Strutture di inversione e livelli di inversione con attivazione all'inizio di un nuovo trend. Visualizzazione dei l
ShapeRadar - indicatore dei pattern grafici classici ShapeRadar individua automaticamente sul grafico i pattern classici dell’analisi tecnica: doppi e tripli massimi e minimi, Testa e Spalle e la sua versione inversa, cunei ascendenti e discendenti, rettangoli, triangoli, bandiere e pennant. Quando il prezzo chiude oltre il limite di una figura, l’indicatore disegna il pattern, il punto di ingresso, il livello di stop loss e l’obiettivo, mentre un pannello informativo riassume tutti i pattern ri
PRO Renko System
Oleg Rodin
5 (31)
PRO Renko System è un sistema di trading altamente accurato appositamente progettato per il trading di grafici RENKO. Questo è un sistema universale che può essere applicato a vari strumenti di trading. Il sistema neutralizza efficacemente il cosiddetto rumore di mercato che consente di accedere a segnali di inversione accurati. L'indicatore è molto facile da usare e ha un solo parametro responsabile della generazione del segnale. Puoi facilmente adattare lo strumento a qualsiasi strumento di
SR Liquidity
Oleg Rodin
5 (3)
SR Liquidity è un indicatore di trading progettato per individuare le zone nascoste in cui si concentra la liquidità di mercato e dove il prezzo reagisce con maggiore intensità. Queste aree di liquidità agiscono come potenti livelli di supporto e resistenza, offrendo una mappa chiara dei punti in cui è più probabile che il mercato inverta la propria direzione. Invece di tracciare le classiche linee di supporto e resistenza, SR Liquidity analizza l'effettivo comportamento dei prezzi per individua
Auto Optimized SpeedAngle è un sistema di vettorizzazione del momento di livello istituzionale che elimina l'overfitting ( curve-fitting ) attraverso l'ottimizzazione continua Walk-Forward (WFO). Invece di affidarsi a input statici che si degradano quando i regimi di mercato cambiano, l'indicatore recalibra dinamicamente i suoi parametri utilizzando la validazione Out-of-Sample (OOS), assicurando che i segnali visualizzati rappresentino reali vantaggi statistici anziché anomalie storiche. Quadro
Route Lines Prices
Vitalyi Belyh
3 (1)
Route Lines Prices - è un indicatore progettato per individuare le direzioni di prezzo. La sua interfaccia semplice contiene diversi algoritmi per il calcolo del comportamento dei prezzi e della direzione futura. Questi algoritmi includono il calcolo della volatilità e lo smussamento dei prezzi in base ai timeframe utilizzati. L'indicatore ha un singolo parametro per modificare il valore di " Calculating price values ". Il valore predefinito di 1 fornisce un calcolo automatico bilanciato, che p
All in One package includes the  Oscillator Predictor ,  MACD Predictor ,  Thrust Scanner  and  Advanced Fibonacci  indicators which are mandatory for applying  Dinapoli  trade plans.  Please visit below links for detailed explanations of indicators. Advanced Fibonacci Indicator =>  https://www.mql5.com/en/market/product/52834 Thrust Scanner Indicator => https://www.mql5.com/en/market/product/52830 Overbought /Oversold Predictor indicator => https://www.mql5.com/en/market/product/52621 Macd P
Dark Support Resistance  is an Indicator for intraday trading. This Indicator is programmed to identify  Support and Resistance Lines , providing a high level of accuracy and reliability. Key benefits Easily visible lines Only the most important levels will be displayed Automated adjustment for each timeframe and instrument Easy to use even for beginners Never repaints, never backpaints, Not Lag 100% compatible with Expert Advisor development All types of alerts available: Pop-up, Email, Push
Super Signal – Skyblade Edition Sistema professionale di segnali di tendenza senza repaint / senza ritardo con tasso di vincita eccezionale | Per MT4 / MT5 Funziona meglio su timeframe più bassi, come 1 minuto, 5 minuti e 15 minuti. Caratteristiche principali: Super Signal – Skyblade Edition è un sistema intelligente di segnali progettato specificamente per il trading di tendenza. Utilizza una logica di filtraggio multilivello per identificare esclusivamente i movimenti direzionali forti, supp
PZ Turning Points MT4
PZ TRADING SLU
1 (1)
Identify key turning points with reliable fractal analysis This indicator examines the price structure of fractals of different periods to determine possible reversal points in the market, providing timing to positional traders that already have a fundamental or technical valuation model. Unlike its younger brother, Reversal Fractals , this indicator won't miss reversals because of the period selected, and will find reversal fractals on a zig-zag fashion, ignoring those reversals which do not
Neuro Poseidon MT4
Daria Rezueva
4.73 (45)
Neuro Poseidon is a new indicator by Daria Rezueva. It combines precise trading signals with adaptive TP/SL levels - creating best possible trades as a result! Message me and get  Neuro Poseidon Assistant  as a gift to automize your trading process! What makes it stand out? 1. Proven profitability on all assets and timeframes 2. Only confirmed BUY and SELL signals present on the chart 3. Adaptive TP & SL levels generated by the software for each trade 4. Easy to understand - suitable for all
CRT Multi-Timeframe Market Structure & Liquidity Sweep Indicator Non-Repainting | Multi-Asset | MT5 Version Available MT5 Version:   https://www.mql5.com/en/market/product/162075 Full User Guide — explains what each feature does and why:   https://www.mql5.com/en/blogs/post/767525 Quick Start User Guide  — explains how to configure and in what order:  https://www.mql5.com/en/blogs/post/767540 Indicator Overview CRT Ghost Candle HTF Fractal is a complete institutional-grade market structure too
Trend Lines PRO
Roman Podpora
5 (2)
LINEE DI TENDENZA PRO       Aiuta a capire dove il mercato sta realmente cambiando direzione. L'indicatore mostra reali inversioni di tendenza e punti in cui i principali attori rientrano. Vedi  Linee BOS   Cambiamenti di tendenza e livelli chiave su timeframe più ampi, senza impostazioni complesse o rumore inutile. I segnali non vengono ridisegnati e rimangono sul grafico dopo la chiusura della barra. VERSIONE MT 5     -      Svela il suo massimo potenziale se abbinato all'indicatore   RFI LEVE
Enigma Wyckoff
Yonny Pascal Ekwa Mezui
Enigma Wyckoff Enigma Wyckoff is a technical analysis indicator based on the Wyckoff methodology, designed to assist traders in analysing market structure, price behaviour, and potential accumulation and distribution phases. The indicator analyses price movement and market conditions to help identify potential Wyckoff-based setups and possible changes in market direction. It provides visual signals and analytical information directly on the chart, helping traders interpret the relationship betwe
PZ Harmonacci Patterns
PZ TRADING SLU
3.17 (6)
Trade smarter, not harder: Empower your trading with Harmonacci Patterns This is arguably the most complete harmonic price formation auto-recognition indicator you can find for the MetaTrader Platform. It detects 19 different patterns, takes fibonacci projections as seriously as you do, displays the Potential Reversal Zone (PRZ) and finds suitable stop-loss and take-profit levels. [ Installation Guide | Update Guide | Troubleshooting | FAQ | All Products  ] It detects 19 different harmonic pric
Professional Delta Volume MTF An indicator for MetaTrader 4 that displays the difference between buy and sell volume (Delta Volume) and the cumulative delta (Cumulative Delta). Version 2.0 adds full multi-timeframe (MTF) support, allowing data from H1, H4, or D1 to be displayed on the working chart (e.g., M5) without switching timeframes. The indicator shows the dominant market side (buyers or sellers) and helps identify divergences between price and volume. What the Indicator Displays Buy Volum
Neo Wave PRO
Nikolay Raykov
5 (1)
Price & Time Market Structure Indicator A professional market structure tool that analyzes waves through both price and time — not price alone. Main Description NeoWave PRO is a professional market structure indicator for MetaTrader 4 designed for traders who want to move beyond traditional one-dimensional wave tools such as ZigZag, swing indicators, and basic high/low systems. Most wave indicators analyze only one thing: Price. But a real market wave is not only a price movement. A true wave de
EZT Trend
Tibor Rituper
4.75 (4)
L'indicatore EZT Trend ti mostrerà la tendenza, il pullback e le opportunità di ingresso. Sono disponibili filtri opzionali e tutti i tipi di avvisi. Vengono aggiunti avvisi tramite posta elettronica e notifiche push. Stiamo anche sviluppando un EA basato su questo indicatore, che sarà presto disponibile. È un indicatore multifunzionale composto da due istogrammi di colore e una linea. È una rappresentazione visiva della direzione e della forza di un trend, inoltre troverai divergenze molte vo
PowerTech Prop Trading System PRO Intraday mapping, multi-source macroeconomic filtering, high-timeframe structural liquidity, and account risk control architecture engineered natively for MetaTrader 4 (MT4). Built specifically for Prop Firm Traders, Funded Account Challengers, and Day Traders, PowerTech Prop Trading System PRO organizes your intraday workflow directly on the chart: Asian/Tokyo accumulation boxes, multi-tier breakout target expansions, live prop-firm exposure tracking, automa
Hidden Cycles
Lev Vladimirovic Marushkin
5 (1)
The Only 100% Universal Tool! Stop trading against nature! This is your chance to secure the only indicator rooted in the absolute laws that govern the entire universe. Most tools guess—this one reveals the truth. Buy another toy or buy the truth. Your choice... Based on Universal Laws — NOT Some Guy’s Algorithm: Let the market adjust to the Hidden Cycles Geometry — not the other way around. Most indicators are based on a man-made formula. They often lag, fail over time, or need constant re-o
Miraculous Indicator Binary & Forex v3 StrategySafe Miraculous Indicator Binary & Forex v3 StrategySafe è un indicatore professionale progettato per trader che cercano segnali chiari, strumenti di conferma avanzati e un metodo strutturato per operare sui mercati Binary e Forex. La versione v3 include MIR Dashboard, Miraculous Confirmation Dashboard, GANN Law, livelli Square of 9, angoli GANN e una modalità Forex più completa per un’analisi di mercato più precisa. Caratteristiche principali Modal
Altri dall’autore
Liquidity Scalper System: un sistema di trading basato sulla liquidità in formato indicatore. La maggior parte degli indicatori mostra solo una freccia, poi è il trader a decidere dove mettere lo stop, dove si trova il target e se fidarsi del segnale. Liquidity Scalper System copre l'intero ciclo del trade: trova i pool di liquidità, dà un segnale alla loro rottura, calcola subito Entry, Stop Loss e tre target, e mostra sul pannello le statistiche e i risultati della verifica su dati nuovi. Il
Breakout Force SMC — il centro di controllo della struttura del mercato per MetaTrader 4. L’indicatore rileva automaticamente le rotture della struttura (BOS) e i cambiamenti di carattere del trend (CHoCH). Per ogni segnale crea subito un piano operativo: ingresso, quattro obiettivi TP1–TP4 e stop loss basato sull’ATR. Mostra inoltre direttamente sul grafico quanto spesso ogni obiettivo è stato raggiunto. Non è un indicatore «tutto in uno» con centinaia di funzioni. Fa una cosa sola: analizza la
Liquidity Scalper System:   un sistema di trading basato sulla liquidità in formato indicatore. La maggior parte degli indicatori mostra solo una freccia, poi è il trader a decidere dove mettere lo stop, dove si trova il target e se fidarsi del segnale. Liquidity Scalper System copre l'intero ciclo del trade: trova i pool di liquidità, dà un segnale alla loro rottura, calcola subito Entry, Stop Loss e tre target, e mostra sul pannello le statistiche e i risultati della verifica su dati nuovi. Il
Cumulative Delta Pro
Stanislav Konin
5 (2)
Cumulative Delta Pro è un indicatore di delta cumulativo per individuare inversioni dove la pressione di acquirenti o venditori si è esaurita. La maggior parte degli indicatori di delta mostra solo un istogramma. Poi il trader deve valutare da solo lo squilibrio e cercare il momento di ingresso. Cumulative Delta Pro si occupa di questa parte del lavoro: costruisce attorno al prezzo un canale di delta adattivo, evidenzia le zone estreme in cui il lato aggressivo inizia a esaurirsi e fornisce segn
Adaptive Volatility Range (AVR) is a powerful tool for identifying key trend reversals. AVR accurately reflects the Average True Range (ATR) of volatility, taking into account the Volume-Weighted Average Price (VWAP). The indicator adapts to any market volatility by calculating the average volatility over a specified period. This ensures a stable performance with a positive trade outcome. Advantages of the AVR Indicator: 100% No Repaint –  All lines and signal arrows are formed in real time
Breakout Force SMC   — il centro di controllo della struttura del mercato per MetaTrader 5. L’indicatore rileva automaticamente le rotture della struttura (BOS) e i cambiamenti di carattere del trend (CHoCH). Per ogni segnale crea subito un piano operativo: ingresso, quattro obiettivi TP1–TP4 e stop loss basato sull’ATR. Mostra inoltre direttamente sul grafico quanto spesso ogni obiettivo è stato raggiunto. Non è un indicatore «tutto in uno» con centinaia di funzioni. Fa una cosa sola: analizza
Hidden Delta Flow MT5
Stanislav Konin
5 (2)
Hidden - Delta - Flow  is a professional trading system designed to detect hidden changes in market structure through comprehensive analysis of Hidden Divergence and Delta CVD Divergence, enhanced by normalized volume, an adaptive TP/SL model, and verifiable performance statistics. Instead of simply displaying price direction, the system analyzes the relationship between price movement and internal volume activity, allowing it to identify situations where the external price structure begins to
Hidden - Delta - Flow is a professional trading system designed to detect hidden changes in market structure through comprehensive analysis of Hidden Divergence and Delta CVD Divergence, enhanced by normalized volume, an adaptive TP/SL model, and verifiable performance statistics. Instead of simply displaying price direction, the system analyzes the relationship between price movement and internal volume activity, allowing it to identify situations where the external price structure begins t
L'indicatore Bull and Bear Zones è progettato specificamente per l'individuazione automatica e la visualizzazione delle zone di supporto e resistenza direttamente sul grafico. Il suo algoritmo unico consente di mostrare non solo le zone già testate dal mercato, ma anche potenziali zone target non ancora testate. L'indicatore monitora gli intervalli in cui si osserva uno squilibrio tra domanda e offerta. Caratteristiche principali: Individuazione automatica delle zone di supporto e resistenza : l
Adaptive Reversal Star   is a new generation indicator with an   advanced Adaptive algorithm , which additionally tracks potential reversal points and compares the values of the current market volatility when forming the main signals of the indicator.It provides accurate signals in real time without delays and redraws.Adaptive Reversal Star does not require any complex settings and additional calculations, just set it to the desired timeframe and select the parameter - Signal Filter. Why choose
Sniper Delta Imbalance   is a professional tool for deep delta analysis — the difference between buyer and seller volumes. It takes volume analysis to the next level, allowing traders to see in real time who controls the price — buyers or sellers — and to find precise entry points based on the actions of major market participants. This tool represents a unique style of analysis based on the ratio of demand and supply volumes and can be used to detect who holds control over price. At the core of

Golden Trend Pulse
Stanislav Konin
5 (2)
Golden Trend Pulse — indicatore di tendenza sviluppato appositamente per l'Oro, applicabile anche ai mercati delle criptovalute e azionari. L'indicatore è progettato per determinare con precisione le tendenze di mercato tramite metodi analitici avanzati. Lo strumento combina un'analisi multifattoriale della dinamica dei prezzi con un filtraggio adattivo del rumore di mercato, garantendo un'elevata precisione nell'individuare i punti chiave di ingresso e di uscita. Grazie al suo sistema intellig
Gold Scalper System  is a multifunctional trading system that combines a breakout strategy for key liquidity levels with confirmation and a built-in Smart DOM Pro module for market depth analysis. The system identifies zones of limit order accumulation, tracks activity at support and resistance levels, and generates signals at the moment of their breakout. Smart DOM Pro visualizes Bid/Ask volumes, identifies liquidity clusters, and helps determine the intentions of major market participants. G
Patriot EA
Stanislav Konin
Patriot EA is an advanced mesh system with improved performance. Patriot EA uses sophisticated technology to effectively manage unprofitable positions. When a losing series of orders occurs, an algorithm for closing unprofitable positions is activated. The Expert Advisor divides orders into several independent grids, closing the long-range (unprofitable) order by sequentially averaging part of the orders with a given Take Profit. A series of orders can be divided into several mixed series with
Adaptive Volatility Range [AVR] is a powerful tool for identifying key trend reversal points. AVR accurately reflects the Average True Range (ATR) of volatility, taking into account the Volume-Weighted Average Price (VWAP). The indicator adapts to any market volatility by calculating the average volatility over a specific period, ensuring a stable rate of profitable trades. You receive not just an indicator but a professional automated trading system , AVR-EA . Advantages: 100% No Repaint –
Reversal Zones Pro is an indicator specifically designed to accurately identify key trend reversal zones. It calculates the average true range of price movement from the lower to upper boundaries and visually displays potential zones directly on the chart, helping traders effectively identify important trend reversal points. Key Features: Reversal Zone Identification: The indicator visually displays potential reversal zones directly on the chart. This helps traders effectively identify importan
Volume PRO is an innovative and modernized indicator for analyzing trading volumes, which is an advanced version of traditional analysis tools. This high-tech indicator allows traders to effectively monitor trading activity without the need for complex calculations. It displays ticks for the selected time interval corresponding to the selected time frame in the form of a dynamic cumulative histogram, which is updated in real time as new trades are received. Key features: Innovative volume analys
Block Master Pro
Stanislav Konin
5 (3)
The Block Master Pro indicator is designed to visually identify areas on the chart where significant volumes from major market participants are likely concentrated. These areas, known as order blocks, represent price ranges where large players place their orders, potentially signaling a price reversal and movement in the opposite direction. Key Features: Order Block Identification: Block Master Pro effectively identifies order blocks by pinpointing price ranges where large orders are placed. Th
Advanced Reversal Hunter Pro (ARH) is a powerful, innovative volatility-based momentum indicator designed to accurately identify key trend reversals. Developed using a special algorithm that provides a clear construction of the average volatility range, without redrawing its values ​​and does not change them. The indicator adapts to any market volatility and dynamically adjusts the width of the band range, depending on current market conditions. Indicator advantages: Advanced Reversal Hunter Pro
Scalper Inside Volume Pro is a professional trading system that combines multiple indicators to calculate an overall composite signal. It is based on an algorithm focused on volume, the Money Flow Index, and the Smart Money concept. The indicator takes into account structural Swing points where price reversals occur. Scalper Inside Volume Pro provides all the necessary tools for successful scalping. This comprehensive trading system is suitable for traders in the Forex market as well as for use
Please contact me after your full purchase for great bonuses.                                     Adaptive Reversal Star Expert Advisor and an additional indicator as a gift Info Panel are waiting for you. Adaptive Reversal Star is a new generation indicator with an advanced Adaptive algorithm , which additionally tracks potential reversal points and compares the values of the current market volatility when forming the main signals
Ultimate Volatility Insight is a highly professional tool for analyzing and fully understanding market activity based on an advanced ATR with improved algorithms and calculation formulas. The indicator helps traders accurately assess market dynamics, identify key support and resistance levels, and effectively manage risks. Ultimate Volatility Insight works only with real data using live statistics. The indicator has been developed for over two years, and its effectiveness has been proven through
Reversal Pattern AI
Stanislav Konin
5 (1)
Reversal Pattern AI is a groundbreaking advancement in indicator development, combining artificial intelligence algorithms, multi-level market analysis, and classical technical analysis methods. It not only detects reversal patterns but also evaluates market inefficiencies, generating highly accurate trading signals.Thanks to its hybrid model, which utilizes price action analysis, volume, volatility, VWAP, and Volume AVG %, the indicator easily adapts to any market conditions. Reversal Pattern A
Sniper Delta Imbalance is a professional tool for deep delta analysis — the difference between buyer and seller volumes. It takes volume analysis to the next level, allowing traders to see in real time who controls the price — buyers or sellers — and to find precise entry points based on the actions of major market participants. This tool represents a unique style of analysis based on the ratio of demand and supply volumes and can be used to detect who holds control over price. At the core o
Gold Scalper System  is a multifunctional trading system that combines a breakout strategy for key liquidity levels with confirmation and a built-in Smart DOM Pro module for market depth analysis. The system identifies zones of limit order accumulation, tracks activity at support and resistance levels, and generates signals at the moment of their breakout. Smart DOM Pro visualizes Bid/Ask volumes, identifies liquidity clusters, and helps determine the intentions of major market participants. G
Gold Prop Firm   is a professional indicator specifically designed for trading gold (XAUUSD). It automatically identifies price consolidation ranges—key liquidity accumulation zones where potential breakouts are most likely to occur. The algorithm creates a   Breakout Box   around these areas, analyzes volume distribution, and determines   trigger strength . When the boundaries of the range are breached, the indicator generates clear trading signals in the form of arrows. Gold Prop Firm   is su
Advanced Market Footprint Profiles is a specialized market analysis tool, representing a customized volume distribution profile enhanced with Delta and Bid/Ask profiles. The indicator builds fixed horizontal profiles (Fixed Range), displaying the distribution of Volume, Delta, and Bid/Ask at each price level with high precision. Unlike standard horizontal volume profiles, which only show overall volume distribution, this indicator combines Volume, Delta, and Bid/Ask within the selected range a
Golden Trend Pulse   — trend indicator developed specifically for Gold, also applicable to the Cryptocurrency and Stock markets. The indicator is designed for precise determination of market trends using advanced analytical methods. The tool combines multifactor analysis of price dynamics and adaptive filtering of market noise, ensuring high accuracy in identifying key entry and exit points. Thanks to its intelligent system, the indicator effectively handles market variability, minimizing false
Reversal Zones Pro – an indicator specifically designed for accurately identifying key trend reversal zones. It calculates the average true range of price movement from lower to upper boundaries and visually displays potential reversal zones directly on the chart, helping traders efficiently pinpoint crucial turning points in the market. Key Features: Reversal Zone Identification: The indicator visually highlights potential reversal zones directly on the chart, enabling traders to effectively id
Quantum Profile System is a fully-fledged professional trading system with advanced algorithms, combining everything needed for confident and stable trading. This indicator merges trend direction analysis, volume concentration at key levels, dynamic adaptation to market volatility, and generation of trading signals with no delay or repainting. Quantum Profile System integrates a Linear Regression Volume Profile with an adaptive ATR-based trend channel. It includes an extended Volume Profile modu
Filtro:
Nessuna recensione
Rispondi alla recensione