Sniper Delta Imbalance MT5

Sniper Delta Imbalance is a professional tool for deep delta analysis — the difference between buyer and seller volumes. It takes volume analysis to the next level, allowing traders to see in real time who controls the price — buyers or sellers — and to find precise entry points based on the actions of major market participants. This tool represents a unique style of analysis based on the ratio of demand and supply volumes and can be used to detect who holds control over price.

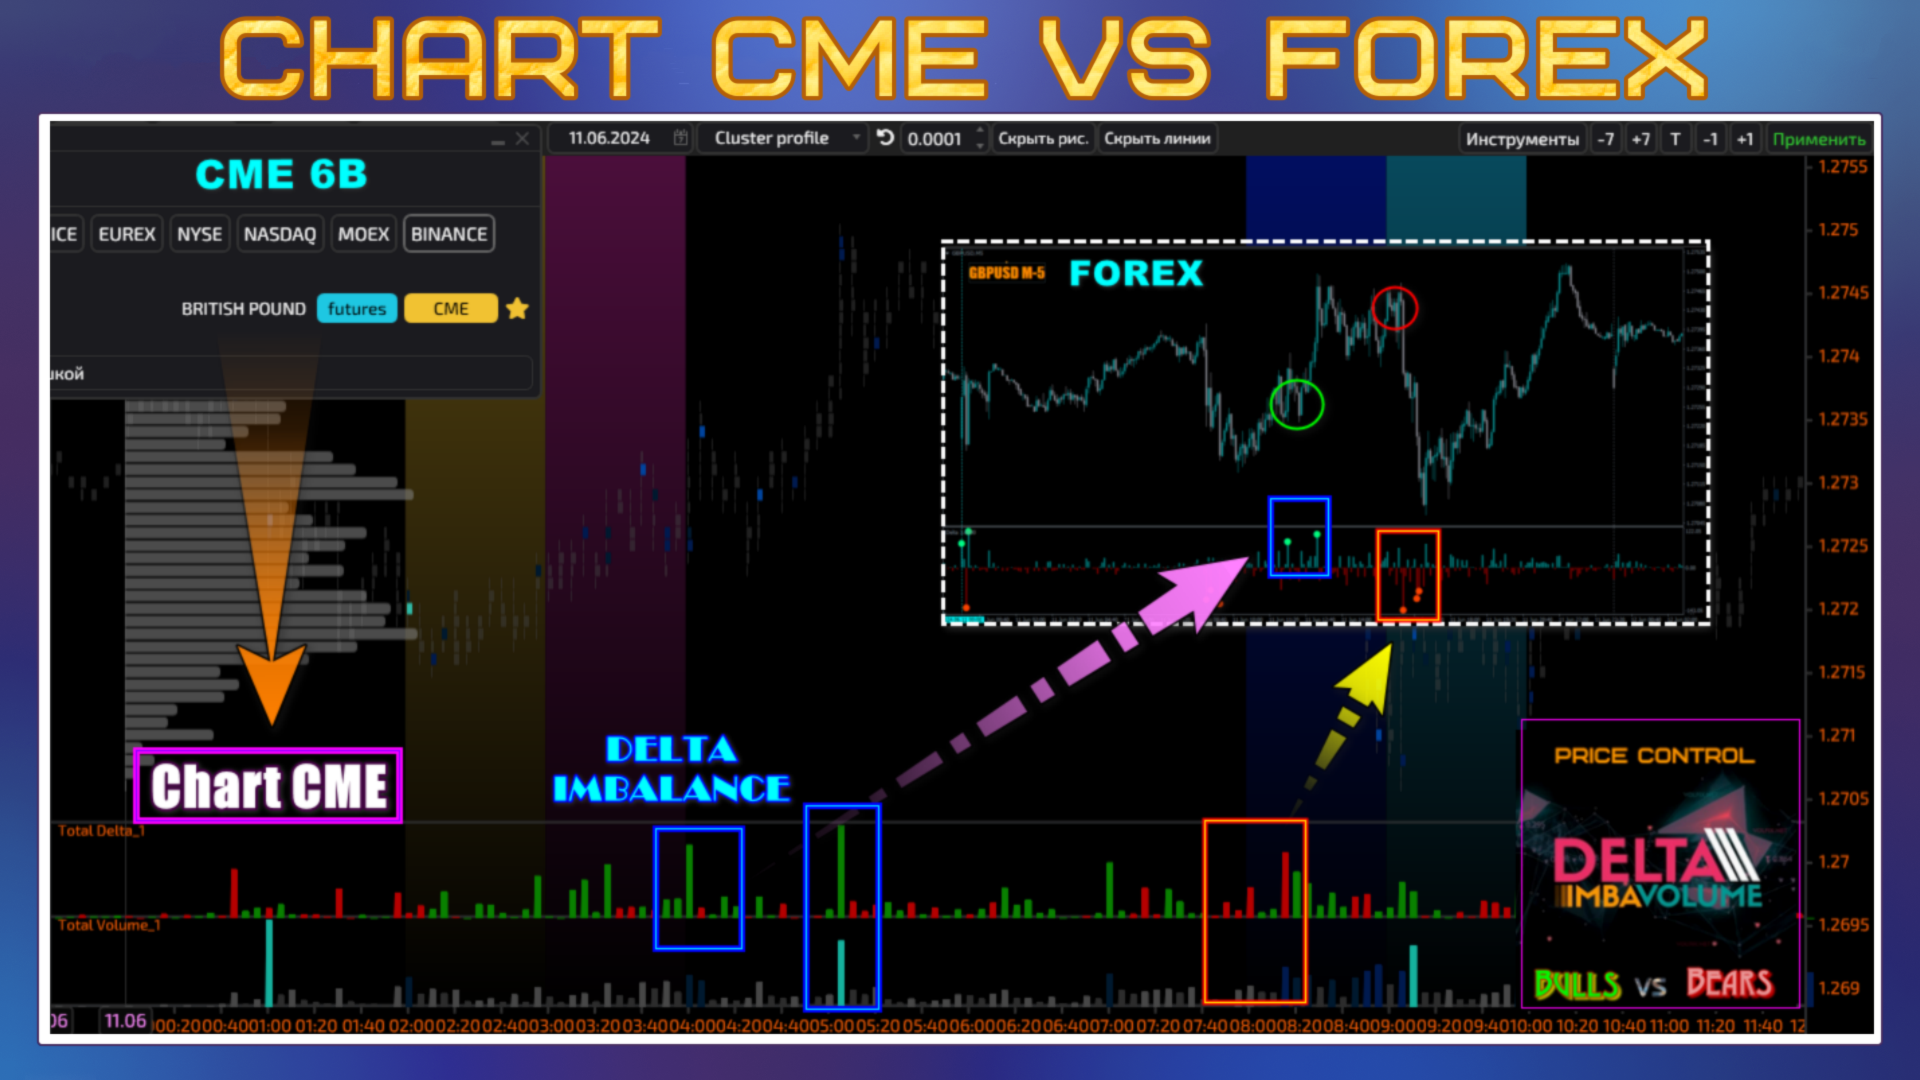
At the core of the indicator lies a unique approach — the use of aggregated market data to build delta histograms, signals, and an analysis panel. This ensures calculation accuracy and allows traders to see the reaction of large players directly on the chart.

Key Features:

 Real-time data
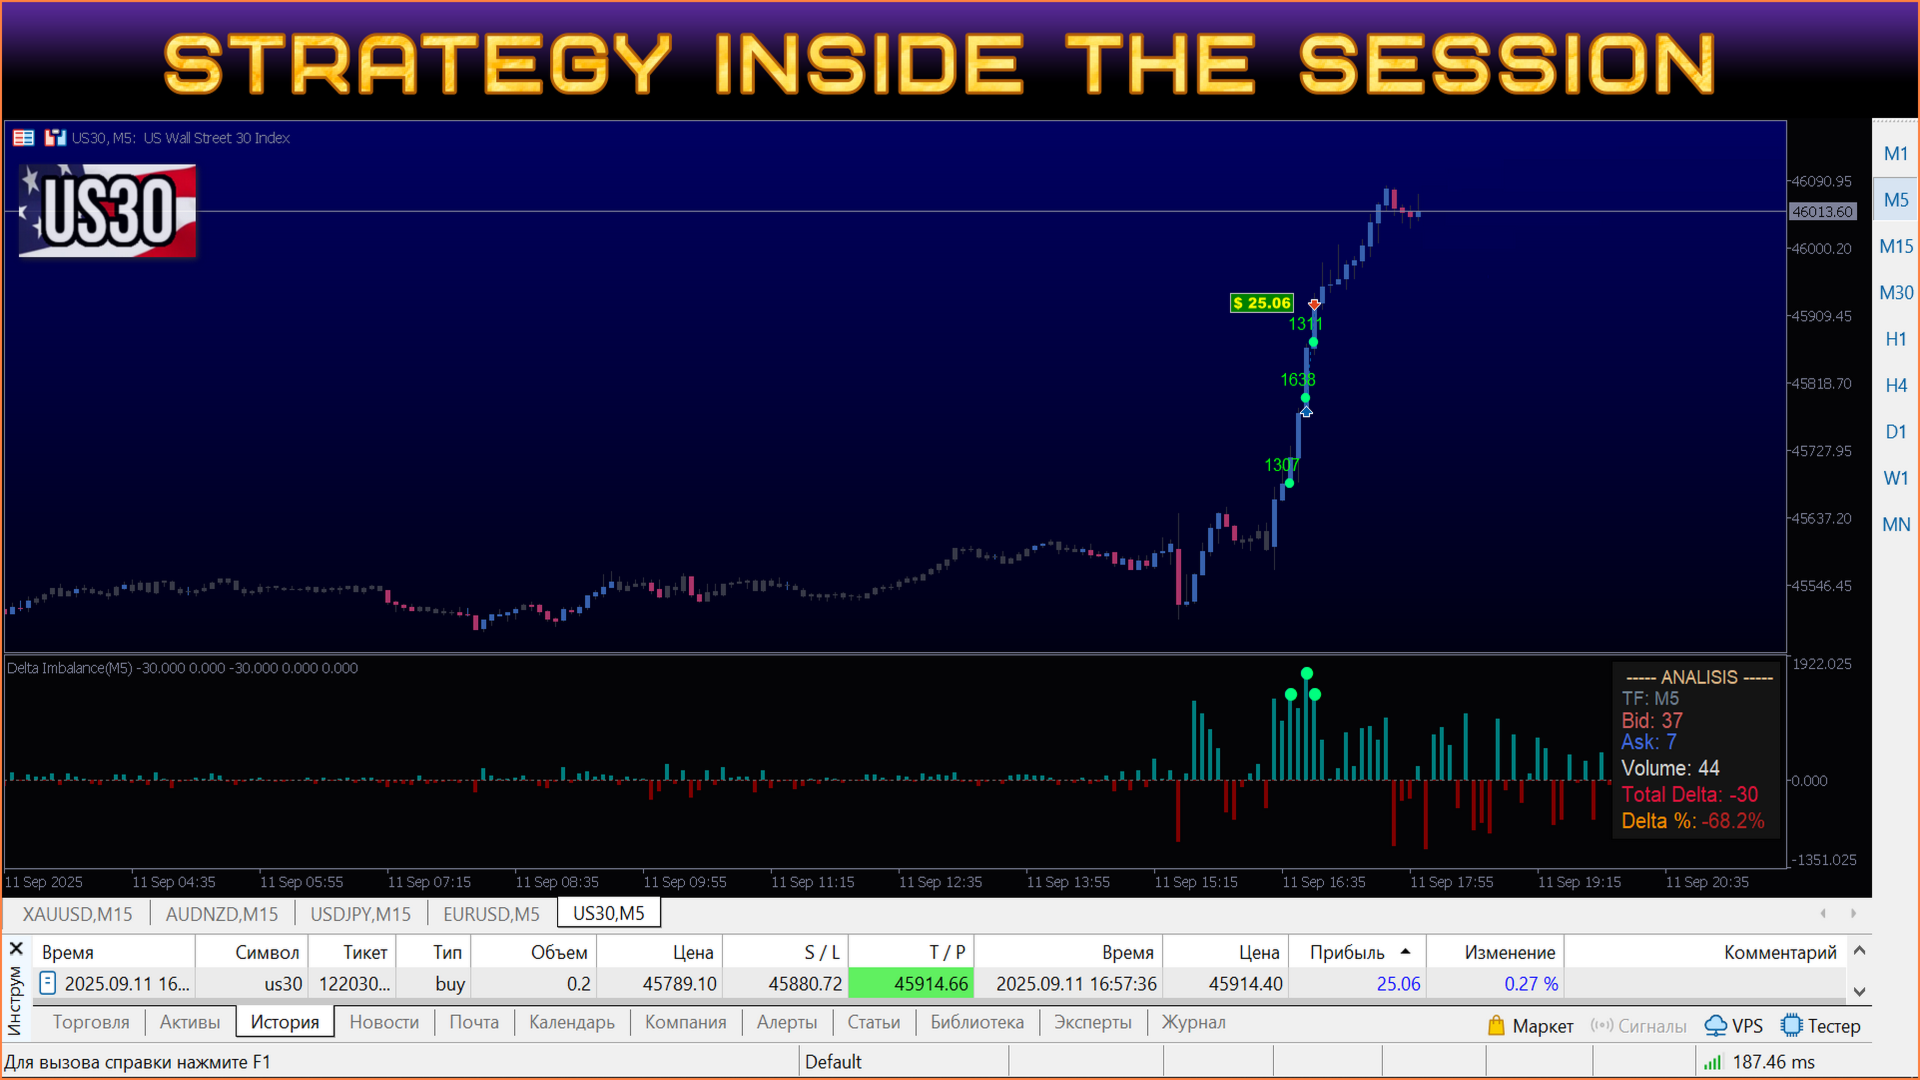
Unlike most indicators that only analyze the past and generate delayed signals (after the fact), Sniper Delta Imbalance works with real-time market data.

This gives you a critical edge: you don’t just see what has already happened — you see what is happening right now and who is driving the next price movement: buyers or sellers.

It answers the most important question: Who currently controls the price and continues to hold control?

 Delta Imbalance — the difference between buy and sell volumes

  1. Positive Delta (green value): signals dominance of aggressive buyers who absorb liquidity at Ask prices, often driving quotes upward.

  2. Negative Delta (red value): signals dominance of aggressive sellers who hit liquidity at Bid prices, putting downward pressure on price.

This clearly defines who is in control of the market: buyers or sellers. It enables traders to see the actions of major participants in real time for more accurate price forecasts.

 Entry Point Detection:

  • Continuation signals appear when “driving volumes” emerge.

  • Reversal signals form when “stopping volumes” appear.

 Multi-Timeframe Analysis (MTF):
You can analyze delta from any timeframe directly on your chart. For example, view M15 or H1 signals while trading on M5.

 Advanced Visualization:

  • Stylish information panel: Displays current Bid, Ask, total volume, delta, and delta percentage in real time.

  • Chart markers: Indicator signals are automatically shown as circles on the candles of the main chart, making it easier to spot entry points.

  • Value display: Numerical delta values are shown next to markers for a quick estimate of signal strength.

🔔 Alerts and Notifications

  • Pop-up Alerts.

  • Push notifications to your smartphone.

  • Email alerts.

  • Customizable sound alerts (choose your own audio file).

---------------------------------------------------------------------------------------------------------------------------------------------------------------------------

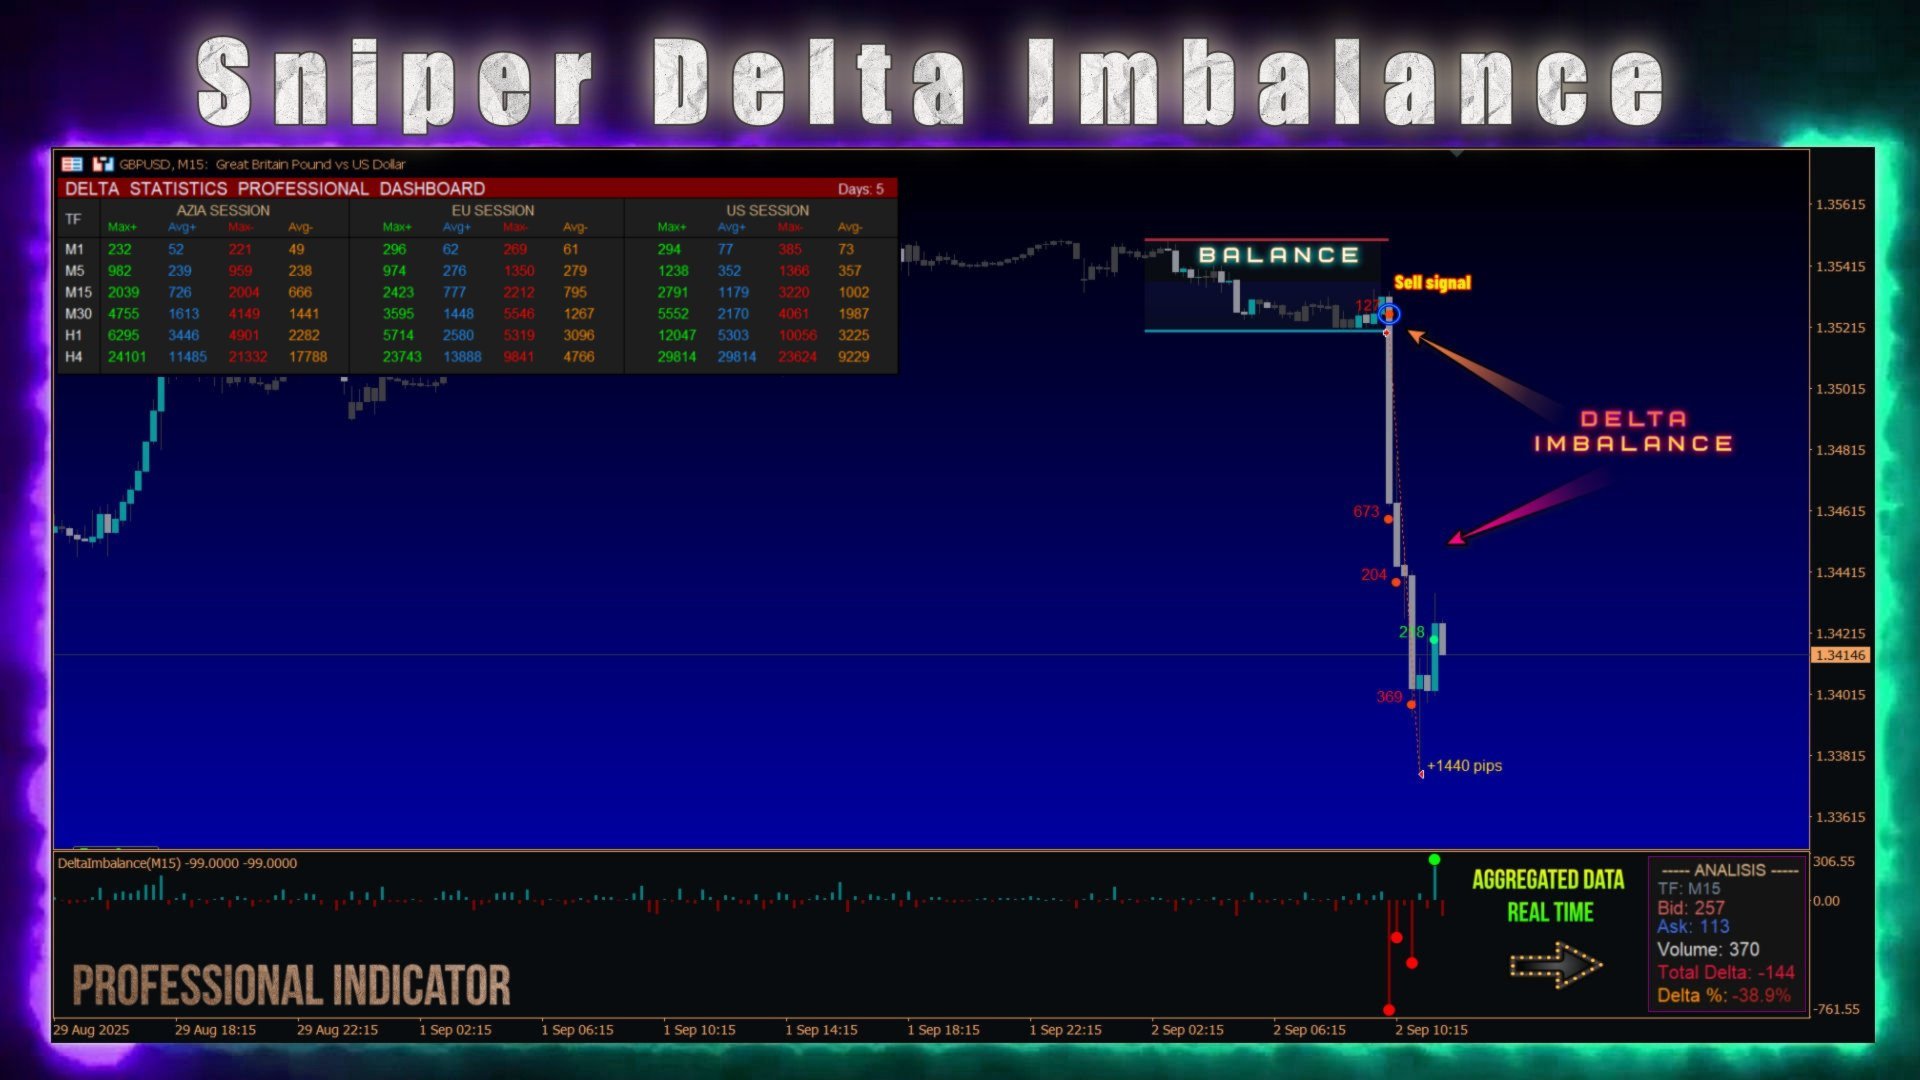
🎁 Bonus Indicator 👉 Delta Statistics Pro

A powerful analytical companion tool for collecting and analyzing delta statistics by trading sessions and timeframes.

This companion indicator is designed to gather, analyze, and visualize aggregated historical delta data, helping you fine-tune filters in the main Sniper Delta Imbalance indicator with maximum precision.

What it does:

  • Automatic statistics collection: Analyzes historical data for a chosen number of days.

  • Session comparison: Calculates separate statistics for Asian, European, and American trading sessions (customizable to your broker’s session times).

  • Multi-timeframe analysis: Collects data from several timeframes simultaneously.

  • Key metrics for each “session-timeframe” combination:

    • Max Positive Delta (Max+) and Average Positive Delta (Avg+)

    • Max Negative Delta (Max-) and Average Negative Delta (Avg-)

    • Number of signals in each category

Why it matters:
Collected statistics provide a data-driven foundation for setting up the Delta Filter in the main indicator. Instead of guessing filter levels, you can configure values based on actual historical data from your instrument.

Example: If statistics show that the average positive delta (Avg+) on EURUSD during the European session on M5 is 120, you can set the filter around 150–200 to filter out weak signals and keep only the strongest ones.

Additional features:

  • Stylish panel: All data is displayed in a customizable panel directly on the chart.

  • CSV Export: Export all collected statistics into a CSV file for deeper analysis in Excel or other tools.

Delta Statistics Pro transforms filter configuration from an “art” into a science, providing a solid analytical foundation for decision-making based on statistical data.

---------------------------------------------------------------------------------------------------------------------------------------------------------------------------

Recommendations for Setup

  • Trading Instrument: Indicator parameters depend on the instrument. Each pair has its own minimum, average, and maximum volumes, as well as abnormal spikes. This must be considered when setting the delta filter.

  • Timeframe Selection: Different timeframes may require different filter settings. Short-term trading usually requires more sensitive settings, while longer-term trading requires smoother ones.

  • Session Times: Volumes vary greatly across trading sessions. European and American sessions usually have higher volumes compared to Asian. Adjust your indicator accordingly. Session-specific volume statistics are strongly recommended for maximum efficiency.

Trading instruments:

Indices: US30, SP500, NQ, DX. Including stocks.

Metals: XAUUSD, XAGUSD

Commodities: Brent, WTI

Currencies: EURUSD, GBPUSD, correlated with DX.

Sniper Delta Imbalance is not just an indicator, but a professional-grade tool for traders who understand the importance of volume analysis. It has no true analogs, combining powerful functionality, flexible settings, and ease of use.

Learn to see the market through the eyes of major players — and add the confidence to your trading that only volume analysis can provide.

                                                           🎁 BUYING THE INDICATOR, YOU GET A FREE GIFT:

1. The "Delta Statistics Pro" indicator is designed for collecting and aggregating market data.

Its key task is to provide accurate statistics, which are used to fine-tune the filters of the main indicator, significantly improving the quality of the generated signals.

2. The "Vol Limit" indicator is a tool specifically created to work in tandem with the Sniper Delta Imbalance.

It provides additional filtration of market noise, allowing you to focus only on significant volumes and imbalances.

3. The detailed trading strategy guide is the result of two years of development and testing.

It includes a thorough description of a ready-made trading strategy that unlocks the full potential of the indicator combination.

4.Personal recommendations and support  you will receive step-by-step instructions, and I will personally help you understand all the configuration details and answer your questions.

                                             For more details, please contact me in private messages!

                                        
Prodotti consigliati
Was: $249  Now: $99   Market Profile defines a number of day types that can help the trader to determine market behaviour. A key feature is the Value Area, representing the range of price action where 70% of trading took place. Understanding the Value Area can give traders valuable insight into market direction and establish the higher odds trade. It is an excellent addition to any system you may be using. Inspired by Jim Dalton’s book “Mind Over Markets”, this indicator is designed to suit the
Il livello Premium è un indicatore unico con una precisione superiore all'80% delle previsioni corrette! Questo indicatore è stato testato dai migliori Specialisti di Trading per più di due mesi! L'indicatore dell'autore che non troverai da nessun'altra parte! Dagli screenshot puoi vedere di persona la precisione di questo strumento! 1 è ottimo per il trading di opzioni binarie con un tempo di scadenza di 1 candela. 2 funziona su tutte le coppie di valute, azioni, materie prime, criptovalu
L'indicateur SMC Venom Model BPR est un outil professionnel pour les traders travaillant dans le concept Smart Money (SMC). Il identifie automatiquement deux modèles clés sur le graphique des prix: FVG   (Fair Value Gap) est une combinaison de trois bougies, dans laquelle il y a un écart entre la première et la troisième bougie. Forme une zone entre les niveaux où il n'y a pas de support de volume, ce qui conduit souvent à une correction des prix. BPR   (Balanced Price Range) est une combinaiso
Volume Profile V6
Andrey Kolesnik
4.67 (3)
Indicatore del profilo di volume del mercato + oscillatore intelligente. Funziona su quasi tutti gli strumenti: coppie di valute, azioni, futures, criptovalute, sia su volumi reali che su tick. È possibile impostare la definizione automatica dell'intervallo di costruzione del profilo (ad esempio, per una settimana o un mese, ecc.), oppure impostare l'intervallo manualmente spostando i confini (due linee verticali: rossa e blu). Viene visualizzato sotto forma di istogramma. La larghezza dell'isto
Trade smarter, not harder: Empower your trading with Harmonacci Patterns This is arguably the most complete harmonic price formation auto-recognition indicator you can find for the MetaTrader Platform. It detects 19 different patterns, takes fibonacci projections as seriously as you do, displays the Potential Reversal Zone (PRZ) and finds suitable stop-loss and take-profit levels. [ Installation Guide | Update Guide | Troubleshooting | FAQ | All Products   |  Get Help ] It detects 19 differen
Strumento Avanzato di Analisi del Profilo dei Volumi per MetaTrader 5 Il Kecia Volume Profile Order Finder offre ai trader funzionalità di analisi del profilo dei volumi. Questo indicatore per MT5 combina la visualizzazione del profilo dei volumi con calcoli statistici per aiutare a identificare potenziali opportunità di trading e suggerisce livelli di entrata, stop loss e take profit basati sulla struttura del mercato. Visualizzazione del Profilo di Mercato Trasforma il tuo grafico con visualiz
Cumulative delta indicator As most traders believe, the price moves under the pressure of market buying or selling. When someone redeems an offer standing in the cup, the deal is a "buy". If someone pours into the bid standing in the cup - the deal goes with the direction of "sale". The delta is the difference between purchases and sales. A cumulative delta - the difference between the cumulative sum of purchases and sales for a certain period of time. It allows you to see who is currently contr
Awesome Oscillator by Bill Williams with the ability to fine-tune and replace the averaging algorithms of the indicator, which significantly expands the possibilities of using this oscillator in algorithmic trading and brings it closer in its properties to such an indicator as the MACD. To reduce price noise, the final indicator is processed with an additional Smooth averaging. The indicator has the ability to give alerts, send mail messages and push signals when the direction of movement of th
Volume Profile Canvas - Professional Volume Profile Indicator for MetaTrader 5 DESCRIPTION Volume Profile Canvas is a professional volume profile indicator for MetaTrader 5 that renders directly on the chart using a high-performance Canvas engine. It calculates and displays the volume distribution across price levels, identifying the Point of Control (POC), Value Area High (VAH) and Value Area Low (VAL) in real time. This is a pure analysis tool. It does not trade. It gives you an instant vi
"Impulses and Corrections 5" is created to help traders navigate the market situation. The indicator shows multi-time frame upward and downward "Impulses" of price movements. These impulses are the basis for determining the "Base" , which is composed of zones of corrections of price movements, as well as "Potential" zones for possible scenarios of price movement. Up and down impulses are determined based on a modified formula of Bill Williams' "Fractals" indicator. The last impulse is always "U
CosmiCLab SMC FIBO CosmiCLab SMC FIBO is a professional trading indicator designed for traders who use Smart Money Concepts (SMC), market structure analysis and Fibonacci retracement levels. The indicator automatically detects market swings and builds Fibonacci levels based on the latest impulse movement. It also identifies market structure changes such as BOS (Break of Structure) and CHOCH (Change of Character), helping traders understand the current market direction. CosmiCLab SMC FIBO also pr
Rainbow EA MT5
Jamal El Alama
Description : Rainbow EA MT5 is a simple Expert advisor based on   Rainbow MT5 indicator witch is based on Moving average with period 34. The indicator is incorporated in the EA, therefore, it is not required for the EA to operate, but if you wish, you can download it from   my product page . The Expert Advisor settings are as follows : Suitable for Timeframes up to H1 The parameters below can be set according to your trading rules. StopLoss ( Stop Loss in pips) TakeProfit ( Take Profit in pips
Gioteen Volatility Index (GVI) - your ultimate solution to overcoming market unpredictability and maximizing trading opportunities. This revolutionary indicator helps you in lowering your losing trades due to choppy market movements. The GVI is designed to measure market volatility, providing you with valuable insights to identify the most favorable trading prospects. Its intuitive interface consists of a dynamic red line representing the volatility index, accompanied by blue line that indicate
MultiTimeframe Support and Resistance Zones
Mohamed Gamal Abdelnasser Yous Hashesh
A powerful indicator that highlights key market zones and helps traders identify potential opportunities across multiple timeframes. Designed for clarity and efficiency, it provides real-time alerts to keep you informed of important price levels. Key Features: Works on multiple timeframes: M1, M5, M15, M30, H1, H4, D1, W1, MN1. Customizable zone colors for each timeframe. Real-time alerts and notifications when price reaches significant zones. Automatically manages chart objects to keep your wor
Introducing "X Marks the Spot" – Your Ultimate MetaTrader 5 Indicator for Perfect Trades! Are you tired of the guesswork in trading? Ready to take your MetaTrader 5 experience to a whole new level? Look no further – "X Marks the Spot" is here to revolutionize your trading strategy! What is "X Marks the Spot"? "X Marks the Spot" is not just another indicator – it's your personal trading compass that works seamlessly on all timeframes . Whether you're a beginner or an experienced trader,
This Volume Delta Profile is an advanced MetaTrader 5 indicator that visualizes   volume delta (order flow imbalance)   using a volume profile-style histogram. It shows the difference between buying and selling pressure at specific price levels, helping traders identify supply and demand zones. This indicator provides a unique perspective on market dynamics by visualizing the imbalance between buying and selling pressure, offering insights beyond traditional volume analysis. Core Concept Positiv
Introduction to the Manual Backtesting Indicator on MQL5 The MetaTrader platform provides an excellent backtesting tool for evaluating Expert Advisors (EAs). However, when it comes to manually backtesting a strategy to assess its effectiveness, this tool has some limitations: You cannot manually draw zones or trend lines while in backtesting mode. You cannot switch timeframes to check time alignment. For example, if my strategy requires additional confirmation from a higher timeframe (HTF), this
Smart Stochastic Divergence Detector Description: The Smart Stochastic Divergence Detector is a professional tool that automatically identifies Bullish & Bearish Divergences on your chart using the Stochastic Oscillator . It helps traders detect early reversals , hidden momentum changes , and trend continuation signals without the need for manual analysis. Whether you trade Forex, Indices, Stocks, or Crypto , this tool provides clear divergence signals with arrows and trendlines – allowin
Italian Questo indicatore funge da assistente avanzato per l'analisi dei grafici per i trader che amano operare con i Pattern Grafici (Chart Patterns). È progettato per ridurre il carico dell'analisi visiva e aumentare la precisione nell'ottenere profitti. Caratteristiche principali di questo indicatore dal punto di vista dell'utilizzo pratico: 1. Rilevamento automatico dei pattern (Automated Pattern Detection) Risparmia tempo e riduce le distorsioni (Bias): Non è necessario tracciare manualment
BoxChart MT5
Evgeny Shevtsov
5 (7)
The market is unfair if only because 10% of participants manage 90% of funds. An ordinary trader has slim changes to stand against these "vultures". This problem can be solved. You just need to be among these 10%, learn to predict their intentions and move with them. Volume is the only preemptive factor that faultlessly works on any timeframe and symbol. First, the volume appears and is accumulated, and only then the price moves. The price moves from one volume to another. Areas of volume accumu
L'indicatore costruisce le quotazioni attuali, che possono essere confrontate con quelle storiche e su questa base fanno una previsione del movimento dei prezzi. L'indicatore ha un campo di testo per una rapida navigazione fino alla data desiderata. Opzioni: Simbolo - selezione del simbolo che visualizzerà l'indicatore; SymbolPeriod - selezione del periodo da cui l'indicatore prenderà i dati; IndicatorColor - colore dell'indicatore; HorisontalShift - spostamento delle virgolette disegnate d
Scan pattern
VLADISLAV AKINDINOV
The indicator is designed to help in making a decision on the direction of trading (buy or sell). It is a history scanner that searches for matches of the current pattern (combination of several current bars) with historical data in percentage terms by the relative vertical position of candles relative to each other, the size of each candle, the size of the candle body and the candle shadows. In history, the matches found are indicated by vertical lines on the candle of the beginning of the soug
# DRAWDOWN INDICATOR V4.0 - The Essential Tool to Master Your Trading ## Transform Your Trading with a Complete Real-Time Performance Overview In the demanding world of Forex and CFD trading, **knowing your real-time performance** isn't a luxury—it's an **absolute necessity**. The **Drawdown Indicator V4.0** is much more than a simple indicator: it's your **professional dashboard** that gives you a clear, precise, and instant view of your trading account status. --- ## Why This Indicator
Harmonic Pattern Structure Harmonic Pattern Structure is a professional MetaTrader 5 indicator that automatically detects classic harmonic patterns using strict Fibonacci ratio validation and XABCD price structure. Designed for traders who value precision, clean visuals, and structured analysis, the indicator highlights potential reversal zones based on price geometry, supporting consistent and objective decision-making. SUPPORTED HARMONIC PATTERNS Gartley (222) Butterfly Bat Crab Shark Cy
Fvg Edge
Ahmad Meftah Abdulsalam Alawwami
5 (2)
FVG Smart Zones – Edizione Gratuita Indicatore di Rilevamento dei Gap di Valore Equo per MetaTrader 5 (MT5) Cerchi uno strumento di trading reale – non solo un altro indicatore casuale? FVG Smart Zones – Edizione Gratuita fornisce una visione professionale del mercato rilevando automaticamente i Fair Value Gap (FVG) e evidenziando zone di trading ad alta probabilità direttamente sul grafico. Ideato per trader che seguono: Smart Money Concepts (SMC) ICT Trading Concepts Price Action
FREE
Qauters Theory GBPJPY
Brighton Mufaro Mudzingwa
QT PRO Quarters Theory GBPJPY · London Open Breakout Plots 250-pip major quarters, 125-pip half-quarters, and 25-pip minor levels on GBPJPY. Monitors the London session open (08:00 GMT) and fires a single buy or sell arrow when price breaks and closes beyond the first key level — one signal per day, no repainting How it works now: Arrows only appear between 08:00–12:00 GMT (London session) — nothing outside that window 1 arrow per day maximum — once the first valid break is found, that day is
RSI Currency Strength Meter is a powerful and elegant multi-currency indicator that measures the real-time relative strength of the 8 major currencies using RSI logic. By calculating the smoothed performance of each currency across its major pairs and applying the RSI formula, it delivers clean and responsive strength lines that make it easy to spot which currencies are truly strong or weak at any moment. This indicator is particularly useful for visualizing currency correlations and divergence
Auto Optimized RSI   è un indicatore a freccia intelligente e facile da usare, progettato per fornire segnali di acquisto e vendita precisi. Utilizza simulazioni di trading su dati storici per individuare automaticamente i livelli RSI più efficaci per ogni strumento e timeframe. Questo indicatore può essere utilizzato come sistema di trading autonomo o integrato nella tua strategia esistente, ed è particolarmente utile per i trader a breve termine. A differenza dei livelli fissi tradizionali del
Wolfe Wave Scanner MT5
Reza Aghajanpour
5 (7)
**  All Symbols  x  All Timeframes  scan just by pressing scanner button ** *** Contact me  to send you instruction and add you in "Wolfe Wave Scanner group" for sharing or seeing experiences with other users. Introduction: A Wolfe Wave is created with five-wave patterns in price. It shows supply and demand and a fight towards a balance price. T hese waves of price actions can help traders identify the boundaries of   the trend . Also  It helps forecast how the price will move in the near futur
Cumulative Volume Delta (CVD) MA-X: Strumento Intelligente di Sentiment per l'Order Flow Sblocca i meccanismi nascosti del mercato con il Cumulative Volume Delta (CVD) MA-X . Mentre gli indicatori di volume standard ti dicono solo quanto è stato scambiato, il CVD MA-X ti dice CHI sta vincendo la battaglia tra compratori e venditori e QUANDO . Aggregando l'azione del prezzo a livello di tick e la distribuzione del volume, questo indicatore fornisce una mappa cristallina della convinzione e dell'
Gli utenti di questo prodotto hanno anche acquistato
Azimuth Pro
Ottaviano De Cicco
5 (6)
Azimuth Pro V2: Synthetic Fractal Structure and Confirmed Entries for MT5 Overview Azimuth Pro is a multi-level swing structure indicator by Merkava Labs . Four nested swing layers, swing-anchored VWAP, ABC pattern detection, three-timeframe structural filtering, and closed-bar confirmed entries — one chart, one workflow from micro-swings to macro-cycles. This is not a blind signal product. It is a structure-first workflow for traders who care about location, context, and timing. V2 Launch Offe
OmniSync Projection
Antonio-alin Teculescu
5 (1)
Chronos Fractal Engine is an innovative price projection indicator for MetaTrader 5, designed to transform your technical analysis by intelligently identifying and projecting historical price patterns. Built upon an advanced correlation algorithm and the fractal principles of the market, this powerful tool visualizes potential future price movements, giving you a unique edge in your trading decisions. What is Chronos Fractal Engine? At its core, the Chronos Fractal Engine employs a sophisticat
CGE Trading Suite
Carl Gustav Johan Ekstrom
5 (1)
Institutional-Grade Analytics for MT5 CGE Trading Suite delivers the analytical edge typically reserved for professional trading desks. The platform integrates a full suite of analytical tools into one seamless workflow: dynamic grid mapping, liquidity behavior analysis, ECM, trend lines, MIDAS, trade cycles, and directional channel projections. Together, these provide a unified view of market structure and momentum. Directional clarity is further enhanced by the capital flow index, which measu
RelicusRoad Pro: Sistema Operativo Quantitativo di Mercato 70% DI SCONTO ACCESSO A VITA (TEMPO LIMITATO) - UNISCITI A 2.000+ TRADER Perché la maggior parte dei trader fallisce anche con indicatori "perfetti"? Perché operano su Singoli Concetti isolati. Un segnale senza contesto è una scommessa. Per vincere serve CONFLUENZA . RelicusRoad Pro non è un semplice indicatore. È un Ecosistema Quantitativo completo . Mappa la "Fair Value Road", distinguendo tra rumore e rotture strutturali. Smetti di in
ARICoins
Temirlan Kdyrkhan
ARICoin is a powerful trading companion designed to generate high-probability entry signals with dynamic TP/SL/DP levels based on volatility. Built-in performance tracking shows win/loss stats, PP1/PP2 hits, and success rates all updated live. Key Features: Buy/Sell signals with adaptive volatility bands Real-time TP/SL/DP levels based on ATR Built-in MA Filter with optional ATR/StdDev volatility Performance stats panel (Success, Profit/Loss, PP1/PP2) Alerts via popup, sound, push, or email Cust
ARIPoint
Temirlan Kdyrkhan
ARIPoint is a powerful trading companion designed to generate high-probability entry signals with dynamic TP/SL/DP levels based on volatility. Built-in performance tracking shows win/loss stats, PP1/PP2 hits, and success rates all updated live. Key Features: Buy/Sell signals with adaptive volatility bands Real-time TP/SL/DP levels based on ATR Built-in MA Filter with optional ATR/StdDev volatility Performance stats panel (Success, Profit/Loss, PP1/PP2) Alerts via popup, sound, push, or email Cu
TPA True Price Action indicator reveals the true price action of the market makers through 100% non-repainting signals strictly at the close of a candle! TPA shows entries and re-entries, every time the bulls are definitely stronger than the bears and vice versa. Not to confuse with red/green candles. The shift of power gets confirmed at the earliest stage and is ONE exit strategy of several. There are available now two free parts of the TPA User Guide for our customers. The first "The Basics"
AriX
Temirlan Kdyrkhan
1 (4)
AriX Indicator for MT5 A powerful trend-following and signal-evaluation tool AriX is a custom MT5 indicator that combines Moving Averages and ATR-based risk/reward logic to generate clear buy/sell signals. It visualizes dynamic SL/TP levels, evaluates past trade outcomes, and displays win/loss statistics in a clean on-chart panel. Key features include: Buy/Sell signals based on MA crossovers ATR-based SL/TP1/TP2/TP3 levels with visual lines and labels Signal outcome tracking with real-time stat
Meravith MT5
Ivan Stefanov
5 (1)
Strumento per market maker. Meravith: Analizzerà tutti i timeframe e mostrerà il trend attualmente in corso. Evidenzierà le zone di liquidità (equilibrio dei volumi) dove i volumi rialzisti e ribassisti sono uguali. Mostrerà tutti i livelli di liquidità dei diversi timeframe direttamente sul grafico. Genererà e presenterà un’analisi di mercato testuale a scopo di riferimento. Calcolerà obiettivi, livelli di supporto e punti di stop-loss in base al trend attuale. Calcolerà il rapporto rischio/ren
Innanzitutto, vale la pena sottolineare che questo Strumento di Trading è un Indicatore Non-Ridipingente, Non-Ridisegnante e Non-Laggante, il che lo rende ideale per il trading professionale. Corso online, manuale utente e demo. L'Indicatore Smart Price Action Concepts è uno strumento molto potente sia per i nuovi che per i trader esperti. Racchiude più di 20 utili indicatori in uno solo, combinando idee di trading avanzate come l'Analisi del Trader del Circolo Interno e le Strategie di Tradin
ZIVA Signal Intelligence
Hassan Abdullah Hassan Al Balushi
ZIVA Signal Intelligence An Adaptive, Modular Market Intelligence System ZIVA Signal Intelligence is not positioned as a conventional trading indicator. It is a fully integrated, proprietary market intelligence system engineered to deliver structured, high-precision interpretation of price behavior within a controlled analytical environment. Developed through an independent architectural approach, ZIVA does not rely on, derive from, or replicate existing indicators. It represents a standalone
FX Analysis is an all-in-one MT5 indicator dashboard that combines eight analytical tools in a single panel, helping traders identify high-probability setups without switching between charts or indicators. Designed for standard forex pairs on MetaTrader 5. Best results on M15 - H4 timeframes when all components are used together as part of the included workflow. Components Volatility Analyzer Displays historical average movement by hour and by day of the week. A real-time Pip Balance shows the
Questo indicatore è un indicatore per l'analisi automatica delle onde perfetto per il trading pratico! Caso... Nota:   non sono abituato a usare nomi occidentali per la classificazione delle onde a causa dell'influenza della convenzione di denominazione di Tang Lun (Tang Zhong Shuo Zen), ho chiamato l'onda base come   penna   e la banda dell'onda secondaria come   segmento   At allo stesso tempo, il segmento ha la direzione del trend. La denominazione   è principalmente segmento di trend   (que
Ultimate SMC Indicator
Hicham Mahmoud Almoustafa
1 (1)
Ultimate SMC Indicator v2.20 — Smart Money Concepts All-in-One Stop switching between 5 different indicators. Ultimate SMC gives you everything Smart Money traders need — in one clean indicator with interactive controls. GUIDE What makes this different? Most SMC indicators show you Order Blocks or FVGs separately. You still have to figure out which zones actually matter. Ultimate SMC does the hard work: it scans for Order Blocks, Fair Value Gaps, Liquidity Sweeps, Supply & Demand zones, Fibo
Aiuta a determinare se questo punto è adatto per acquistare. Aiuta a determinare se questo punto è adatto per vendere. Quando tutti e quattro gli indicatori raggiungono contemporaneamente il fondo, occorre concentrarsi sulle opportunità di rimbalzo. Quando tutti e quattro gli indicatori si trovano contemporaneamente nella parte alta, occorre concentrarsi sulle opportunità di ribasso. Questo sistema è costruito sulla base di avanzate tecnologie algoritmiche cinesi e di una struttura di modellazio
Moon Cycle
Navdeep Singh Kaur
Indicatore tecnico che utilizza l'algoritmo astronomico di Jean Meeus per visualizzare le fasi lunari sui grafici di trading. Presenta una linea curva continua che rappresenta il ciclo lunare con precisione scientifica equivalente agli osservatori professionali. Compatibile con qualsiasi simbolo e timeframe su MT5, inclusi forex, commodities, indici e azioni. Include pannello informativo che mostra fase lunare attuale, percentuale di illuminazione e livelli di riferimento per analisi tecnica. I
Ace Trend
Mikhail Sergeev
5 (3)
Ti presentiamo un indicatore rivoluzionario che cambia le regole del gioco nel mondo del trading di tendenza. L'indicatore è progettato per ripensare le prestazioni e portare la tua esperienza di trading a livelli senza precedenti. Il nostro indicatore vanta una combinazione unica di funzionalità all'avanguardia che lo distinguono dalla concorrenza. La tecnologia avanzata "Real Pricing Factors" offre una sostenibilità senza pari anche nelle condizioni di mercato più difficili e volatili. Dì addi
ARIScalping
Temirlan Kdyrkhan
ARIScalp is a powerful trading companion designed to generate high-probability entry signals with dynamic TP/SL/DP levels based on volatility. Built-in performance tracking shows win/loss stats, PP1/PP2 hits, and success rates all updated live. Key Features: Buy/Sell signals with adaptive volatility bands Real-time TP/SL/DP levels based on ATR Built-in MA Filter with optional ATR/StdDev volatility Performance stats panel (Success, Profit/Loss, PP1/PP2) Alerts via popup, sound, push, or email Cus
L'indicatore " Dynamic Scalper System MT5 " è progettato per il metodo di scalping, ovvero per il trading all'interno di onde di trend. Testato sulle principali coppie di valute e sull'oro, è compatibile con altri strumenti di trading. Fornisce segnali per l'apertura di posizioni a breve termine lungo il trend, con ulteriore supporto al movimento dei prezzi. Il principio dell'indicatore. Le frecce grandi determinano la direzione del trend. Un algoritmo per generare segnali per lo scalping sott
L’indicatore evidenzia le zone in cui viene dichiarato interesse sul mercato , per poi mostrare la zona di accumulo degli ordini . Funziona come un book degli ordini su larga scala . Questo è l’indicatore per i grandi capitali . Le sue prestazioni sono eccezionali. Qualsiasi interesse ci sia nel mercato, lo vedrai chiaramente . (Questa è una versione completamente riscritta e automatizzata – non è più necessaria un’analisi manuale.) La velocità di transazione è un indicatore concettualmente nuo
Range Cycle Indicator. Gives signal on price range cycling smoothed by moving average. It is better to use it on H1+ timeframes and avoid side markets. Because if market is flat this indicator will give too many zero profit or even losing signals. Parameters: PopUpAlert - to allow it to alert when trend changes; EMailAlert - for email alerts; period - this is a smoothing criteria, use higher values on lower timeframes; TimeFrame(new) - higher timeframe (or the same) to use for calculation, defa
BookMap HeatMap
Roberto Spadim
1 (2)
This Indicator creates a heatmap based on depth of market of the current symbol or another symbol. Other symbol is useful when you trade futures market and a contract has 'mini' and 'full' split. For example, in Brazil (B3 - BMF&Bovespa), WDO and DOL are future Forex contract of BRL/USD (where 1 DOL = 5 WDO) and big banks work mostly with DOL (where liquidity is important). Please use with M1 timeframe , objects are too small to be displayed at higher timeframes (MT5 limit). The number of level
TrendMaestro5
Stefano Frisetti
Attenzione alle truffe, questo indicatore e' distribuito esclusivamente su MQL5.com nota: questo indicatore e' per METATRADER5, se vuoi la versione per  METATRADER4 questo e' il link:   https://www.mql5.com/it/market/product/108106 TRENDMAESTRO ver 2.5 TRENDMAESTRO   riconosce un nuovo TREND sul nascere, non sbaglia mai. La sicurezza di identificare un nuovo TREND non ha prezzo. DESCRIZIONE TRENDMAESTRO identifica un nuovo TREND sul nascere, questo indicatore prende in esame la volatilita' i
**Triple Crox Strategy - Professional Trading System** **Overview** Triple Crox Strategy is an advanced technical indicator for MetaTrader 5 that combines multiple analysis methods to provide precise trading signals. Designed for serious traders, this indicator integrates multiple strategies based on moving averages, ATR, RSI, and cloud settings to identify market opportunities with high reliability. **Main Configuration** **Setup Types** *   **Setup Open/Close:** Based on Heikin Ash
Weis Wave with Alert MT5
Trade The Volume Waves Single Member P.C.
4.94 (17)
Rental/Lifetime Package Options and Privileges  Rent Monthly Six Months   Yearly/Lifetime Weis Wave with Speed with Alert+Speed Index x x x Manual  x x x Quick Set up Video x x x Blog x x x Lifetime Updates x x x Setup and Training Material x x Discord Access Channel "The SI traders"          x Rectangle Break Alert Tool      x How to trade with it:    http://www.tradethevolumewaves.com   ** If you purchase please contact me to setup your  : Training Room and  complete manual access.  Wei
Owl Smart Levels MT5
Sergey Ermolov
4.03 (32)
Quando si opera seguendo il trend, la difficoltà principale non è trovare un livello, ma capire dove un ingresso è realmente valido. Il prezzo spesso reagisce ai livelli, ma non riesce a proseguire il movimento — il che porta a ingressi falsi o opportunità perse. Owl Smart Levels non si limita a mostrare livelli , ma evidenzia zone basate sulla struttura di mercato e sui pullback. Questo consente di valutare i punti di ingresso in modo diverso ed evitare una parte dei segnali falsi. Cosa includ
Orderflow Scalp Pro v2.4   delivers institutional-grade trading intelligence through advanced volume analysis, dynamic VWAP calculations, real-time aggressive score monitoring, and precision arrow signals. This complete trading system transforms complex market data into clear, actionable signals for consistent profitability on 3-4 minute timeframes. Full Documentation: [Download PDF] Four Powerful Components in One System Volume Profile HeatMap with POC/VAH/VAL Transform your charts into inst
Red and Green Light – Intelligent Trading Signal Indicator Product Overview Red and Green Light is a professional trading signal indicator based on the multi-stage T3 smoothing algorithm. It integrates a visual traffic light system, intelligent signal recognition, risk alerts, and multiple notification features. Whether you're a manual trader or an Expert Advisor (EA) developer, this indicator helps you capture market opportunities with greater precision and effectively avoid the risks of
TickChart Indicator plots tick line on the main window of MetaTrader. ( Free version of this is "TickChart Indicator Lite" ) The tick-line shows the most detailed, fastest and real-time activities of the market, which are usually hidden in bars or candles longer than 1 minute. Usually, several new tick-line segments appear while a bar of M1 time frame is completed. After the release of an important economic indicator, the number of ticks per bar may exceeds 100. This indicator overlays the tick
MetaForecast M5
Vahidreza Heidar Gholami
5 (3)
MetaForecast predice e visualizza il futuro di qualsiasi mercato basandosi sull'armonia dei dati dei prezzi. Sebbene il mercato non sia sempre prevedibile, se esiste un modello nei prezzi, MetaForecast può prevedere il futuro con la massima precisione possibile. Rispetto ad altri prodotti simili, MetaForecast può generare risultati più accurati analizzando le tendenze di mercato. Parametri di input Past size (Dimensione passata) Specifica il numero di barre che MetaForecast utilizza per creare
Altri dall’autore
Adaptive Volatility Range (AVR) is a powerful tool for identifying key trend reversals. AVR accurately reflects the Average True Range (ATR) of volatility, taking into account the Volume-Weighted Average Price (VWAP). The indicator adapts to any market volatility by calculating the average volatility over a specified period. This ensures a stable performance with a positive trade outcome. Advantages of the AVR Indicator: 100% No Repaint –  All lines and signal arrows are formed in real time
Reversal Pattern AI — an absolute breakthrough in the world of indicator development, combining artificial intelligence algorithms, multi-level market analysis, and classical methods of technical analysis. It not only detects reversal patterns but also evaluates market inefficiencies, generating highly accurate trading signals. Thanks to a hybrid model that uses price action analysis, Volumes, Volatility, VWAP, and Volume AVG %, the indicator easily adapts to any market conditions.              
Adaptive Volatility Range [AVR] is a powerful tool for identifying key trend reversal points. AVR accurately reflects the Average True Range (ATR) of volatility, taking into account the Volume-Weighted Average Price (VWAP). The indicator adapts to any market volatility by calculating the average volatility over a specific period, ensuring a stable rate of profitable trades. You receive not just an indicator but a professional automated trading system , AVR-EA . Advantages: 100% No Repaint –
Cumulative Delta Pro
Stanislav Konin
5 (1)
Cumulative Delta Pro is a professional indicator that takes market order flow analysis to a fundamentally new level. Cumulative Delta is the difference between buying and selling volumes, presented as a continuous cumulative sum over a specific period of time starting from the initial calculation point. This metric allows traders to see in real time who controls the market: if the positive delta increases, it indicates the dominance of active buyers; if the negative delta decreases, sellers are
Sniper Delta Imbalance is a professional tool for deep delta analysis — the difference between buyer and seller volumes. It takes volume analysis to the next level, allowing traders to see in real time who controls the price — buyers or sellers — and to find precise entry points based on the actions of major market participants. This tool represents a unique style of analysis based on the ratio of demand and supply volumes and can be used to detect who holds control over price. At the core o
Reversal Zones Pro is an indicator specifically designed to accurately identify key trend reversal zones. It calculates the average true range of price movement from the lower to upper boundaries and visually displays potential zones directly on the chart, helping traders effectively identify important trend reversal points. Key Features: Reversal Zone Identification: The indicator visually displays potential reversal zones directly on the chart. This helps traders effectively identify importan
Gold Prop Firm   is a professional indicator specifically designed for trading gold (XAUUSD). It automatically identifies price consolidation ranges—key liquidity accumulation zones where potential breakouts are most likely to occur. The algorithm creates a   Breakout Box   around these areas, analyzes volume distribution, and determines   trigger strength . When the boundaries of the range are breached, the indicator generates clear trading signals in the form of arrows. Gold Prop Firm   is su
Gold Scalper System  is a multifunctional trading system that combines a breakout strategy for key liquidity levels with confirmation and a built-in Smart DOM Pro module for market depth analysis. The system identifies zones of limit order accumulation, tracks activity at support and resistance levels, and generates signals at the moment of their breakout. Smart DOM Pro visualizes Bid/Ask volumes, identifies liquidity clusters, and helps determine the intentions of major market participants. G
Reversal Pattern AI
Stanislav Konin
5 (1)
Reversal Pattern AI is a groundbreaking advancement in indicator development, combining artificial intelligence algorithms, multi-level market analysis, and classical technical analysis methods. It not only detects reversal patterns but also evaluates market inefficiencies, generating highly accurate trading signals.Thanks to its hybrid model, which utilizes price action analysis, volume, volatility, VWAP, and Volume AVG %, the indicator easily adapts to any market conditions. Reversal Pattern A
Ultimate Volatility Insight is a highly professional tool for analyzing and fully understanding market activity based on an advanced ATR with improved algorithms and calculation formulas. The indicator helps traders accurately assess market dynamics, identify key support and resistance levels, and effectively manage risks. Ultimate Volatility Insight works only with real data using live statistics. The indicator has been developed for over two years, and its effectiveness has been proven through
Gold Scalper System  is a multifunctional trading system that combines a breakout strategy for key liquidity levels with confirmation and a built-in Smart DOM Pro module for market depth analysis. The system identifies zones of limit order accumulation, tracks activity at support and resistance levels, and generates signals at the moment of their breakout. Smart DOM Pro visualizes Bid/Ask volumes, identifies liquidity clusters, and helps determine the intentions of major market participants. G
Cumulative Delta Pro   is a professional indicator that takes market order flow analysis to a fundamentally new level. Cumulative Delta   is the difference between buying and selling volumes, presented as a continuous cumulative sum over a specific period of time starting from the initial calculation point. This metric allows traders to see in real time who controls the market: if the positive delta increases, it indicates the dominance of active buyers; if the negative delta decreases, sellers
Quantum Profile System is a fully-fledged professional trading system with advanced algorithms, combining everything needed for confident and stable trading. This indicator merges trend direction analysis, volume concentration at key levels, dynamic adaptation to market volatility, and generation of trading signals with no delay or repainting. Quantum Profile System integrates a Linear Regression Volume Profile with an adaptive ATR-based trend channel. It includes an extended Volume Profile modu
Gold Prop Firm MT 5
Stanislav Konin
5 (1)
Gold Prop Firm   is a professional indicator specifically designed for trading gold (XAUUSD). It automatically identifies price consolidation ranges—key liquidity accumulation zones where potential breakouts are most likely to occur. The algorithm creates a   Breakout Box   around these areas, analyzes volume distribution, and determines   trigger strength . When the boundaries of the range are breached, the indicator generates clear trading signals in the form of arrows. Gold Prop Firm   is su
Please contact me after your full purchase for great bonuses.                                     Adaptive Reversal Star Expert Advisor and an additional indicator as a gift Info Panel are waiting for you. Adaptive Reversal Star is a new generation indicator with an advanced Adaptive algorithm , which additionally tracks potential reversal points and compares the values of the current market volatility when forming the main signals
Reversal Zones Pro – an indicator specifically designed for accurately identifying key trend reversal zones. It calculates the average true range of price movement from lower to upper boundaries and visually displays potential reversal zones directly on the chart, helping traders efficiently pinpoint crucial turning points in the market. Key Features: Reversal Zone Identification: The indicator visually highlights potential reversal zones directly on the chart, enabling traders to effectively id
Patriot EA
Stanislav Konin
Patriot EA is an advanced mesh system with improved performance. Patriot EA uses sophisticated technology to effectively manage unprofitable positions. When a losing series of orders occurs, an algorithm for closing unprofitable positions is activated. The Expert Advisor divides orders into several independent grids, closing the long-range (unprofitable) order by sequentially averaging part of the orders with a given Take Profit. A series of orders can be divided into several mixed series with
Volume PRO is an innovative and modernized indicator for analyzing trading volumes, which is an advanced version of traditional analysis tools. This high-tech indicator allows traders to effectively monitor trading activity without the need for complex calculations. It displays ticks for the selected time interval corresponding to the selected time frame in the form of a dynamic cumulative histogram, which is updated in real time as new trades are received. Key features: Innovative volume analys
Block Master Pro
Stanislav Konin
5 (3)
The Block Master Pro indicator is designed to visually identify areas on the chart where significant volumes from major market participants are likely concentrated. These areas, known as order blocks, represent price ranges where large players place their orders, potentially signaling a price reversal and movement in the opposite direction. Key Features: Order Block Identification: Block Master Pro effectively identifies order blocks by pinpointing price ranges where large orders are placed. Th
Advanced Reversal Hunter Pro (ARH) is a powerful, innovative volatility-based momentum indicator designed to accurately identify key trend reversals. Developed using a special algorithm that provides a clear construction of the average volatility range, without redrawing its values ​​and does not change them. The indicator adapts to any market volatility and dynamically adjusts the width of the band range, depending on current market conditions. Indicator advantages: Advanced Reversal Hunter Pro
Scalper Inside Volume Pro is a professional trading system that combines multiple indicators to calculate an overall composite signal. It is based on an algorithm focused on volume, the Money Flow Index, and the Smart Money concept. The indicator takes into account structural Swing points where price reversals occur. Scalper Inside Volume Pro provides all the necessary tools for successful scalping. This comprehensive trading system is suitable for traders in the Forex market as well as for use
The Bull and Bear Zones indicator is specifically designed for the automatic identification and visual display of support and resistance zones directly on the chart. Its unique algorithm allows it to display not only the zones already tested by the market but also potential target zones that have yet to be tested. The indicator tracks ranges where an imbalance between supply and demand is observed. Key Features: Automatic identification of support and resistance zones : The indicator calculates
Golden Trend Pulse
Stanislav Konin
5 (1)
Golden Trend Pulse — trend indicator developed specifically for Gold, also applicable to the Cryptocurrency and Stock markets. The indicator is designed for precise determination of market trends using advanced analytical methods. The tool combines multifactor analysis of price dynamics and adaptive filtering of market noise, ensuring high accuracy in identifying key entry and exit points. Thanks to its intelligent system, the indicator effectively handles market variability, minimizing false s
Adaptive Reversal Star   is a new generation indicator with an   advanced Adaptive algorithm , which additionally tracks potential reversal points and compares the values of the current market volatility when forming the main signals of the indicator.It provides accurate signals in real time without delays and redraws.Adaptive Reversal Star does not require any complex settings and additional calculations, just set it to the desired timeframe and select the parameter - Signal Filter. Why choose
Golden Trend Pulse   — trend indicator developed specifically for Gold, also applicable to the Cryptocurrency and Stock markets. The indicator is designed for precise determination of market trends using advanced analytical methods. The tool combines multifactor analysis of price dynamics and adaptive filtering of market noise, ensuring high accuracy in identifying key entry and exit points. Thanks to its intelligent system, the indicator effectively handles market variability, minimizing false
Filtro:
Nessuna recensione
Rispondi alla recensione