Modern Interactive Dashboard MIDASH
- Utilità
- Versione: 1.0
- Attivazioni: 10

MIDASH - The Ultimate Dashboard for MetaTrader 5
Transform your MT5 platform into a truly professional analytical terminal!
MIDASH (Modern Interactive Dashboard) is an ultra-modern, visual utility designed for demanding traders who want to understand, analyze, and optimize their performance without ever leaving their chart.
Forget tedious exports to Excel or MyFxBook. MIDASH analyzes your entire trading history and gives you a panoramic, detailed view of your statistics, all within a beautiful, seamless, and fully scrollable interface.
KEY FEATURES
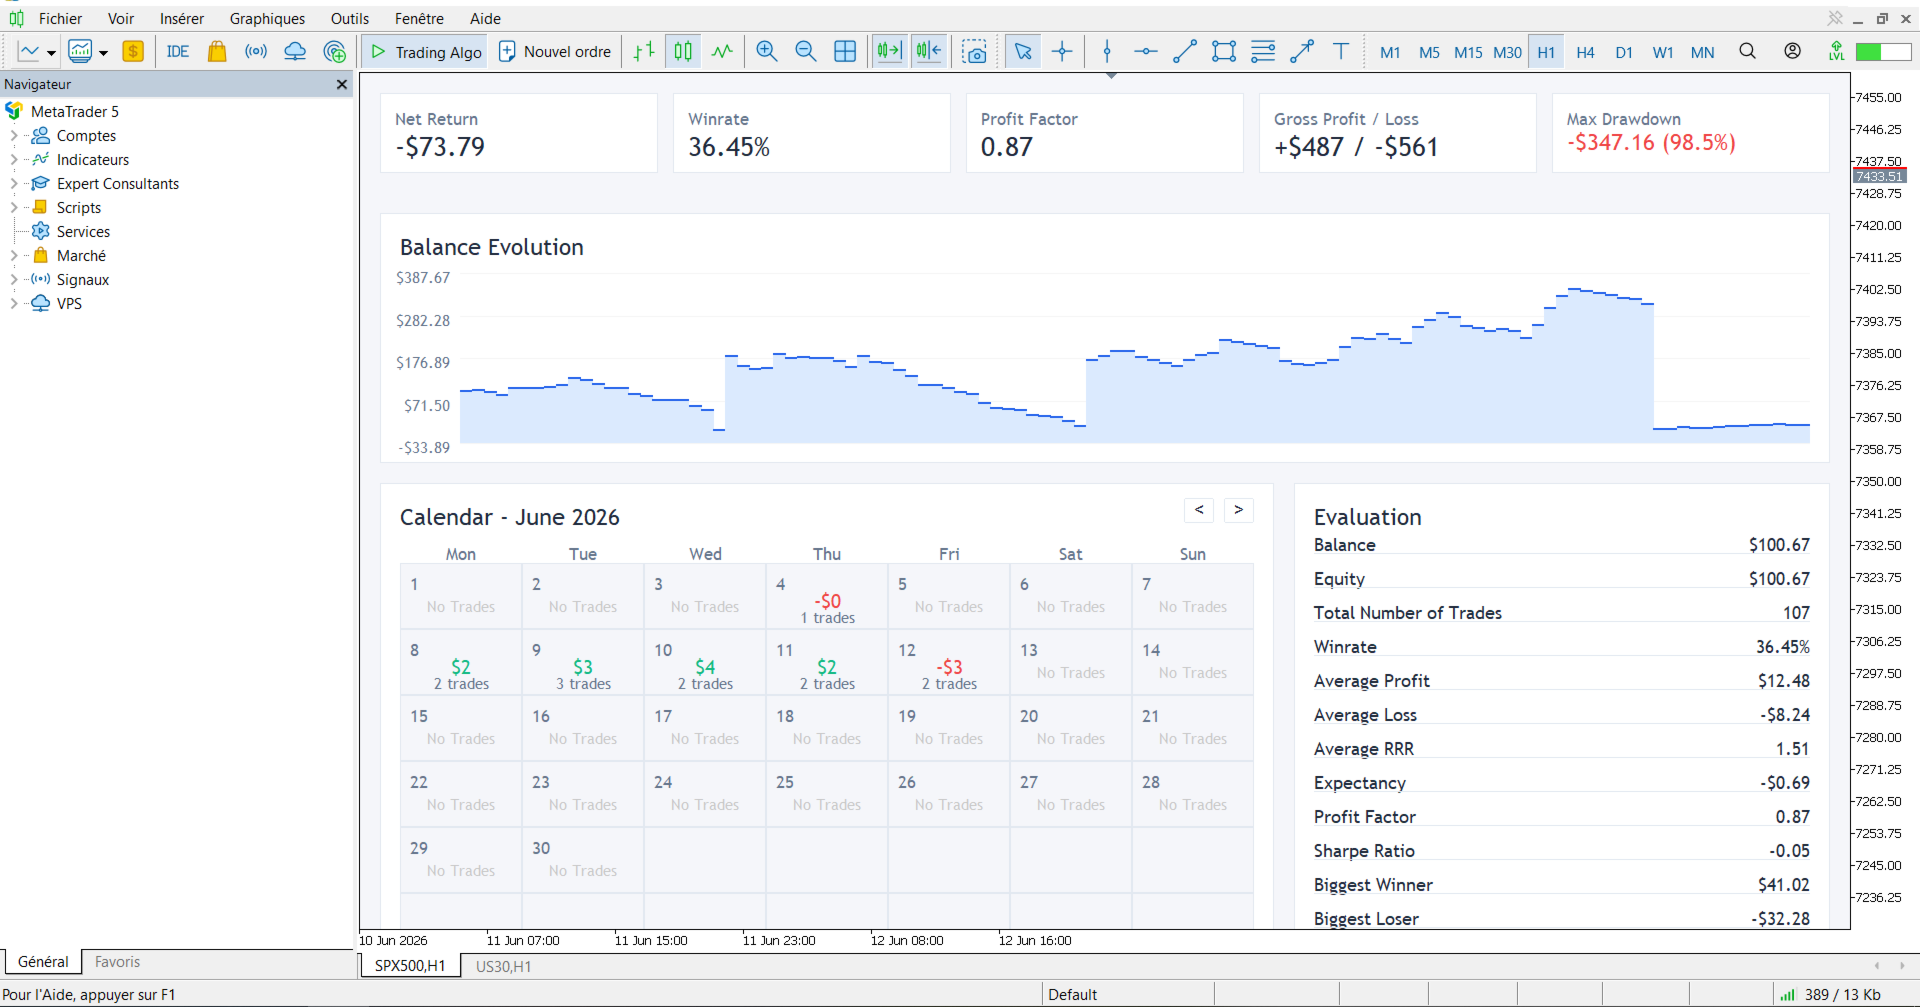
Top Cards - Your Key Metrics at a Glance
Track your overall performance with precision: Net Return, Winrate, Profit Factor, Gross Profit/Loss, and your **Max Drawdown (in both absolute value and percentage)**.
Balance Evolution Curve (Area Chart)
A stunning equity curve (Area Chart) covering your entire account history. Hover over the curve with your mouse to see the exact evolution of your balance, trade by trade!
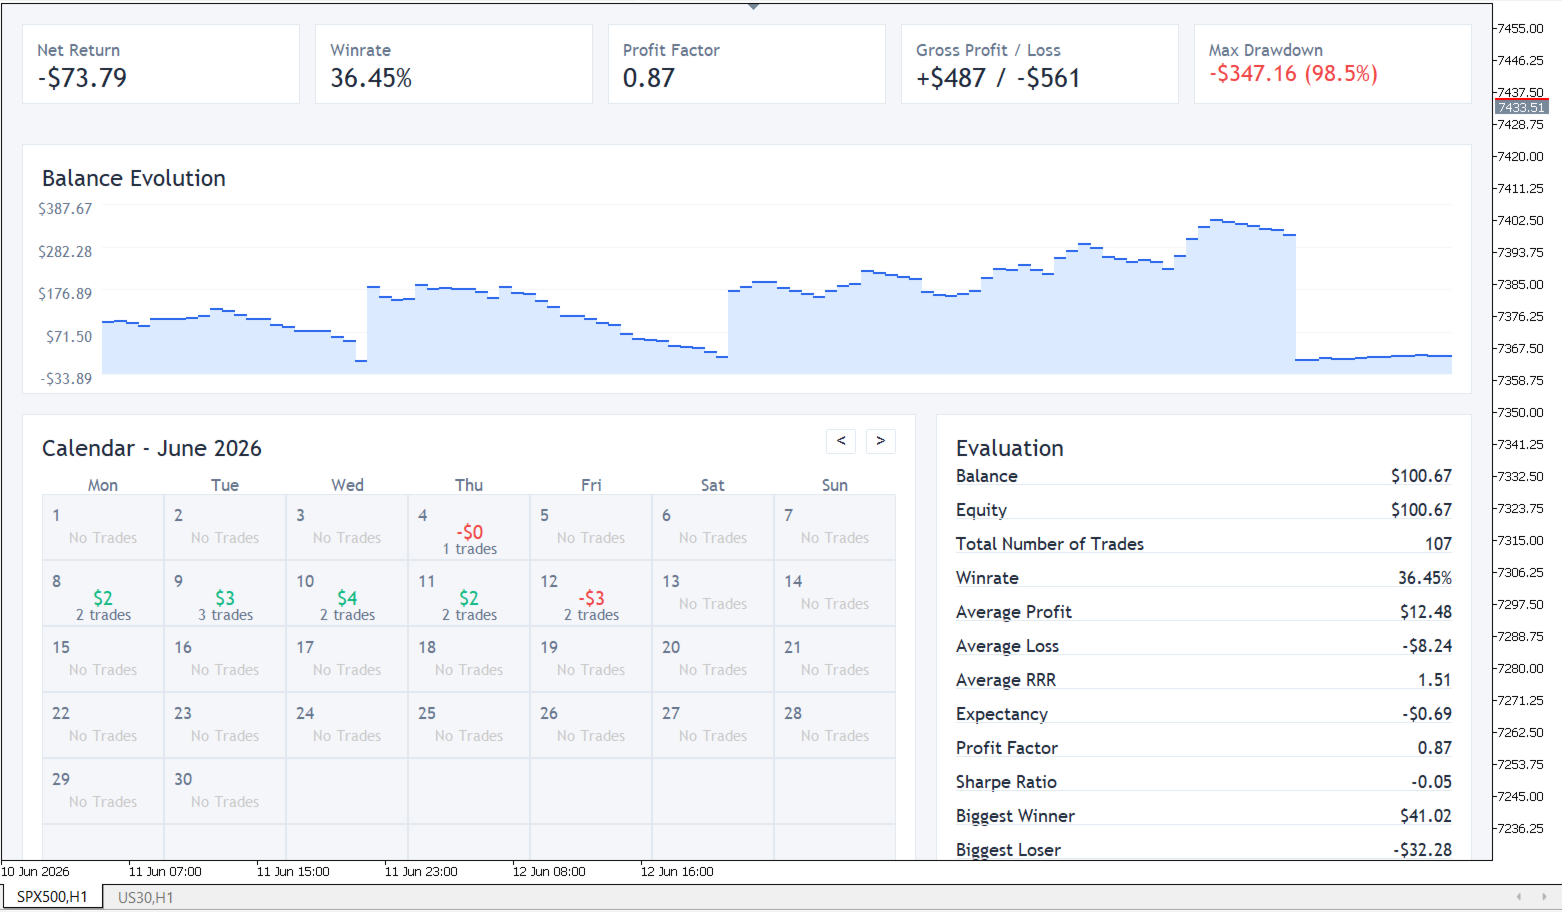
Interactive Monthly Calendar
A comprehensive visual calendar! Navigate from month to month and instantly discover which days you performed best. Each cell displays the daily PnL and the number of executed trades. Winning days are highlighted in green, losing days in red.
Advanced Evaluation (12 Pro Metrics)
Dive into the mathematical details of your trading: Average Profit, Average Loss, Risk Reward Ratio (RRR), Expectancy, Sharpe Ratio, Worst Trade, Best Trade, and much more.
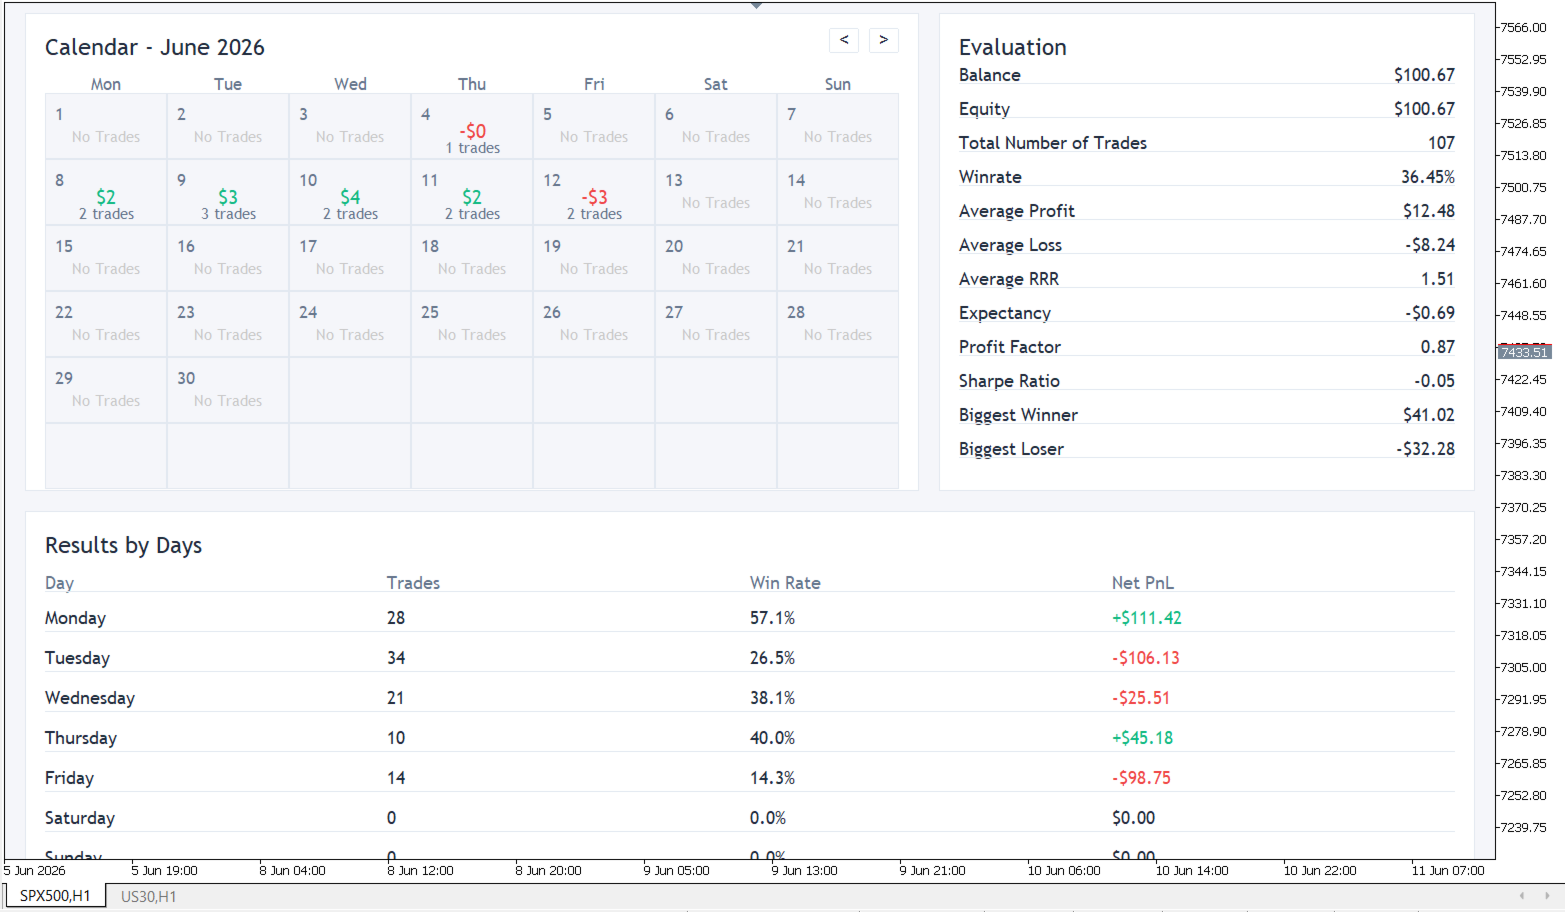
Results by Days (Day of the Week Analysis)
What is your best day to trade? Monday? Thursday? This block analyzes your performance by day of the week (Number of Trades, Win Rate, Net PnL) to help you optimize your schedule and avoid your statistically worst days.
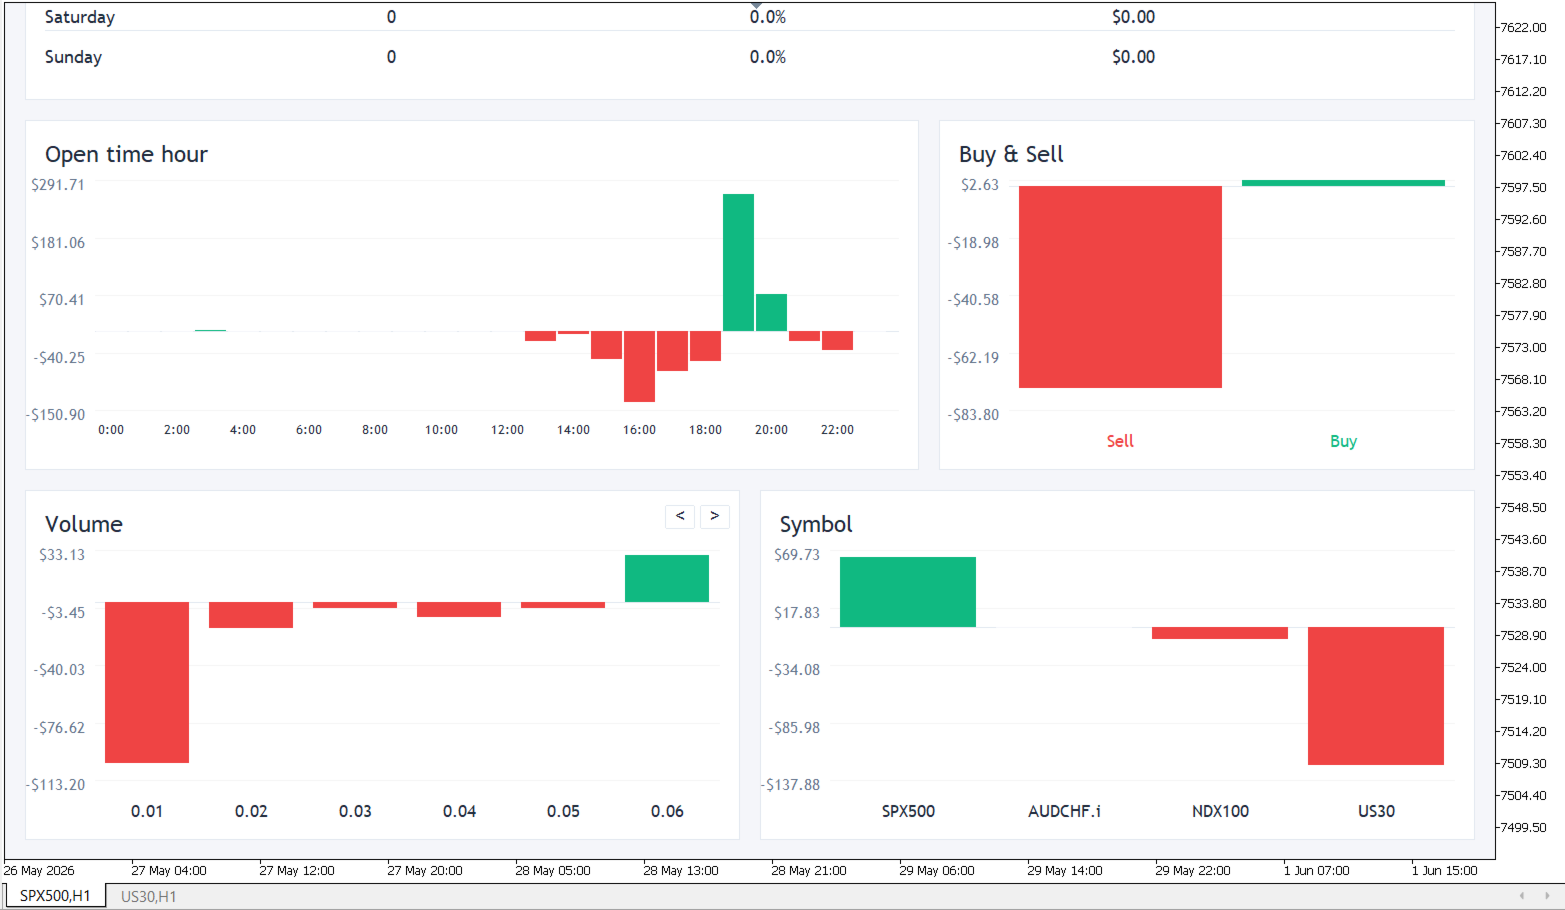
Dynamic Bar Charts (Analytics)
Three professional charts to dissect your results:
- Profit by Symbol: Which assets make you the most money? (Scroll through them if you trade many symbols!)
- Profit by Hour: What time of day are you most profitable? Perfect for targeting your trading sessions (London, New York, Asia).
- Profit by Volume: Which lot size works best for your strategy?
WHY CHOOSE MIDASH?
✅ 100% Native MT5, Zero DLLs: The dashboard is coded cleanly and optimally. No external files required; your platform remains fast and secure.
✅ Premium & Modern Design: A clean, "Light Theme", spacious and professional interface, inspired by the best modern web analytics tools.
✅ Optimized Performance: A smart sub-sampling algorithm ensures that even if you have 10,000 trades in your history, the dashboard will render instantly without lagging your MetaTrader.
✅ Unique User Experience (UX): Use your mouse wheel to scroll up and down through the dashboard just like you would on a web page!
INSTALLATION AND USAGE INSTRUCTIONS
- Drag and drop the MIDASH Expert Advisor onto any chart.
- Ensure your MetaTrader 5 "History" tab is set to "All History" (or the specific period you wish to analyze).
- The Dashboard will appear and update automatically! Use your mouse wheel to scroll down and explore all your statistics.
- Use the `<` and `>` buttons to navigate through the calendar or scroll through the charts if you trade a large number of symbols.
Take control of your statistics. Identify your strengths, fix your weaknesses, and become a disciplined, data-driven trader.
Get MIDASH today and give your MT5 the dashboard it deserves!