MACD Ultimate MTF
- Indicatori
-
Hoai Nam Trinh
 INIZIA DA QUI - MAPPA DEGLI STRUMENTI GOLD ALGO LAB
Non sai quale strumento MT5 si adatta meglio al tuo processo di trading su XAUUSD? - Versione: 1.10
- Aggiornato: 29 maggio 2026
| After downloading, message me via MQL5 inbox to receive your FREE User Kit - setup guide, practical checklist, and workflow resources built specifically for XAUUSD traders. |
|---|
Most MACD crossovers on a five-minute or fifteen-minute gold chart mean nothing on their own. The signal fires, price moves a few points, then reverses. What looks like momentum on the lower timeframe is often just noise against a higher-timeframe structure that was never in agreement.
After years of reading XAUUSD intraday, that pattern becomes obvious. The problem is not the MACD itself. The problem is reading it in isolation, on one timeframe, without any awareness of the broader momentum picture.
MACD Ultimate MTF Free was built around that specific frustration.
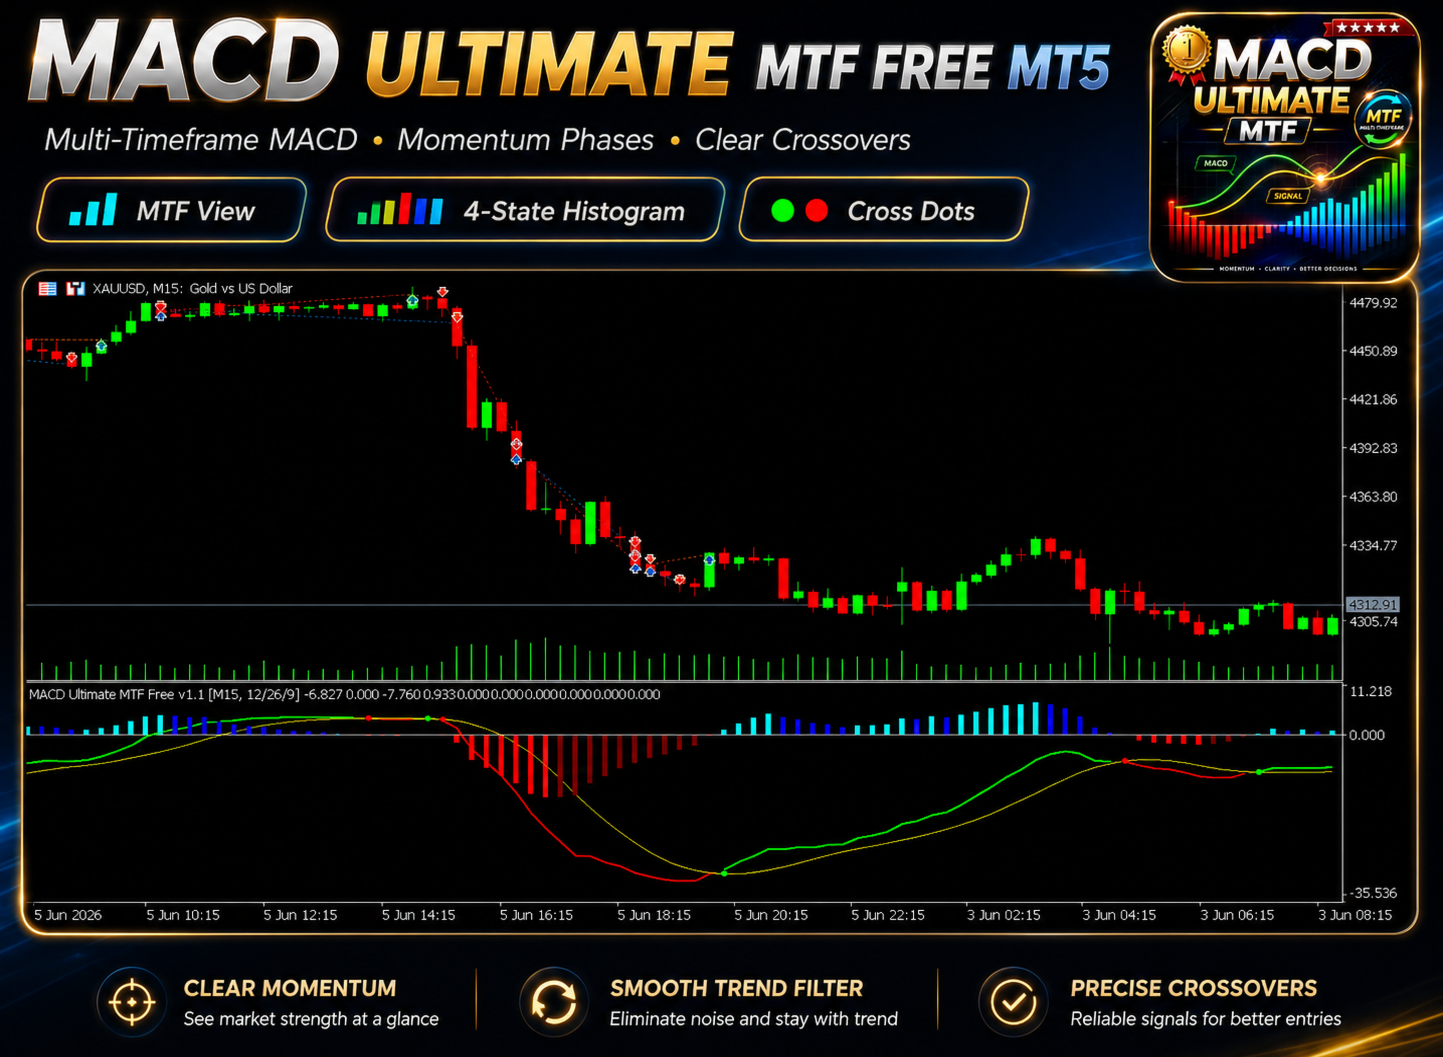
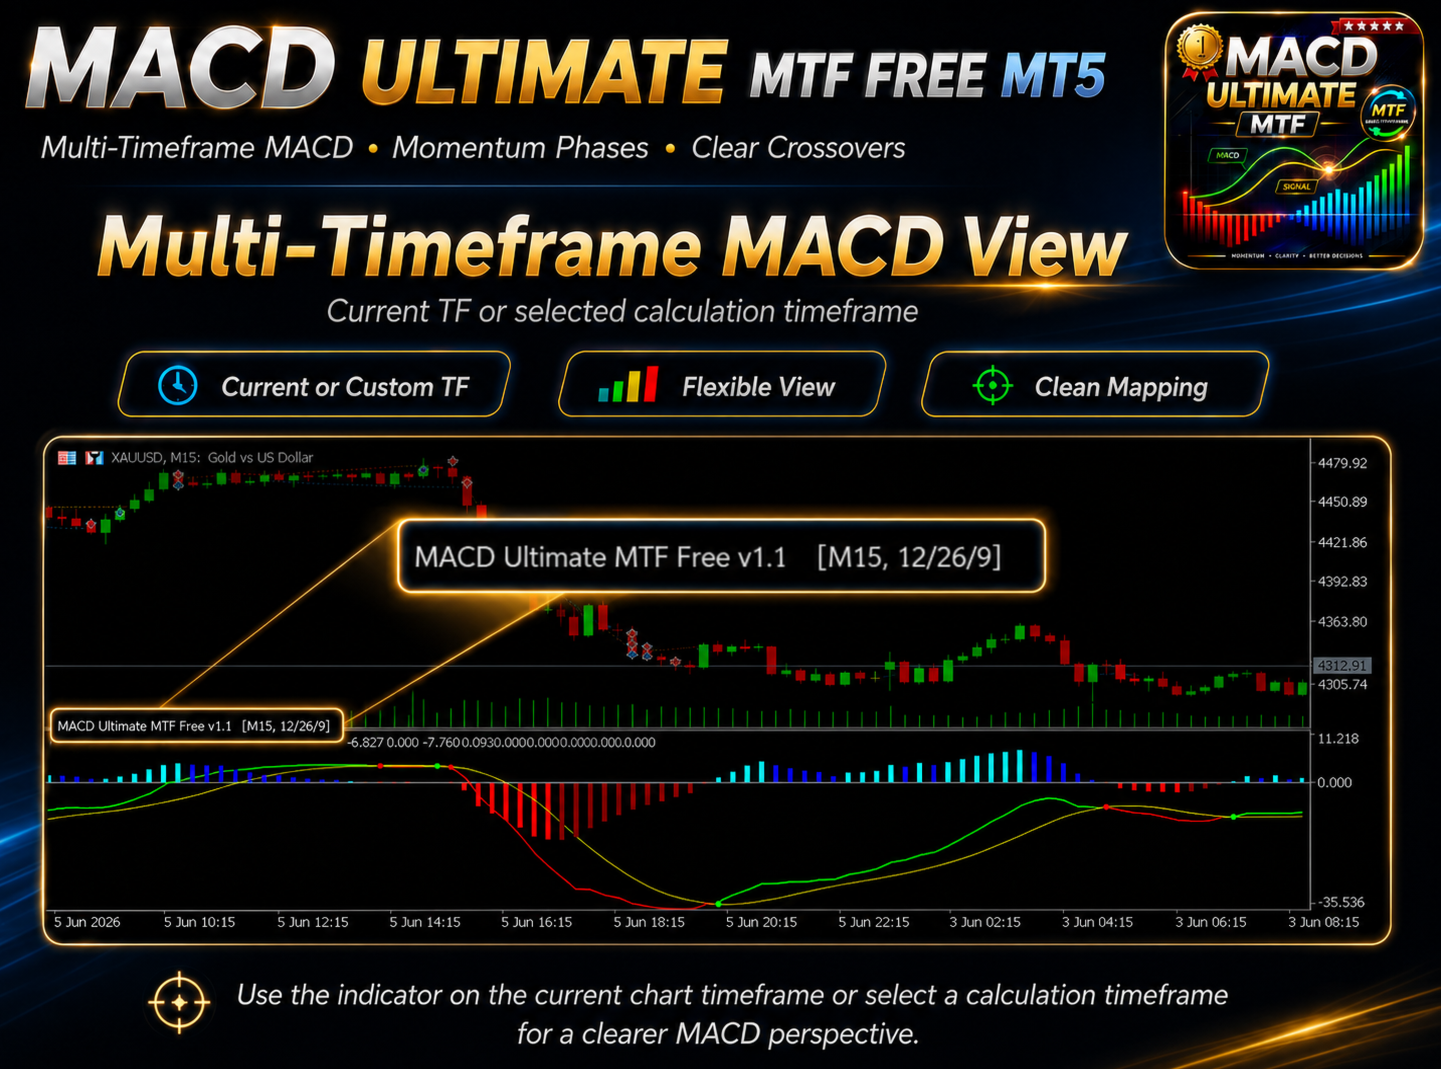
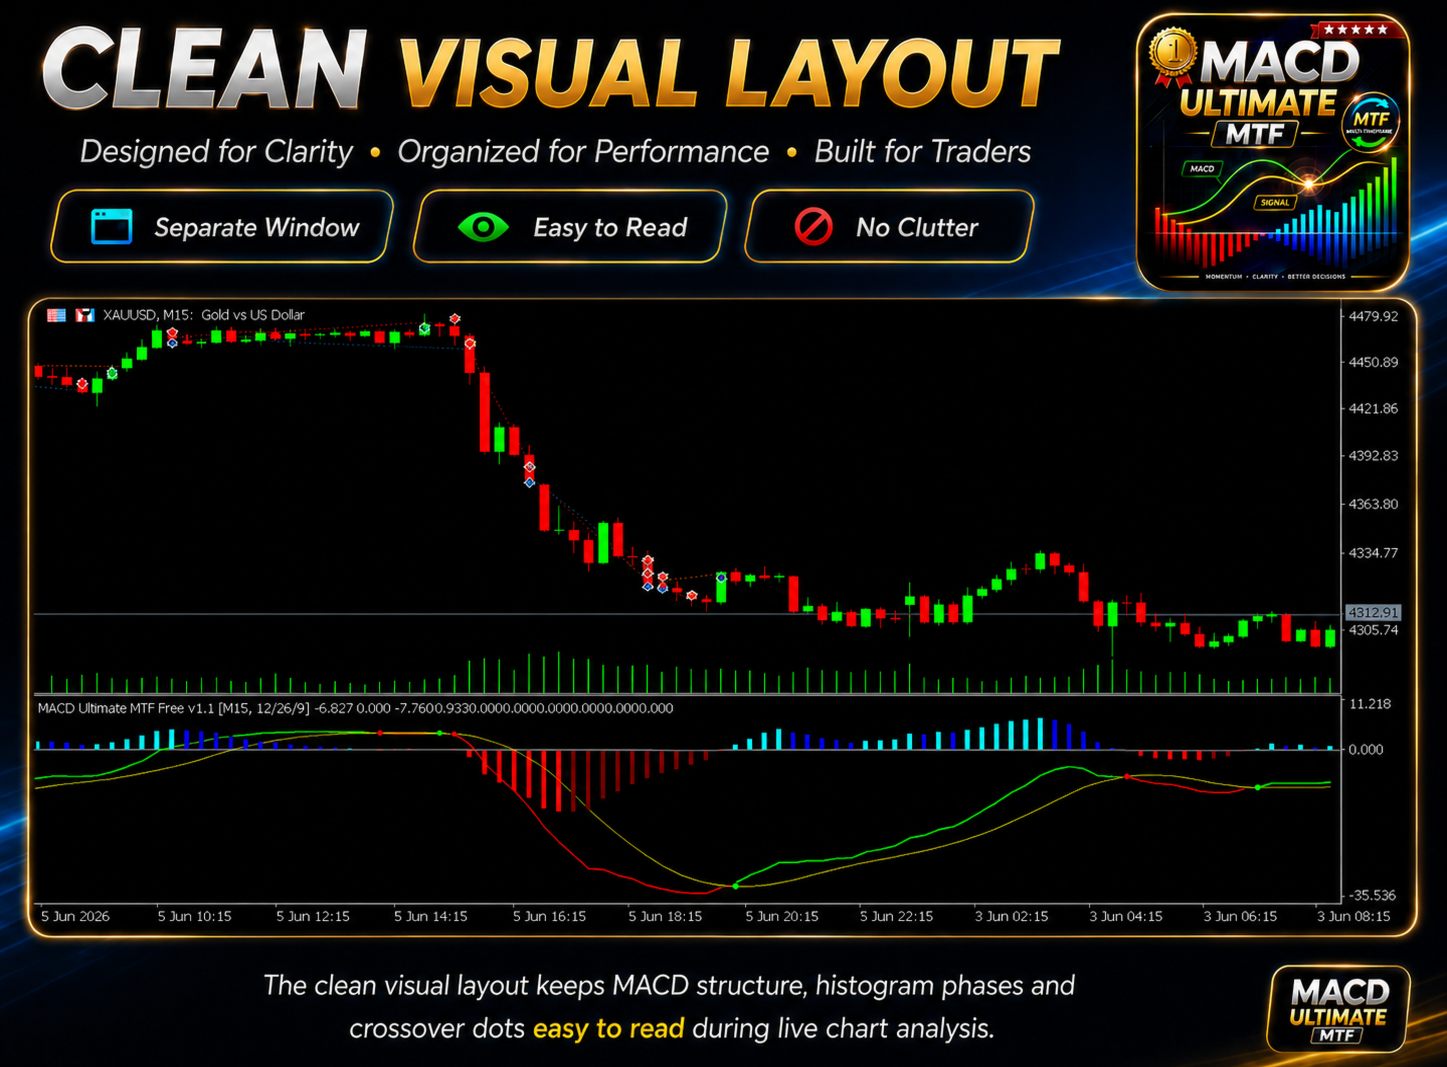
It lets you calculate MACD from a selected higher timeframe while the display stays clean in a separate indicator window below the chart. You see the same histogram phases, the same signal crossovers, but grounded in a timeframe that actually carries weight. The M5 chart shows you where price is moving. The H1 MACD shows you whether that move has any real backing behind it.
No panel. No dashboard clutter. No trade execution. Just a cleaner read of momentum structure.
What the Indicator Shows
The core display is a standard MACD setup with a few visual layers added on top.
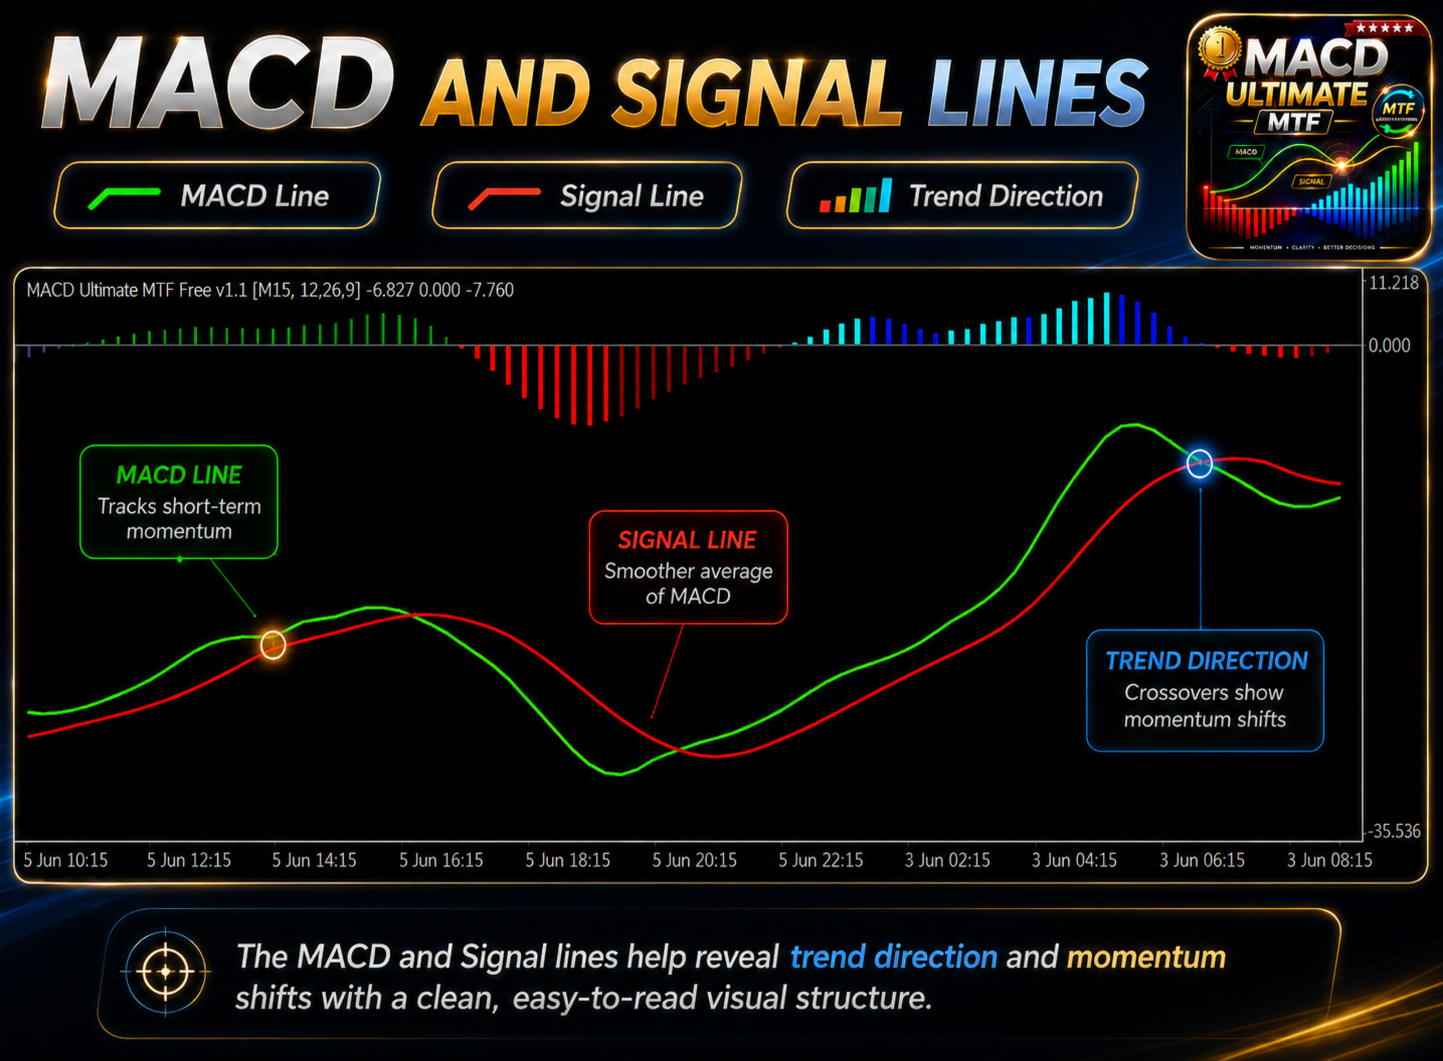
The MACD line is calculated as Fast EMA minus Slow EMA. The Signal line is an SMA of the MACD. The histogram is the difference between them. What is not standard is how those elements are presented.
The MACD line changes color based on its relationship with the Signal line. When MACD is above Signal, it draws green. When below, it draws red. This removes the need to constantly check line positions and makes trend state readable at a glance.
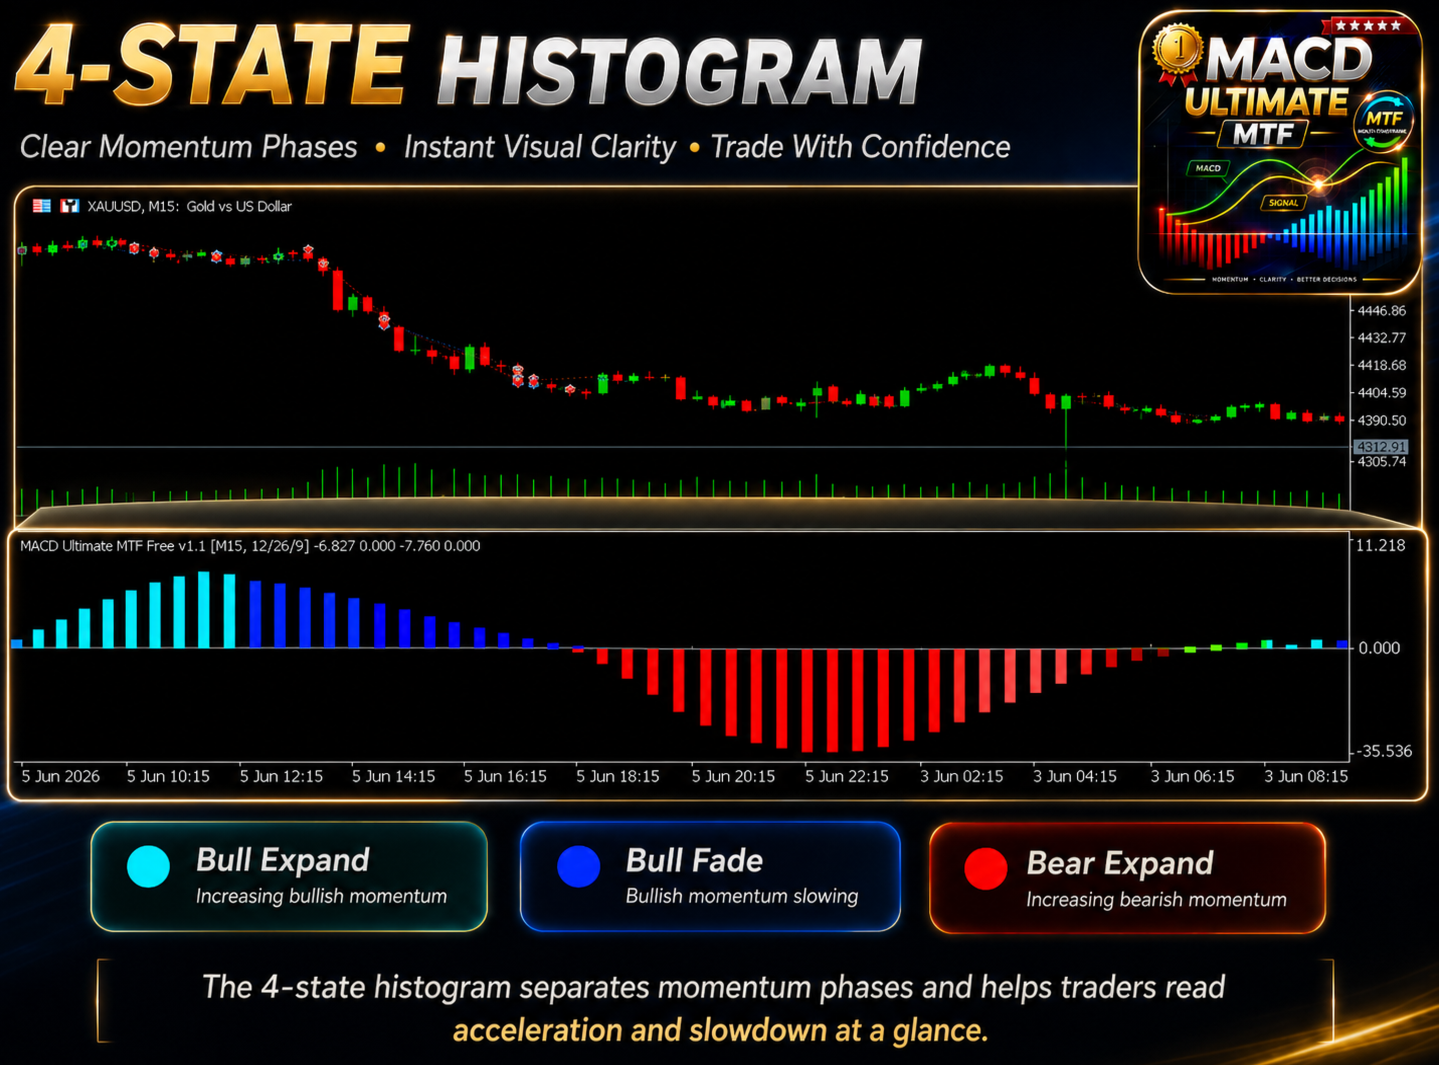
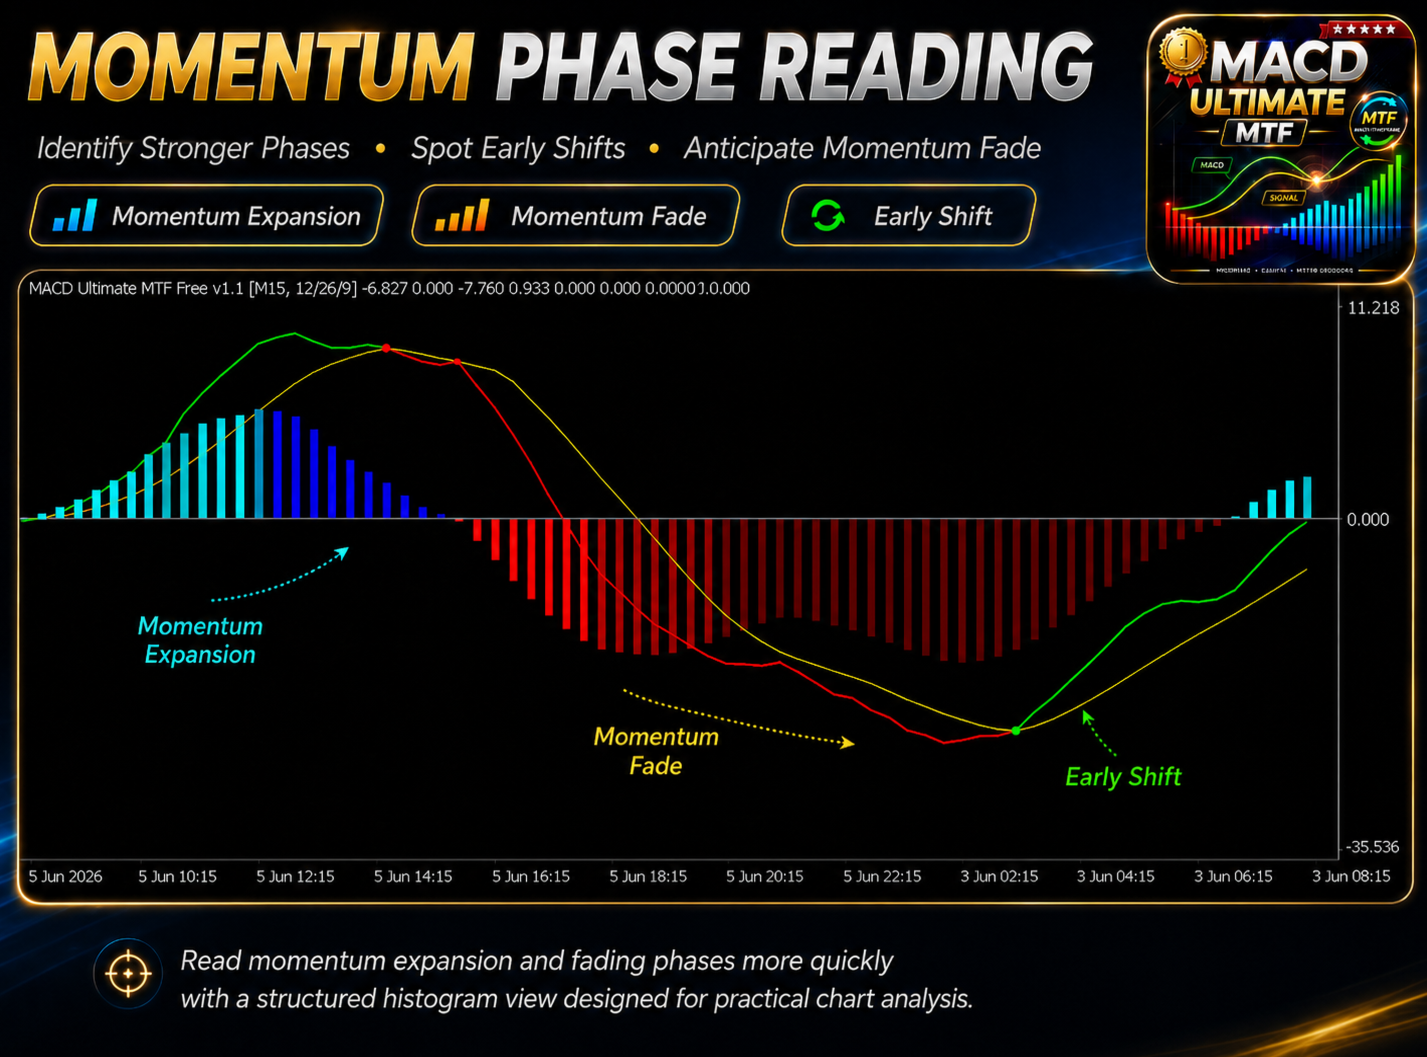
The histogram is split into four distinct phases rather than just positive and negative. Each phase has its own color, so you can see at a glance whether bullish momentum is expanding or starting to fade, and whether bearish pressure is building or losing steam. The four phases are:
Bullish momentum expanding - histogram above zero and rising. The move is still building.
Bullish momentum fading - histogram above zero but falling. The move is losing energy.
Bearish momentum expanding - histogram below zero and falling. Selling pressure is increasing.
Bearish momentum fading - histogram below zero but rising. Bearish pressure is easing.
Reading these phases takes about two seconds once you are used to them. A bearish crossover that appears while the histogram is already in the fading phase reads very differently from one where the histogram is still expanding.
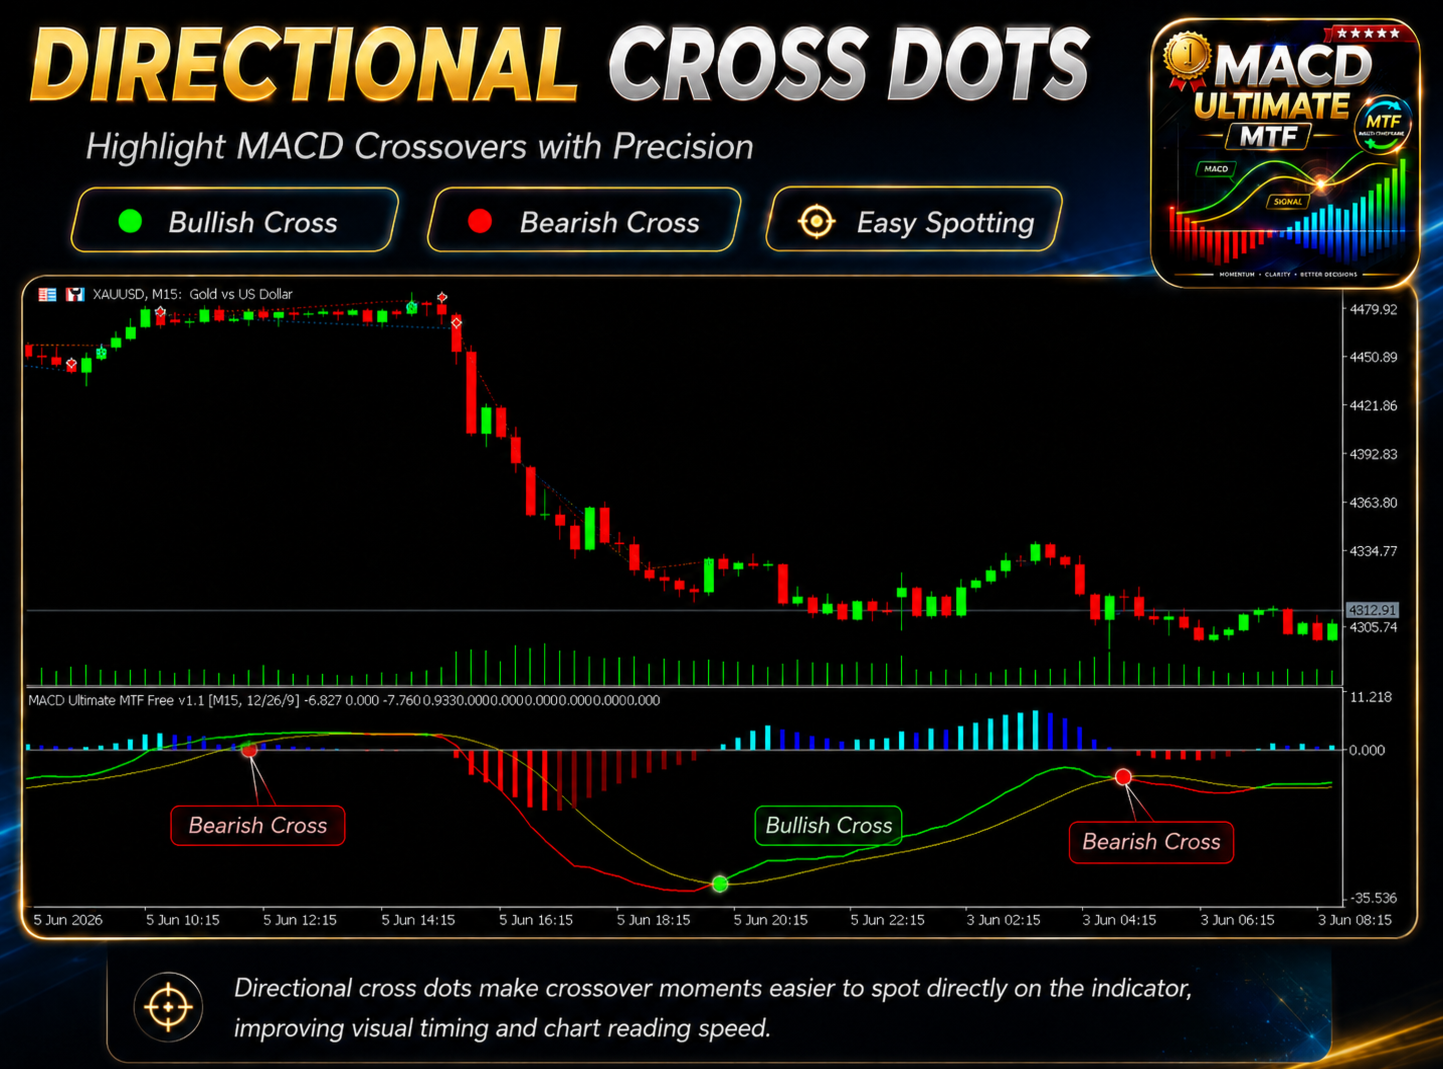
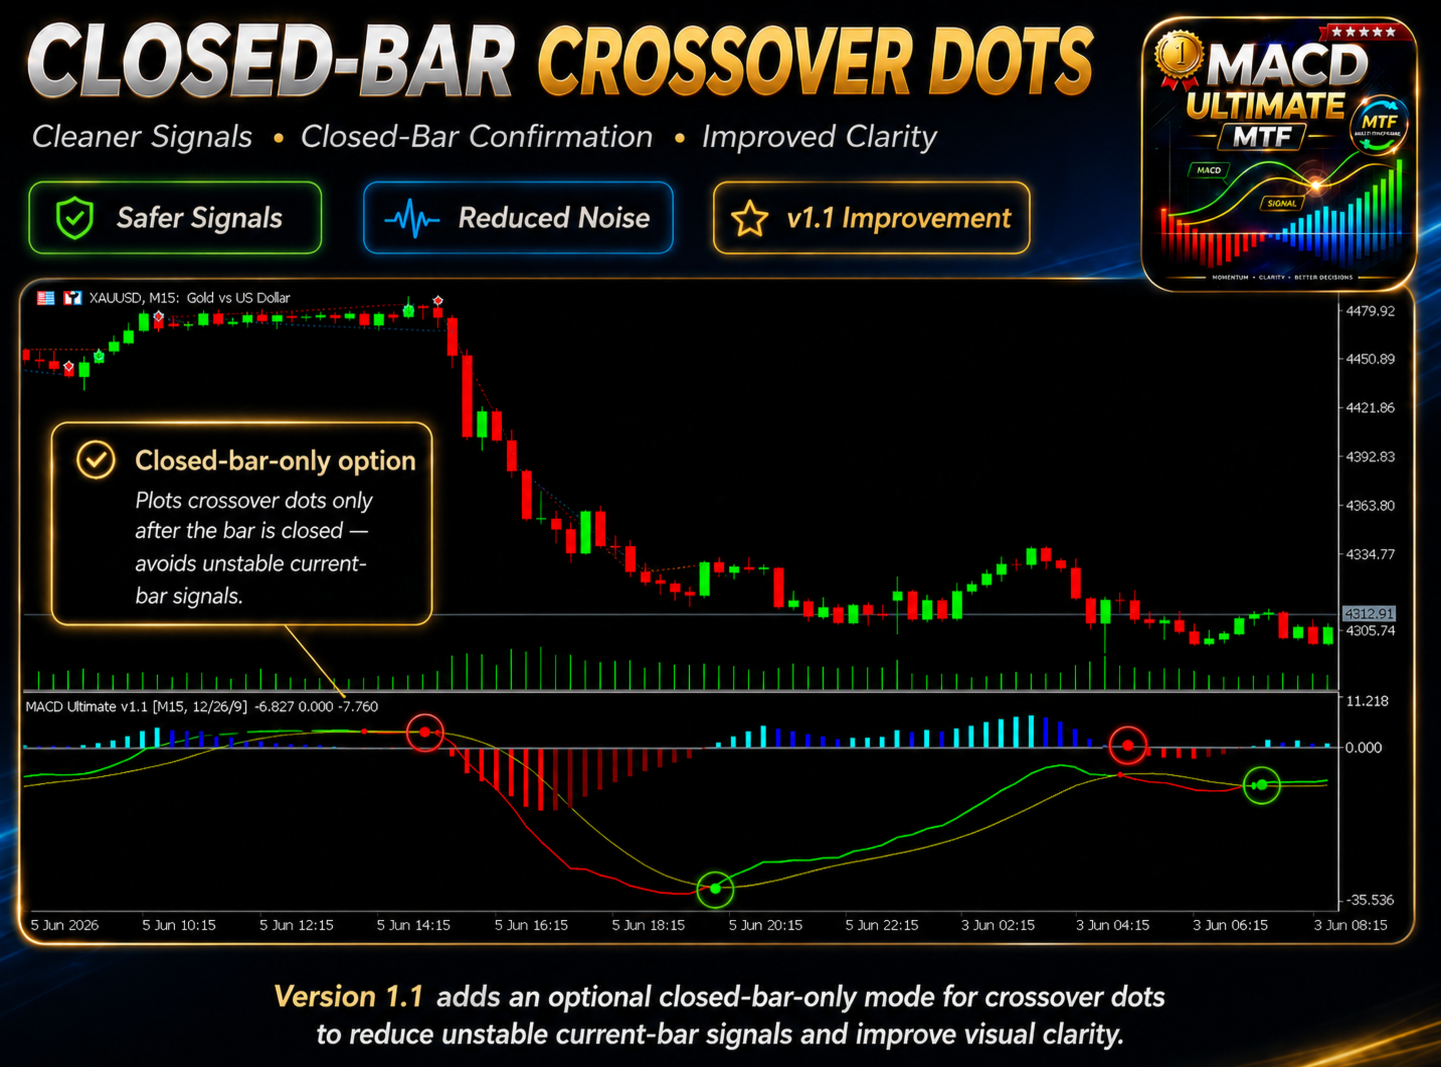
Crossover dots mark the exact bar where the MACD line crossed the Signal line. They sit inside the indicator window so they do not clutter the main chart. There is an optional setting to show dots only on closed bars, which keeps the current bar cleaner when the calculation timeframe has not yet closed.
Timeframe Flexibility
The calculation timeframe is separate from the chart timeframe. You can open a fifteen-minute chart, set the calculation timeframe to H1 or H4, and the indicator will read MACD from that higher timeframe while your chart stays at M15. The visual display aligns to chart bars, so the structure is readable without switching windows.
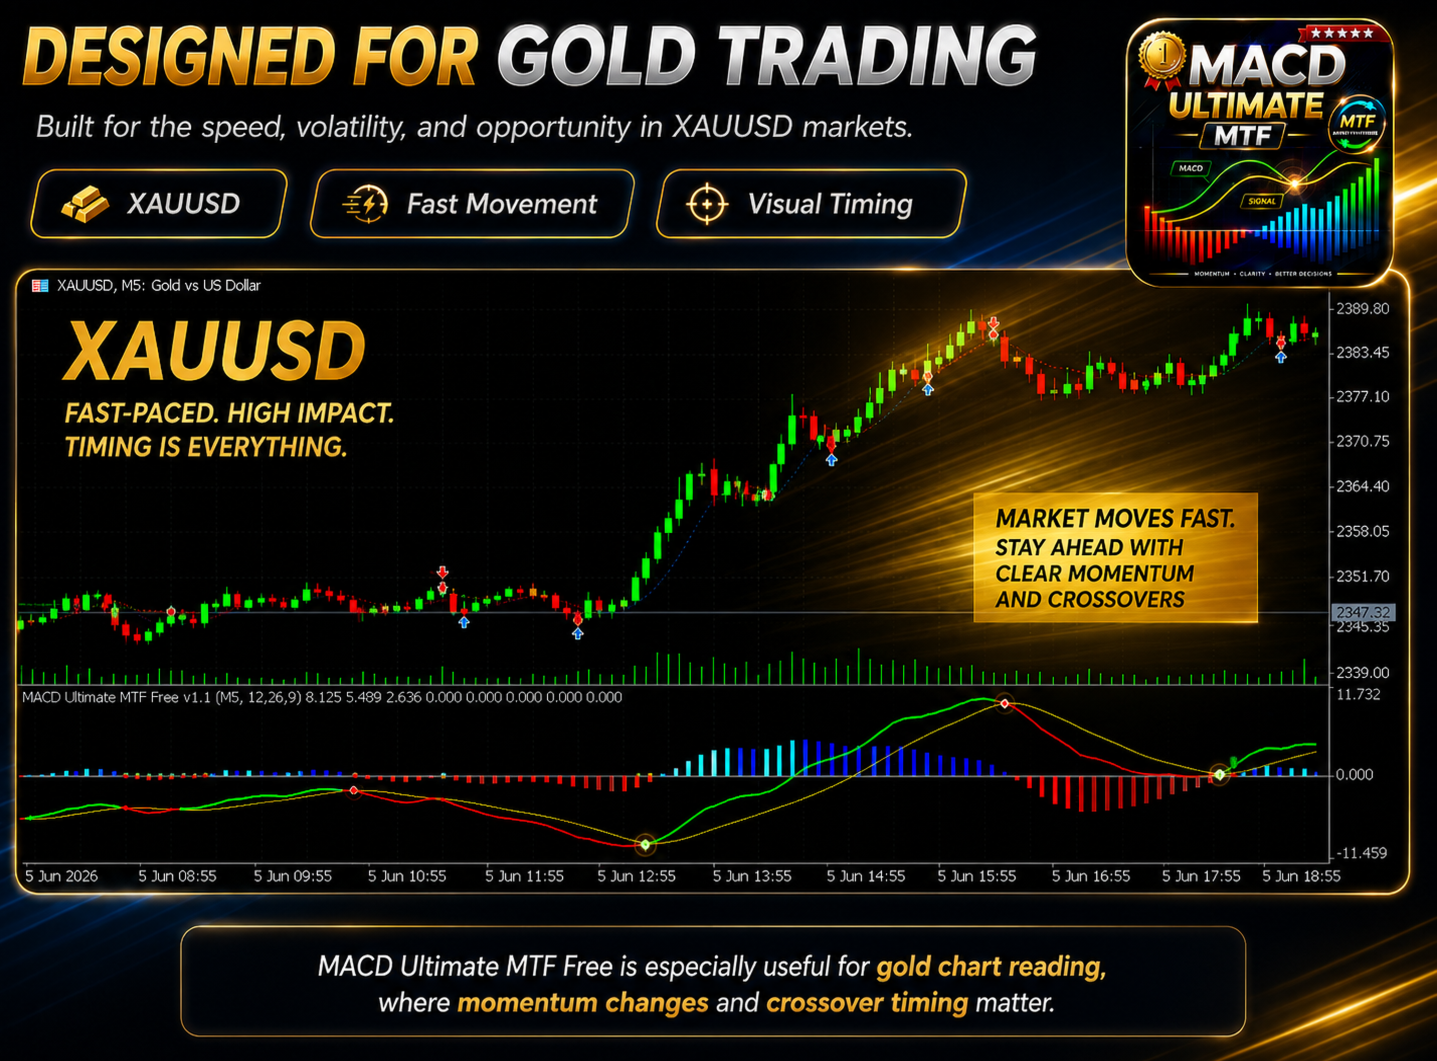
This separation is what makes the indicator practically useful. A common setup for XAUUSD is M5 or M15 for chart reading with H1 as the calculation timeframe. The lower chart shows local price behavior. The indicator shows whether the broader MACD structure supports the move or is working against it.
You can also lock the calculation to the current chart timeframe if you prefer a standard single-timeframe read.
Version 1.1 - Reliability and Visual Clarity Patch
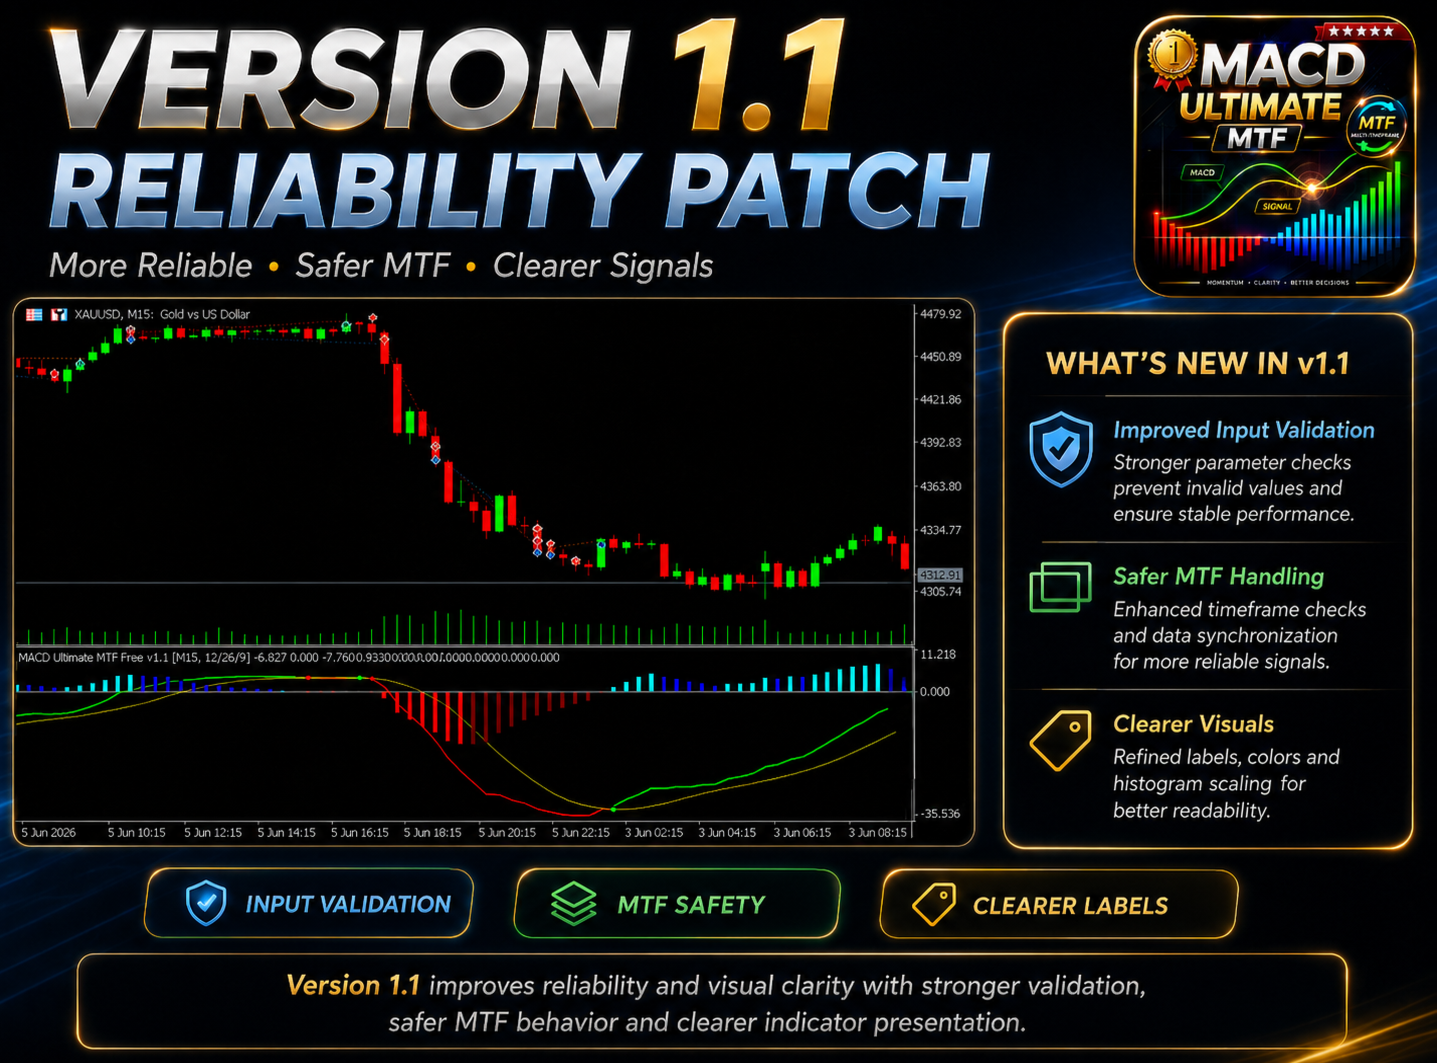
Version 1.1 does not add new signals. The focus is on making the indicator behave more reliably under different broker and data conditions.
The main changes: stronger input validation including a check that Fast EMA period is smaller than Slow EMA period, BarsCalculated checks before copying EMA data so the indicator does not attempt to draw on incomplete buffers, source timeframe synchronization checks for safer multi-timeframe behavior, improved recalculation logic when a higher calculation timeframe is used on a lower chart, an optional closed-bar-only mode for crossover dots, cleaner histogram plot labels in the indicator legend, and throttled warning logs when market data is not yet ready.
These are not headline features. They are the kind of stability details that matter when you are actually using the indicator on a live session with broker data that is not always perfectly synchronized.
A Typical Workflow
Open XAUUSD M15. Set the calculation timeframe to H1. Watch price action on the chart. When a potential setup forms, check the indicator window.
If the histogram is in a bearish expanding phase and the MACD line is below the Signal line, the H1 structure is applying downward pressure on the M15 move. A short setup in that context carries different weight than one taken when the H1 histogram is already fading.
The indicator does not tell you what to do. It gives you context that makes reading the setup more grounded.
For gold specifically, where thirty-minute moves can be sharp and fast, having that higher-timeframe MACD context visible without leaving the current chart saves time and reduces second-guessing during live sessions.
Free Version and Pro Edition
The Free version is designed for manual analysis. One selected calculation timeframe, clean MACD visualization, four-state histogram, crossover dots.
The Pro edition adds multi-timeframe confirmation across up to four timeframes simultaneously, a Smart Score engine that evaluates signal quality and zero-line context, a live dashboard panel on the main chart, main-chart signal arrows, six configurable alert types including push notifications and email, full color customization per element, configurable signal method, configurable applied price, and EA/iCustom-friendly output buffers.
If your workflow is primarily visual chart reading, the Free version covers the essentials. If you need simultaneous multi-timeframe reads, qualified signal filtering, or integration with semi-automated workflows, the Pro edition is built for that.
Important Notes
MACD Ultimate MTF Free is an analytical indicator. It does not open trades, close positions, manage risk, or guarantee profitable results.
Crossover dots and histogram phases are visual reading aids. They are not automatic buy or sell instructions and should not be treated as such. Every signal still requires your own assessment of market context, risk, and timing.
Execution differences between brokers - spread, pricing, and latency - can still affect real outcomes even with the same indicator settings. A detailed explanation of execution differences: https://www.mql5.com/en/blogs/post/769009
Not sure where this tool fits in your trading process?
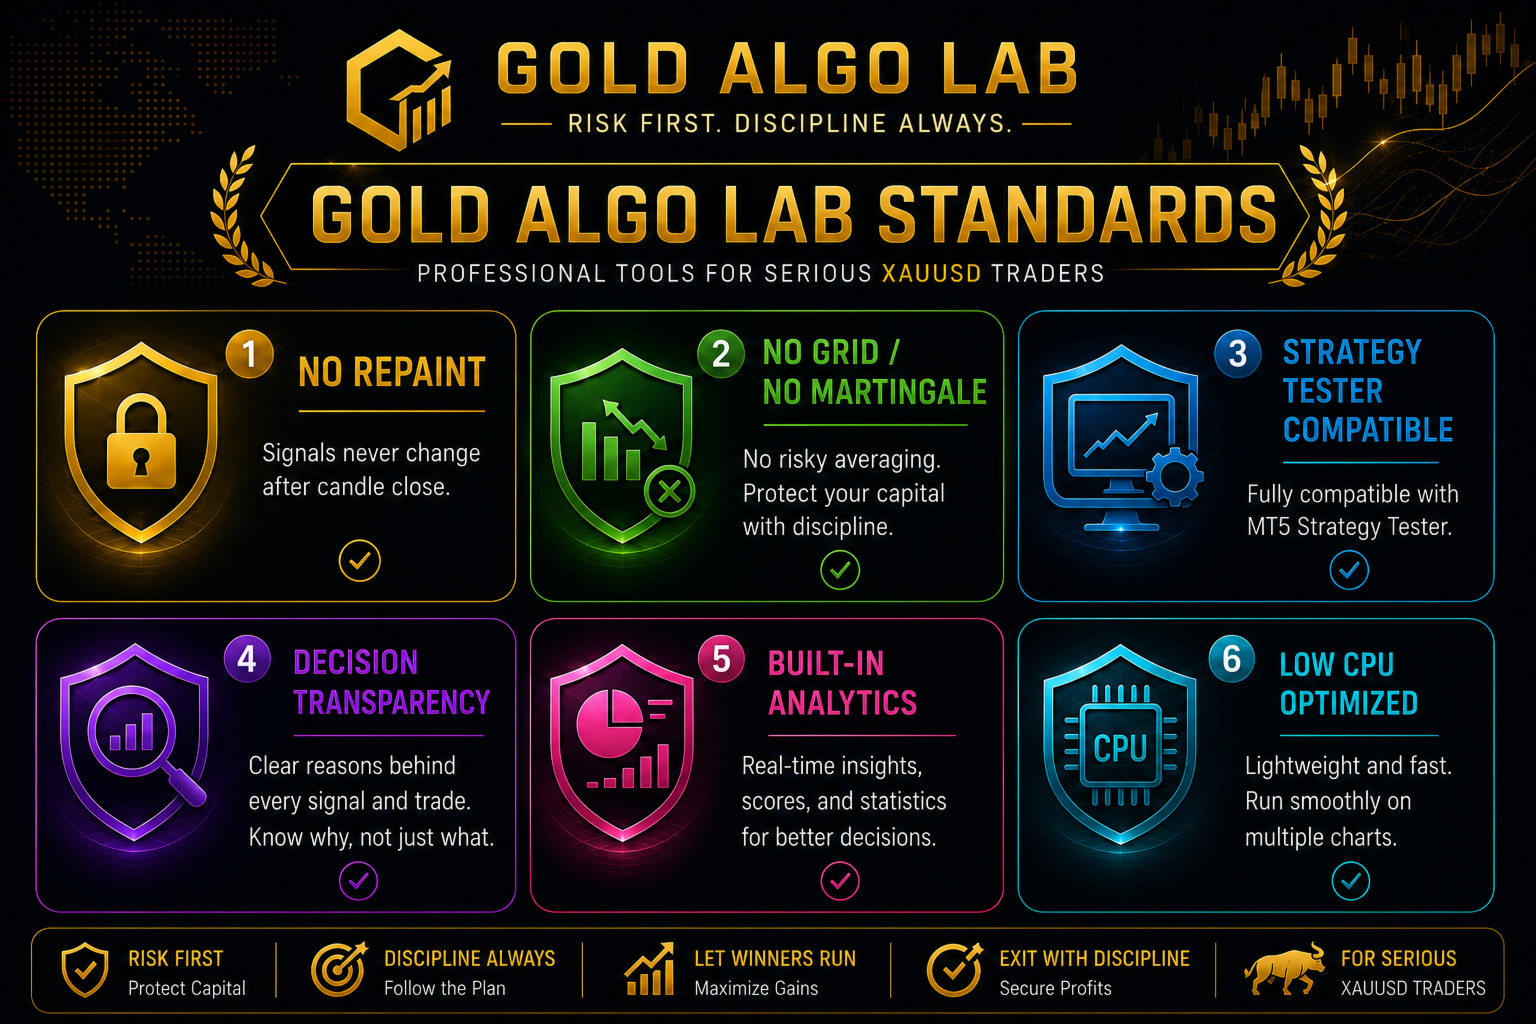
Each Gold Algo Lab tool is built to solve one specific part of the trading workflow. The Gold Algo Lab Tool Map shows how our MT5 tools connect across 6 practical stages for XAUUSD traders: market context, setup selection, risk planning, trade execution, position management and account protection.
→ Gold Algo Lab Tool Map: Where to Actually Start With MT5 Tools for XAUUSD
https://www.mql5.com/en/blogs/post/771930
You do not need every tool. Start with the stage where your process breaks down most often, then build your workflow one layer at a time.
Risk Disclaimer
Trading financial markets carries significant risk, and leveraged products such as XAUUSD and CFDs can result in losses that exceed your initial deposit.
MACD Ultimate MTF Free provides visual information about MACD momentum and multi-timeframe structure. It is not financial advice and is not a complete trading system. Past indicator behavior on historical data does not guarantee future results.
Always test on a demo account first. Make sure you understand how the indicator behaves on your broker, symbol, and timeframe before using it in a live environment.
Gold Algo Lab builds practical, risk-first MT5 tools for XAUUSD traders. Shaped by 8 years of live trading and system development, our focus is clear information, safer decision support, no hype, and no profit guarantees.


Хороший индикатор. Спасибо!