
WaveTrend Clarity
- Indicatori
-
Hoai Nam Trinh
 INIZIA DA QUI - MAPPA DEGLI STRUMENTI GOLD ALGO LAB
Non sai quale strumento MT5 si adatta meglio al tuo processo di trading su XAUUSD? - Versione: 1.20
- Aggiornato: 30 maggio 2026
| After downloading, message me via MQL5 inbox to receive your FREE User Kit - setup guide, practical checklist, and workflow resources built specifically for XAUUSD traders. |
Most WaveTrend indicators give you the lines. What they don't give you is enough visual structure to read what those lines are actually doing. On a fast XAUUSD M5 chart, a cross can form and fade before you finish deciding whether it's worth acting on. You're left chasing, or you hesitate and miss it entirely.
That's the problem this indicator was built to address.
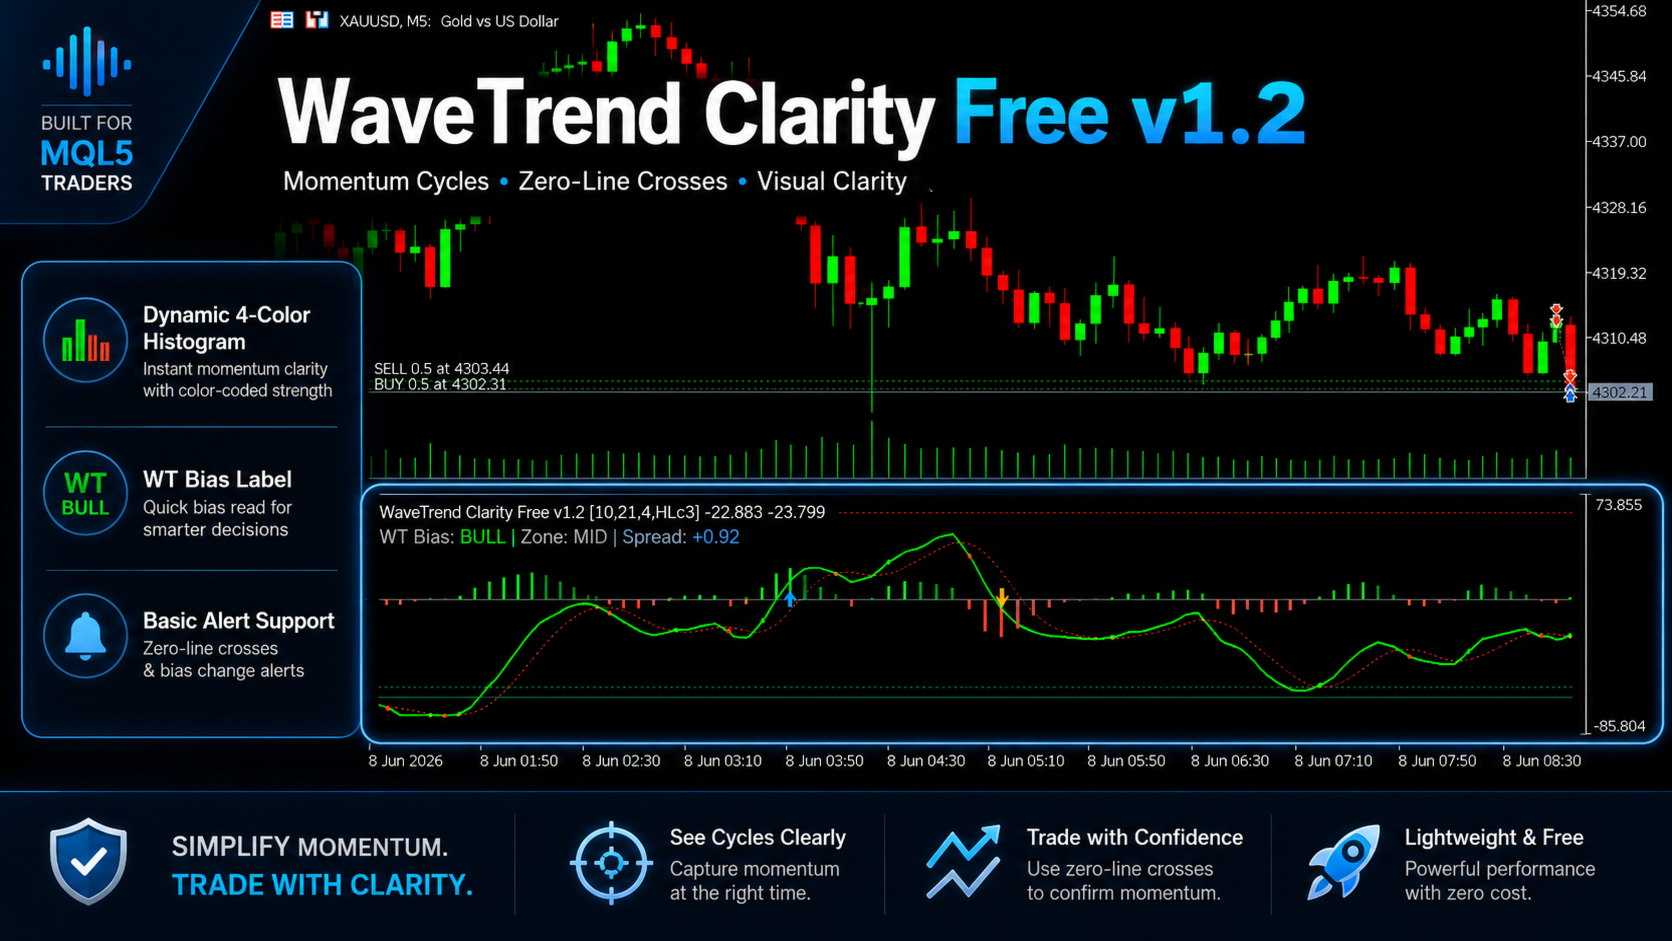
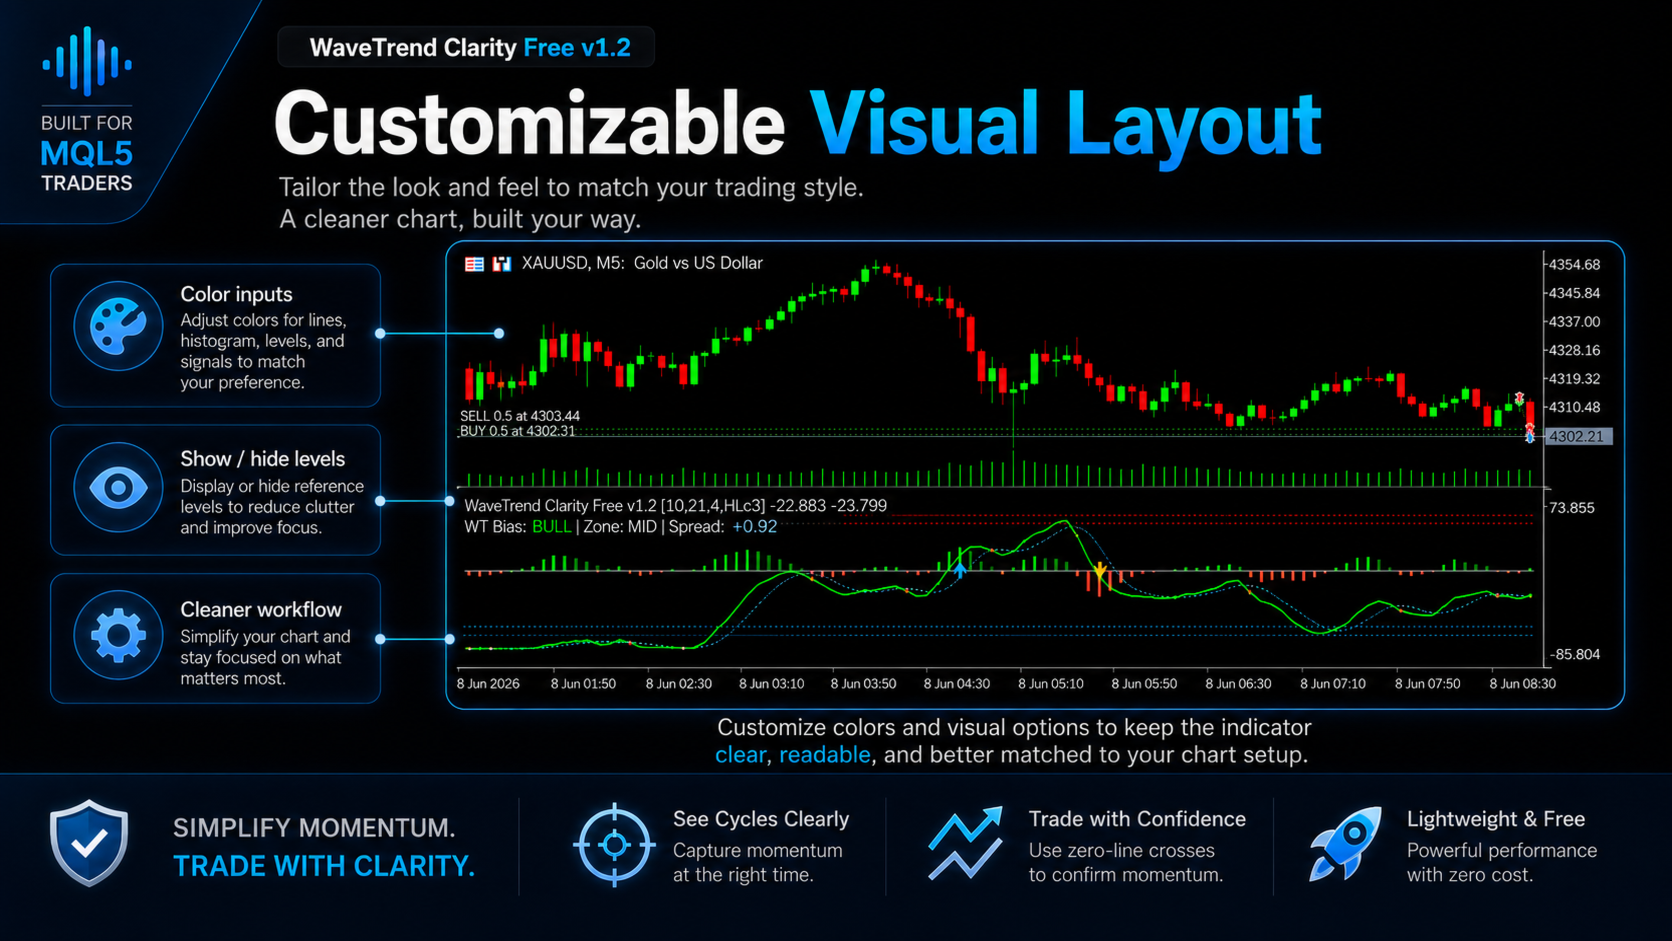
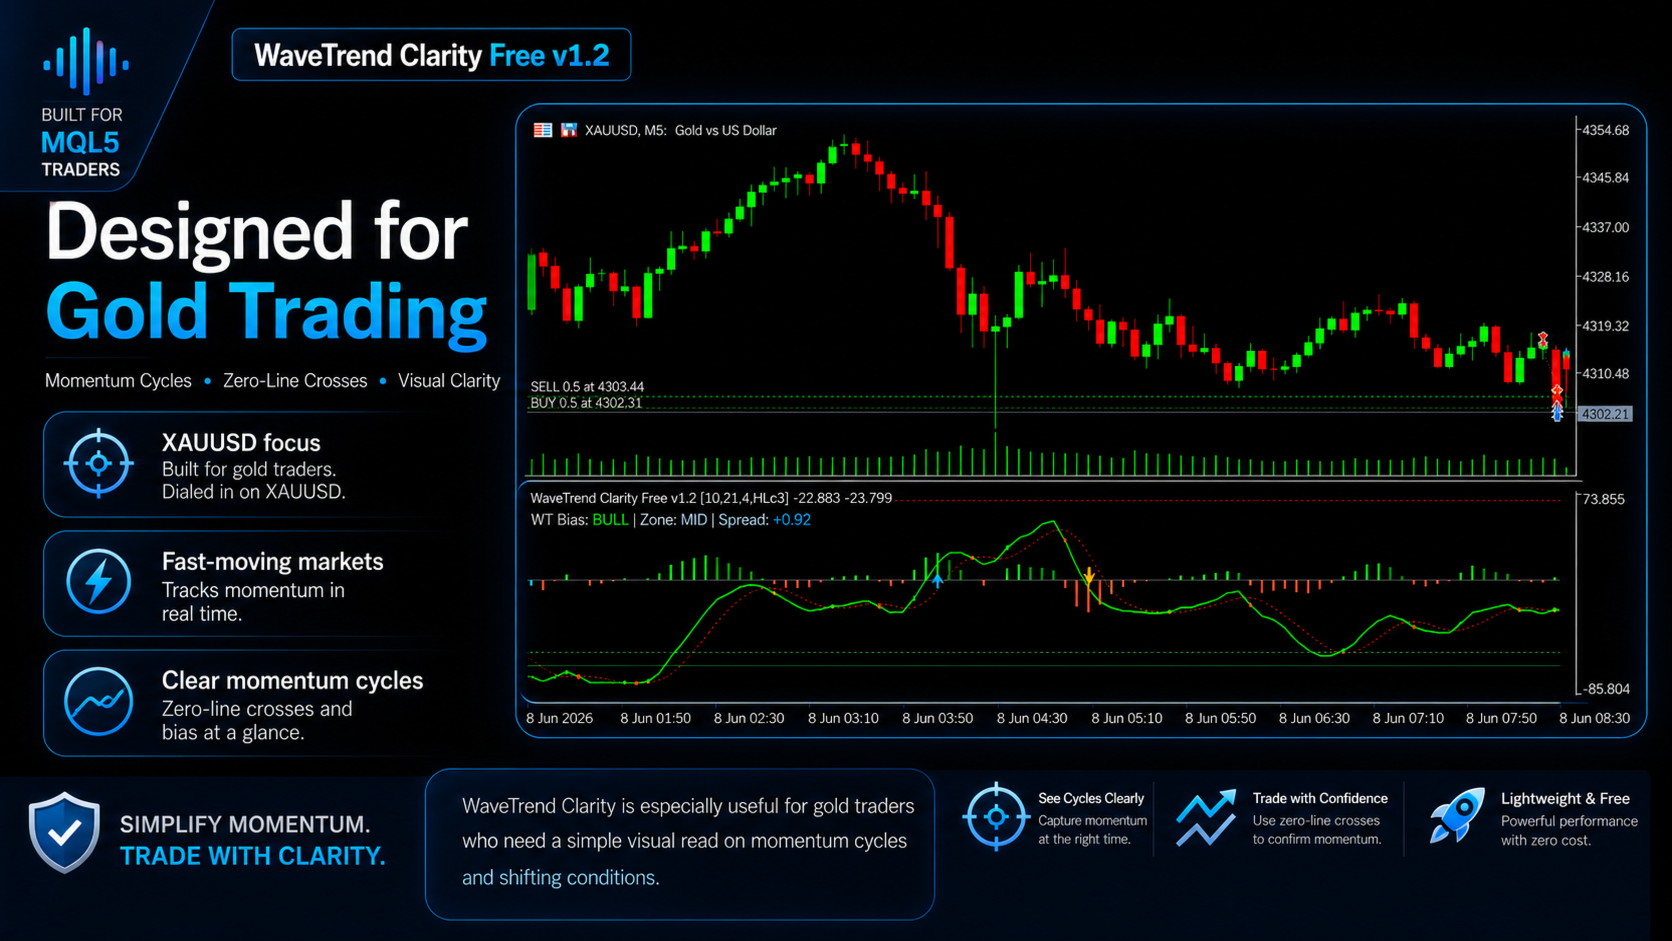
WaveTrend Clarity Free v1.2 keeps the core WT1/WT2 logic intact and adds a layer of practical visual structure on top of it. The 4-color dynamic histogram makes it obvious whether momentum is building or starting to fade. Zero-line cross markers flag when the oscillator is transitioning through center. OB/OS reference levels show when price action is running into an overextended range. And a compact WT Bias label gives you a quick read of current bias, zone position, and spread value without covering your price chart.
Nothing automated. No signal arrows. Just cleaner momentum reading, which is what most traders actually need.
What's In This Version
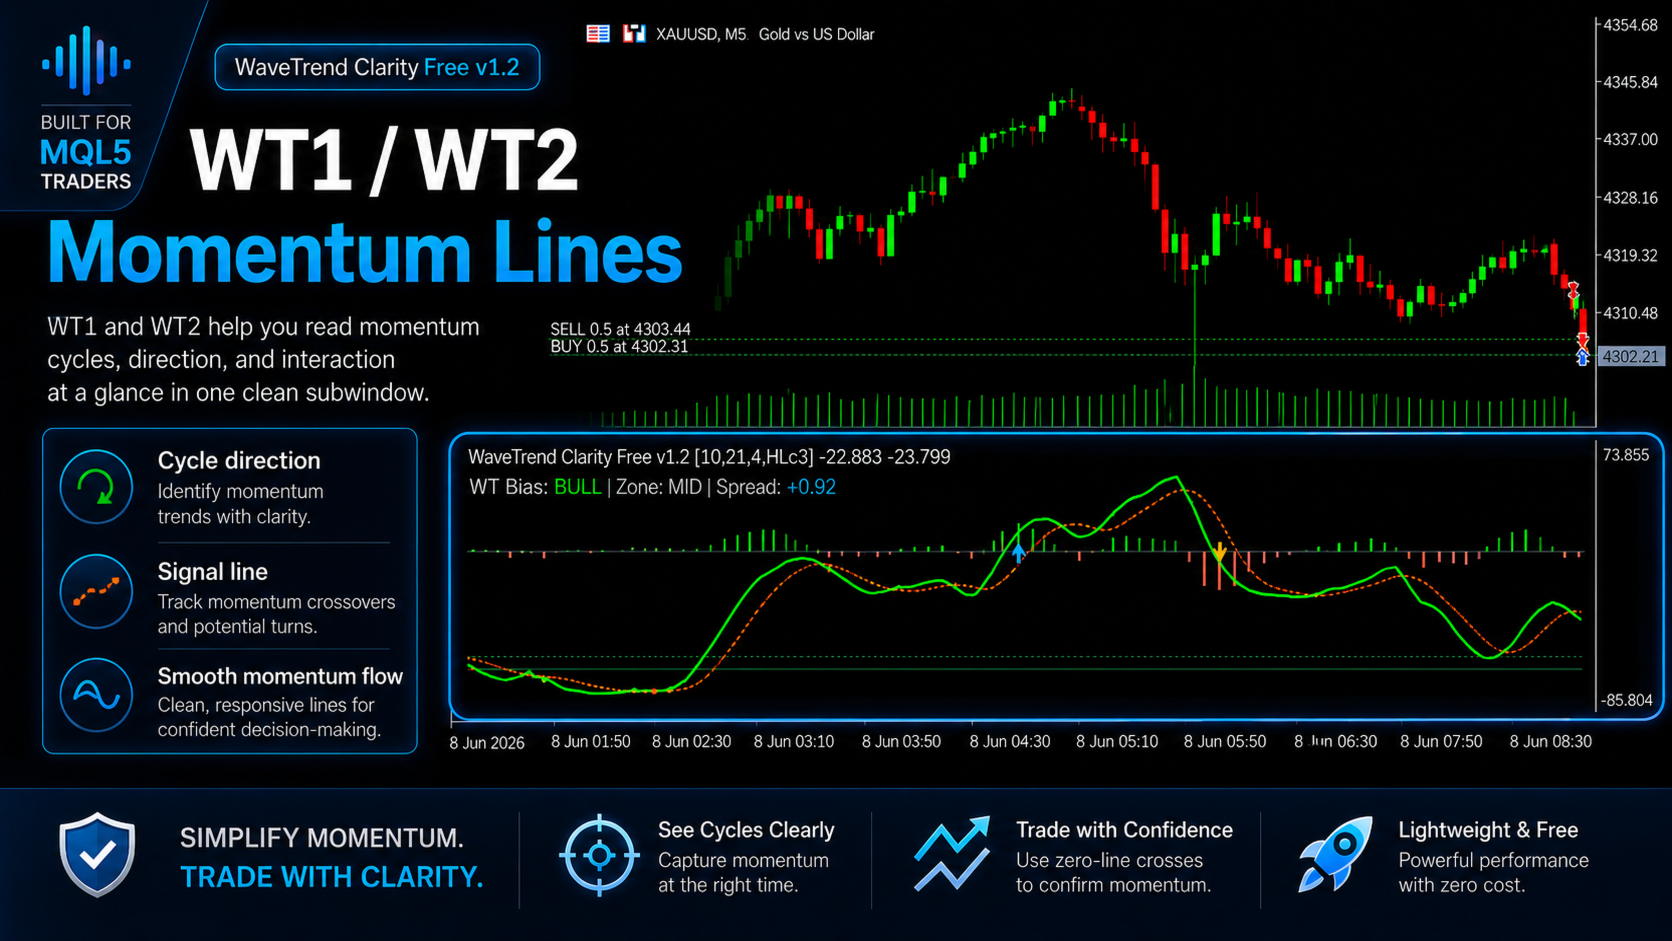
WT1 and WT2 momentum cycle lines give you the standard WaveTrend cross structure, cleaned up visually.
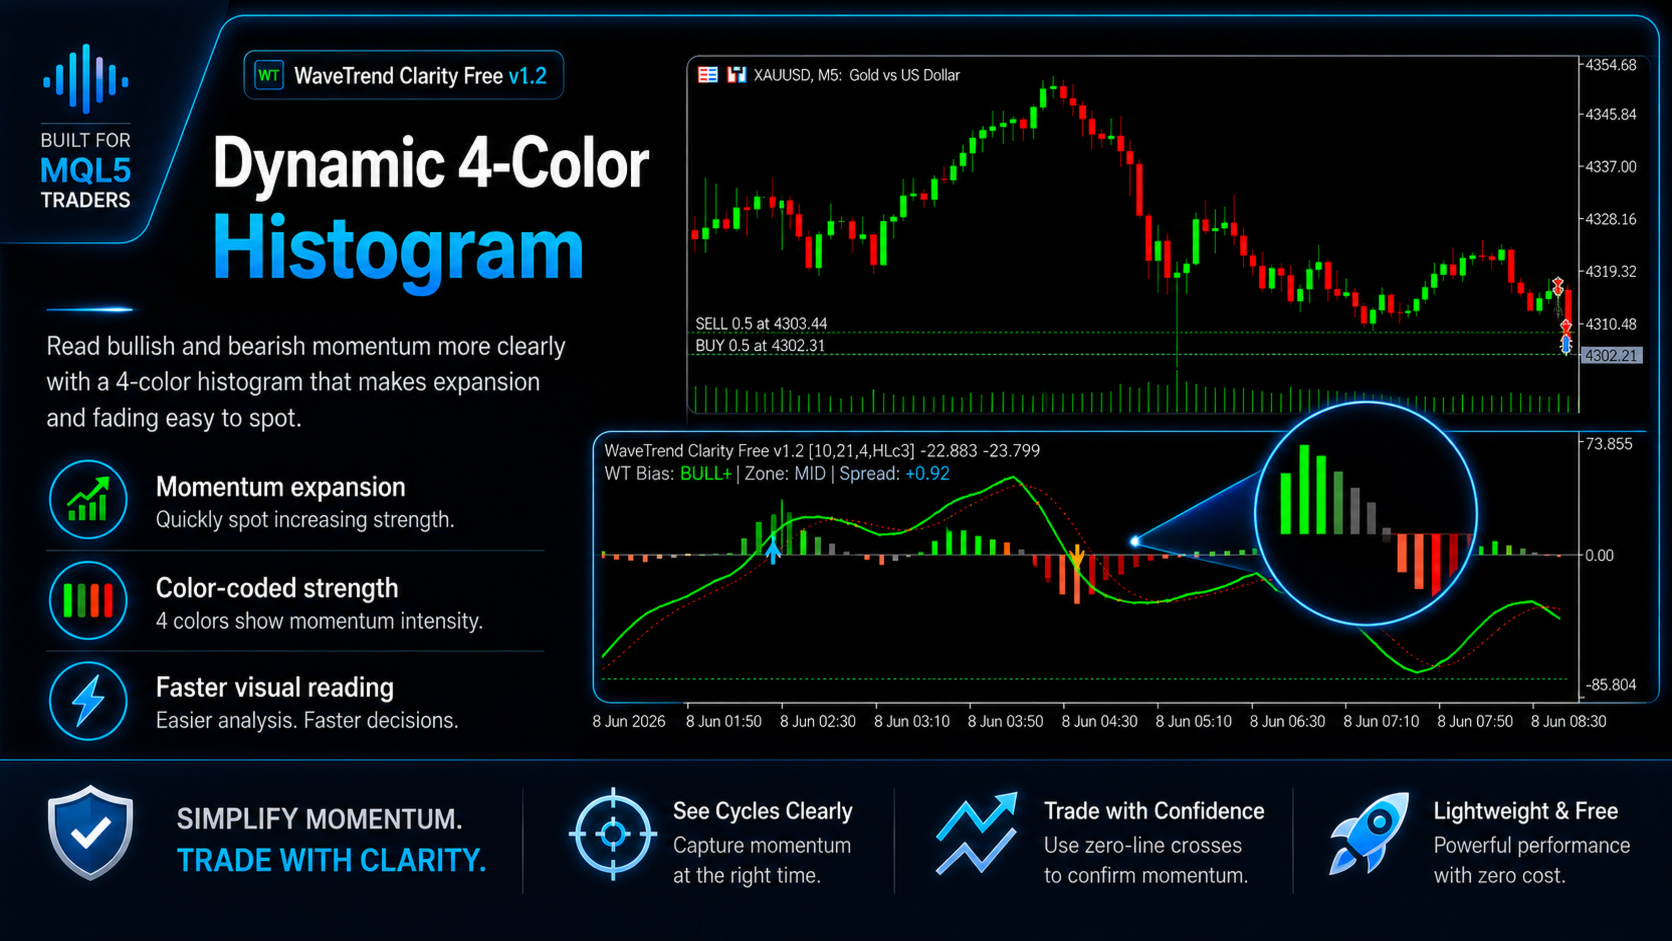
The dynamic 4-color histogram is the main upgrade in v1.2. Bull Strong, Bull Fading, Bear Strong, Bear Fading states replace the old single-color spread bars. When the histogram is expanding in the bullish direction, you can see it. When momentum is stalling and the bars start compressing, you can see that too. It's a small change that makes a noticeable difference when reading price in real time.
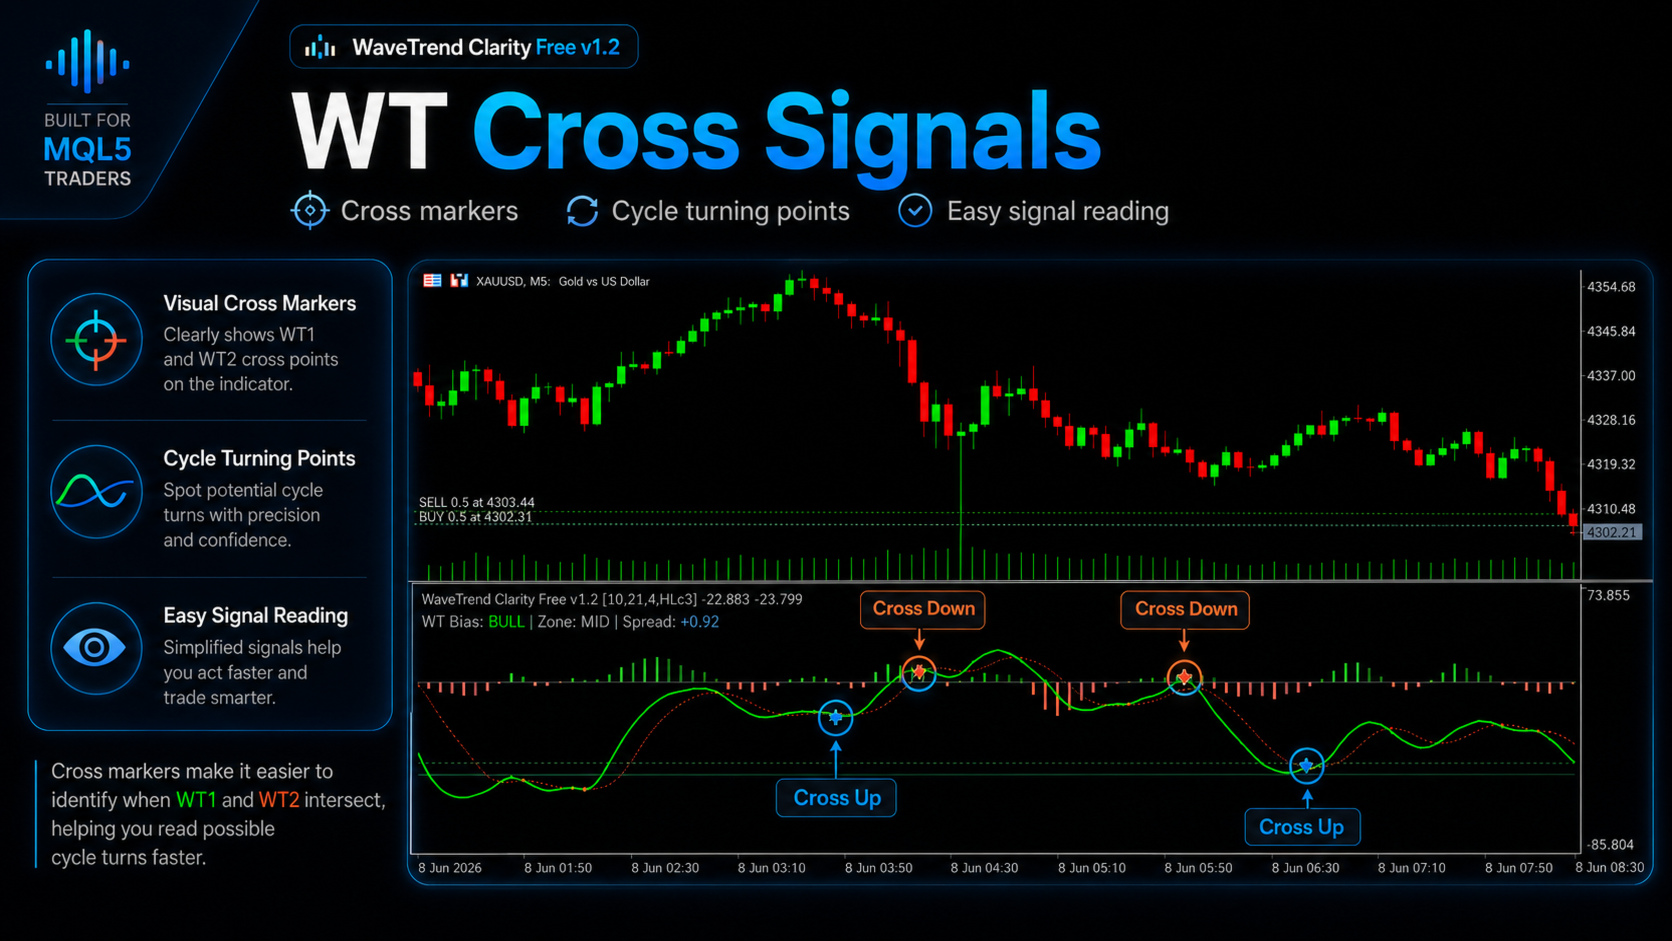
WT cross markers sit inside the subwindow at the exact cross point between WT1 and WT2. Easy to spot on a fast timeframe without cluttering the main chart.
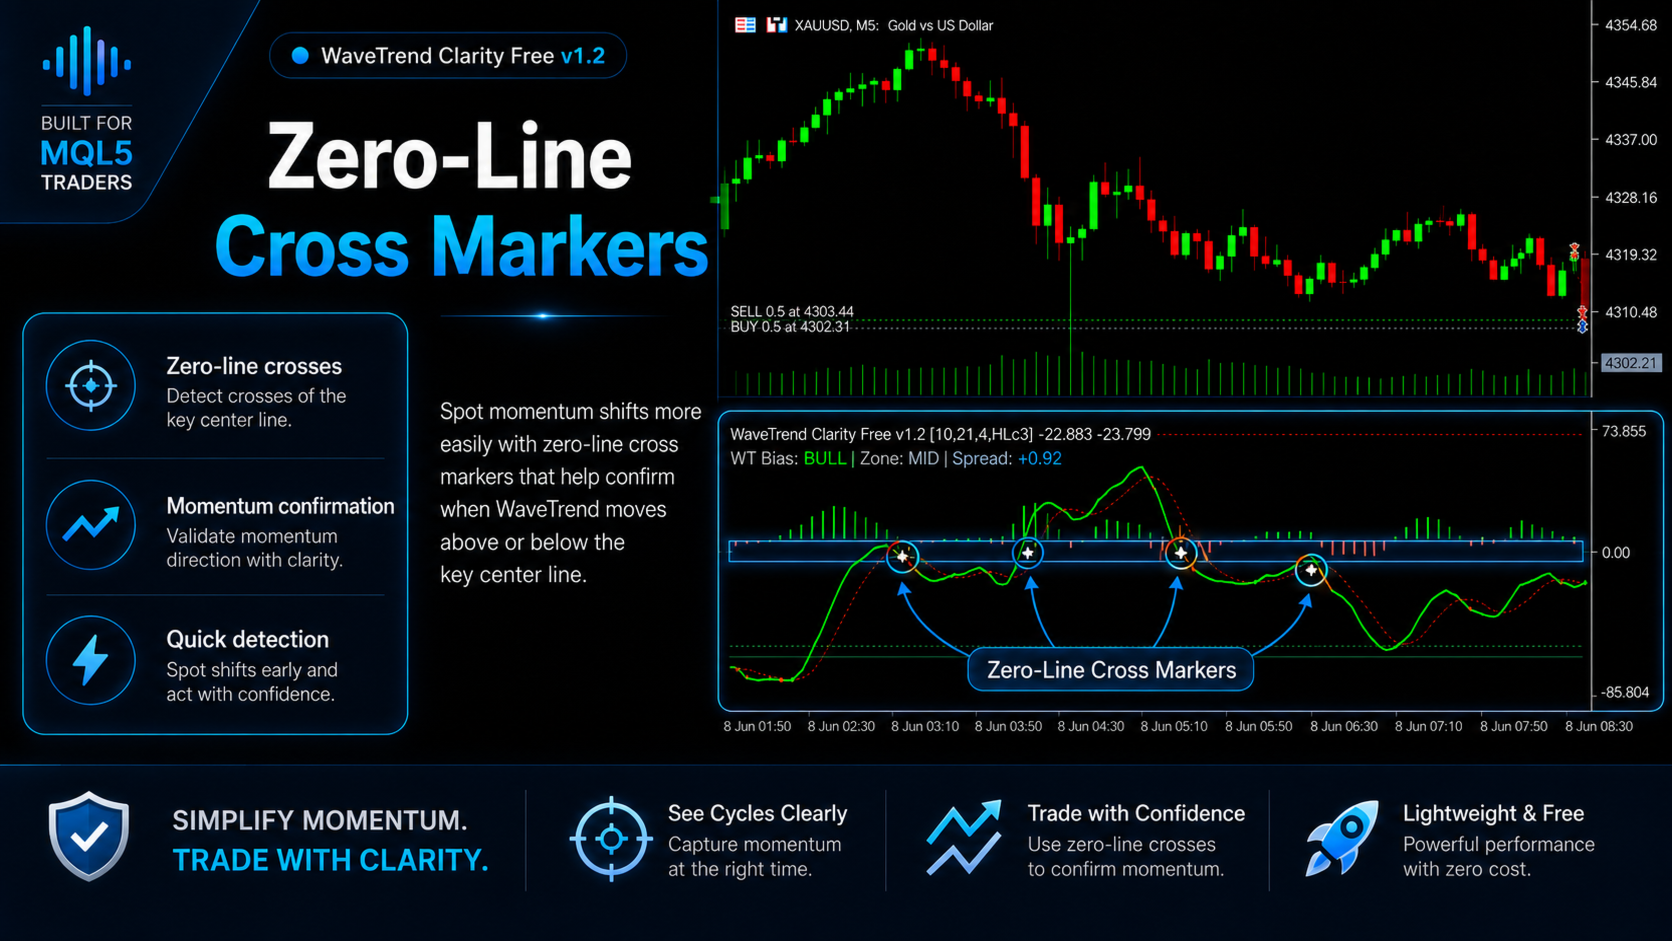
Zero-line cross markers were added because zero-line transitions often matter. A WT1 crossing up through zero on a short-term chart is a different read than a cross that stays buried below the centerline. These markers let you track those transitions at a glance.
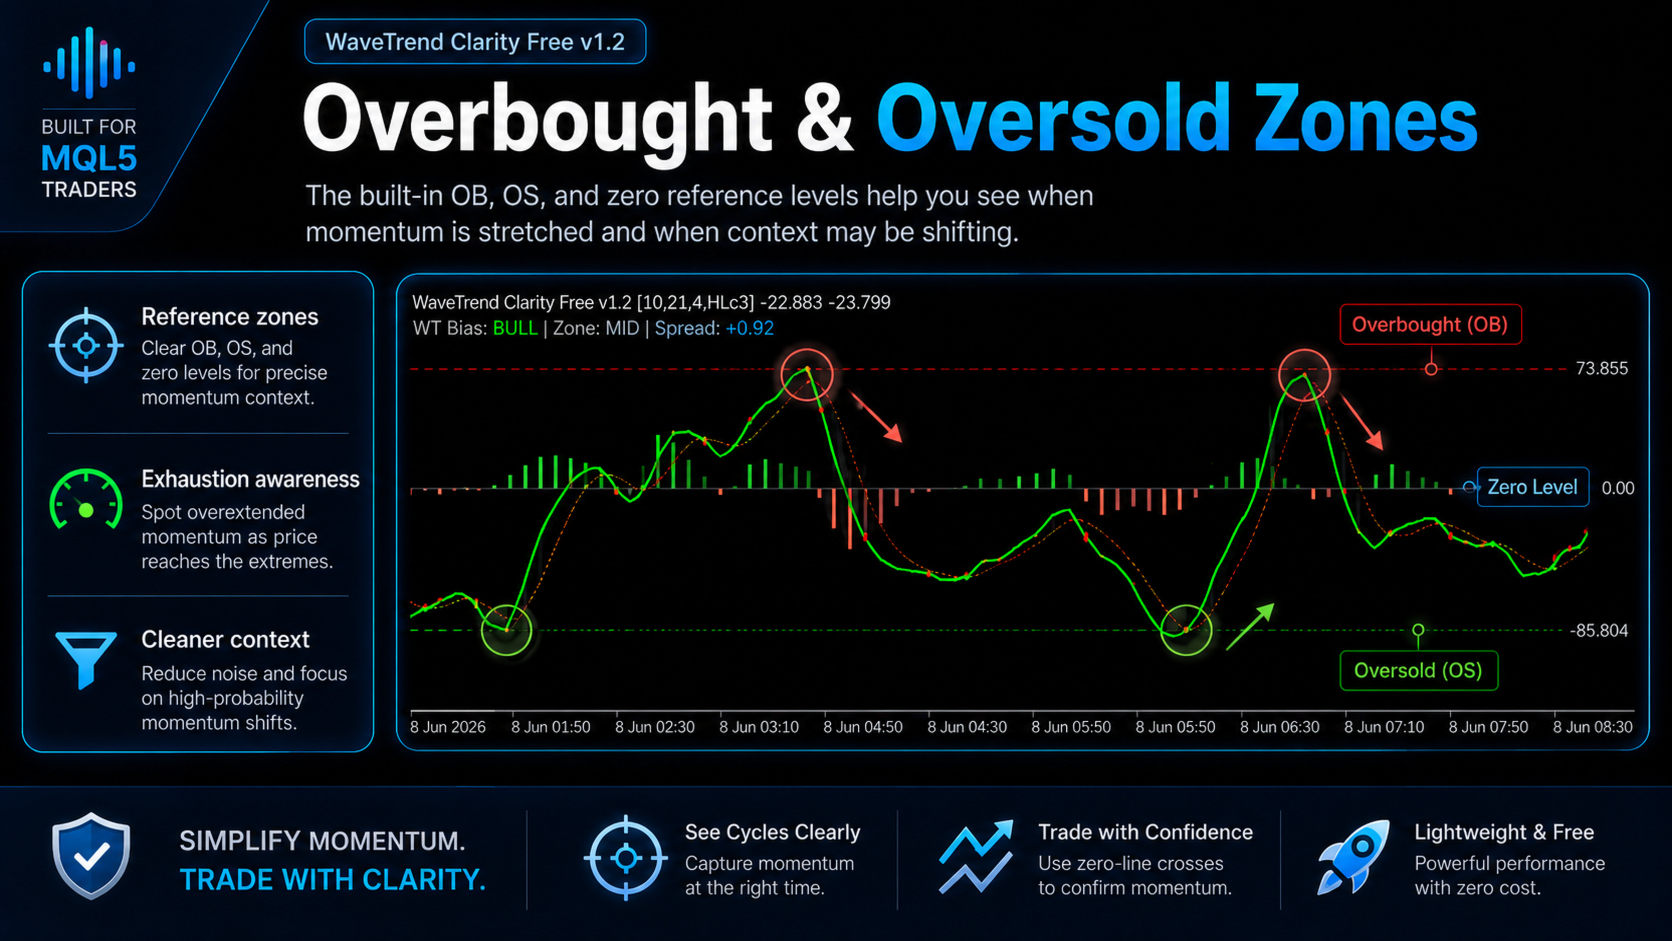
OB/OS reference levels at four adjustable thresholds (±53 and ±60 by default) mark the zones where momentum becomes overextended. These are context zones, not automatic reversal signals. They're most useful when combined with what price is doing at the same time.
The compact WT Bias label displays current bias (Bull/Bear/Neutral), zone context (MID/OB/OS), and real-time spread value directly in the subwindow header. You get a quick text summary without losing screen space to a large dashboard.
Basic closed-bar popup alerts are included. Alerts fire after a candle close, not on every tick, which reduces noise significantly on intraday charts.
All colors are fully customizable. You can also toggle the histogram, signal line, reference levels, cross markers, zero-line markers, and the bias label on or off to match your chart style.
How to Read It
When WT1 is above WT2 and the histogram is showing Bull Strong bars, the short-term momentum bias is clearly bullish. As the histogram transitions to Bull Fading, momentum is still positive but losing strength. That shift alone is worth knowing before entering.
When WT1 drops below WT2, the histogram flips to Bear Strong or Bear Fading depending on slope direction. A reading like this near an OB zone, especially after price has been running for several candles, tends to be more meaningful than the same cross in the middle of a range.
Zero-line crosses add another layer. A WT1 crossing up through zero while the histogram is Bull Strong gives more structural weight to a potential long entry. A cross that happens while the histogram is already fading suggests a weaker setup.
None of this replaces price action, support and resistance zones, or session context. The indicator is a read on momentum structure. Your job is to decide whether that structure fits what you're seeing on the main chart.
What This Version Doesn't Include
MTF confirmation, Clarity Score, EMA trend filter, regular divergence detection, main-chart arrows, the full dashboard, Push and Email alerts, and EA-compatible signal buffers are available in WaveTrend Clarity Pro. If you're using this indicator as part of an EA or want filtered, confirmed signals with multi-timeframe context, the Pro version is the right tool.
Execution differences between brokers (spread, pricing, latency) can still affect real outcomes even with the same setup. A detailed explanation of execution differences: https://www.mql5.com/en/blogs/post/769009
Not sure where this tool fits in your trading process?
Each Gold Algo Lab tool is built to solve one specific part of the trading workflow. The Gold Algo Lab Tool Map shows how our MT5 tools connect across 6 practical stages for XAUUSD traders: market context, setup selection, risk planning, trade execution, position management and account protection.
→ Gold Algo Lab Tool Map: Where to Actually Start With MT5 Tools for XAUUSD
https://www.mql5.com/en/blogs/post/771930
You do not need every tool. Start with the stage where your process breaks down most often, then build your workflow one layer at a time.
Risk Disclaimer
Trading financial markets involves risk. This indicator is provided for chart analysis and momentum reading only. It does not open trades, manage positions, or provide direct buy and sell recommendations. Test it thoroughly on a demo account before applying it to live trading. Past performance of any indicator does not guarantee future results.
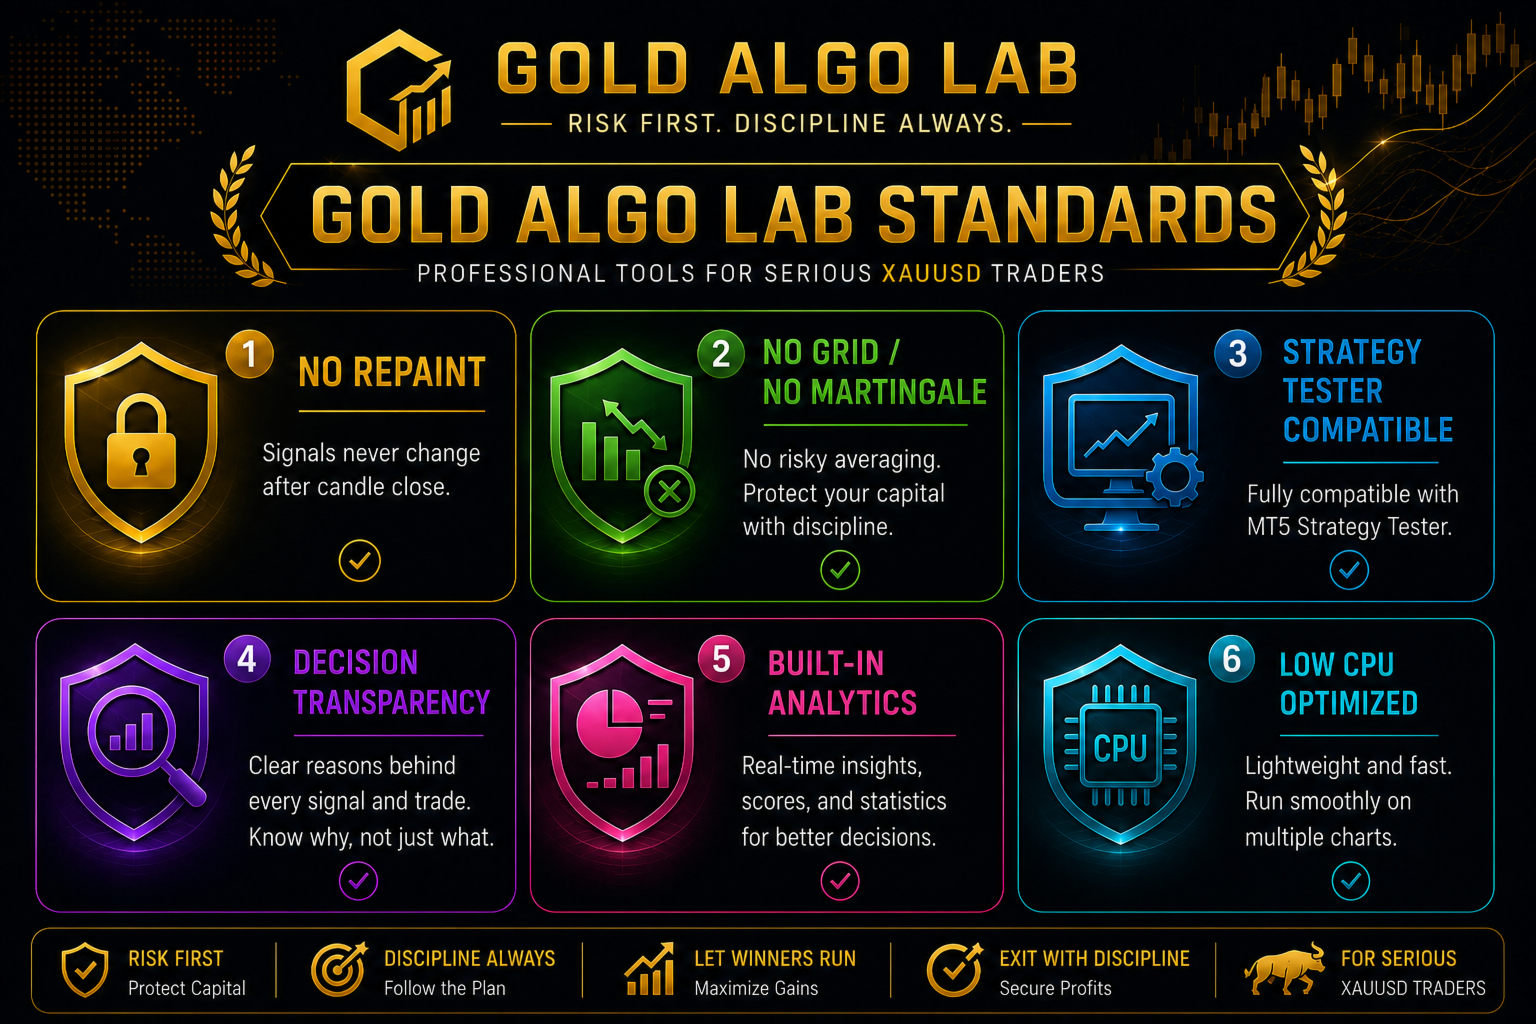
Gold Algo Lab builds practical, risk-first MT5 tools for serious XAUUSD traders, shaped by 8 years of developing and trading real systems to help traders identify clearer setups, manage risk with greater confidence and execute with more discipline.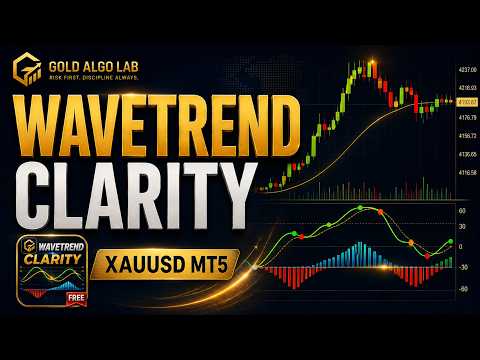
















































L'utente non ha lasciato alcun commento sulla valutazione.