Turtles Pro

🐢 Turtles Professional v2.0

The Legendary Turtle Strategy, Reimagined for the Modern Trader
Turtles Pro transforms the iconic 1980s Turtle Trading System into a high-performance, multi-timeframe decision engine. It eliminates guesswork by providing institutional-grade analysis on trend structure, entry quality, and volatility all on a single chart.

The Strategic Edge


Turtles Professional uses a Smart Weighted Bias Engine to prioritize higher time frames, ensuring your trades align with the dominant market force.

FEATURE HOW IT WORKS
Weighted Bias
Hierarchical analysis from MN1 (5.0 weight) to M5 (0.8 weight).
Action Column
Instant instructions:  SQUEEZE,  BREAKOUT,  TREND, or ⏳ WAIT.
Confidence Meter
A 0–100% score based on trend persistence and volatility contraction.
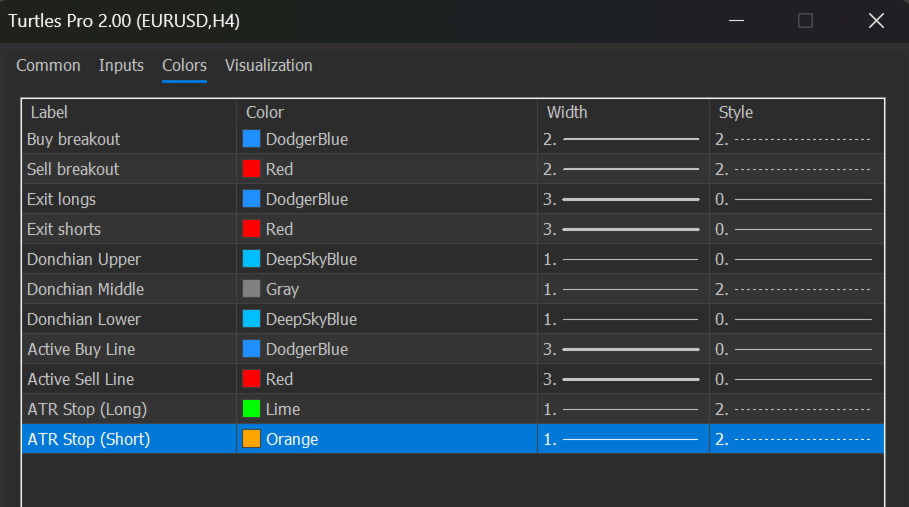
Risk Visuals
ATR symbols (⬤ Red = Wide, ● Green = Tight) define the current volatility regime.


Signal Hierarchy and Logic

The system evaluates multiple confluences to generate high-probability entries.

1. SQUEEZE (80–100%): High volatility contraction + strong trend. Prepare for explosive moves.
2. BREAKOUT WATCH (70–90%): Price testing Donchian edges; ready for entry.
3. TREND (60–80%): Established momentum; hold or add on pullbacks.

4. RANGE (20–60%): Price idling in the channel; wait for clarity.

Confidence Formula:

Confidence = (|Weighted Bias| x 50) + (20 if VCS > 70) + (20 if TPS > 70)

Comprehensive Dashboard

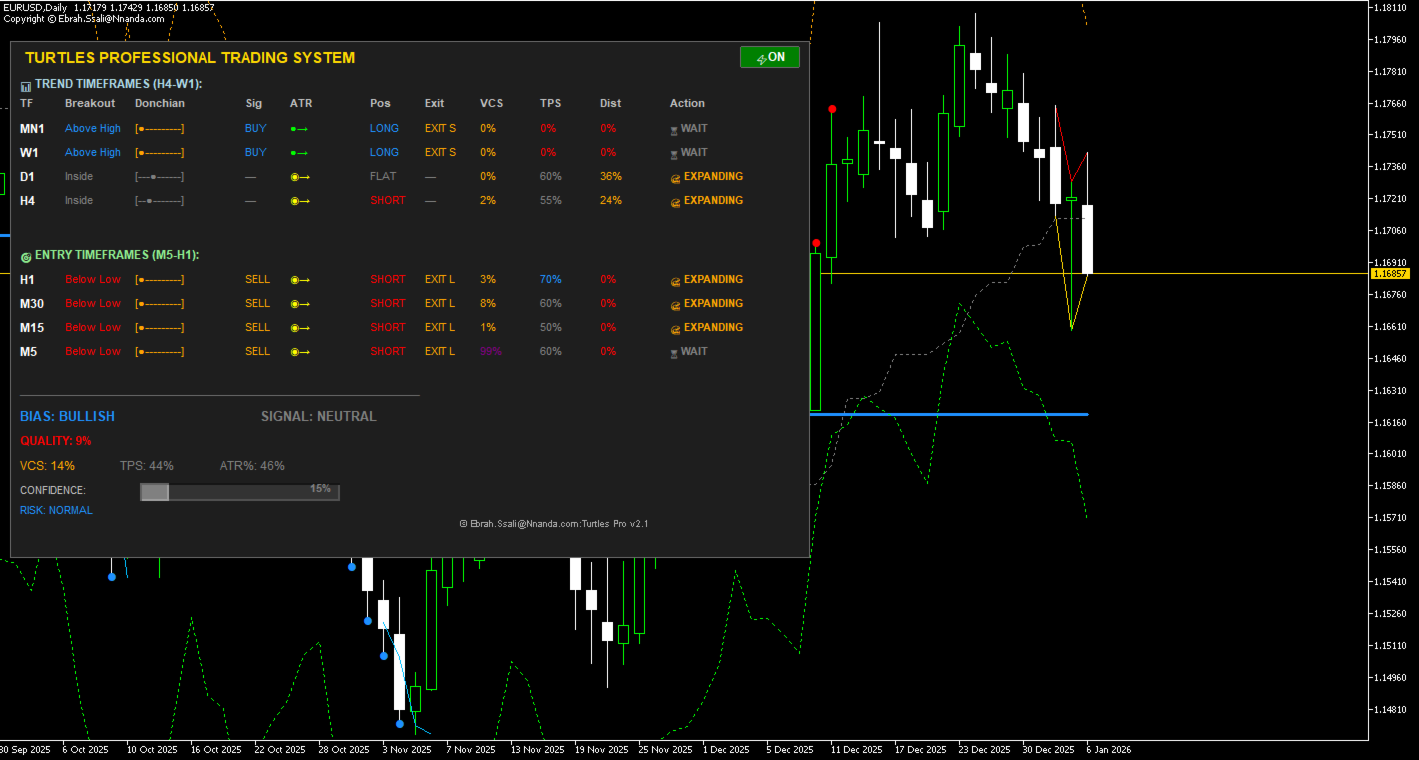
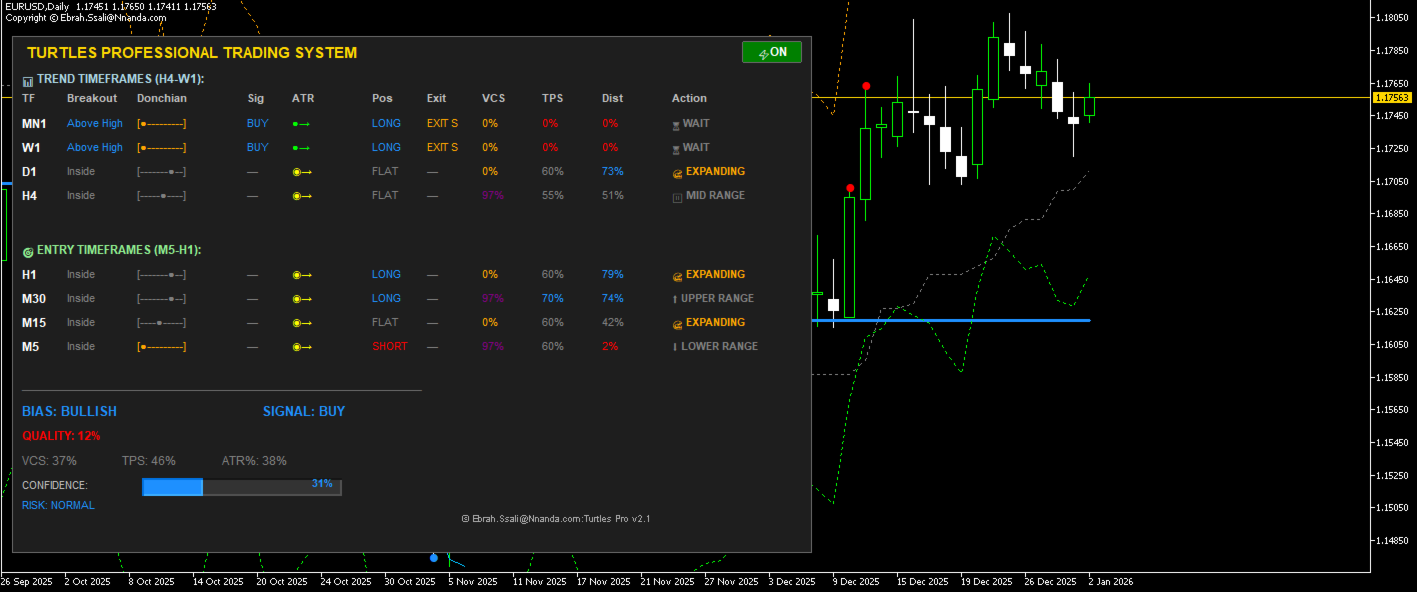
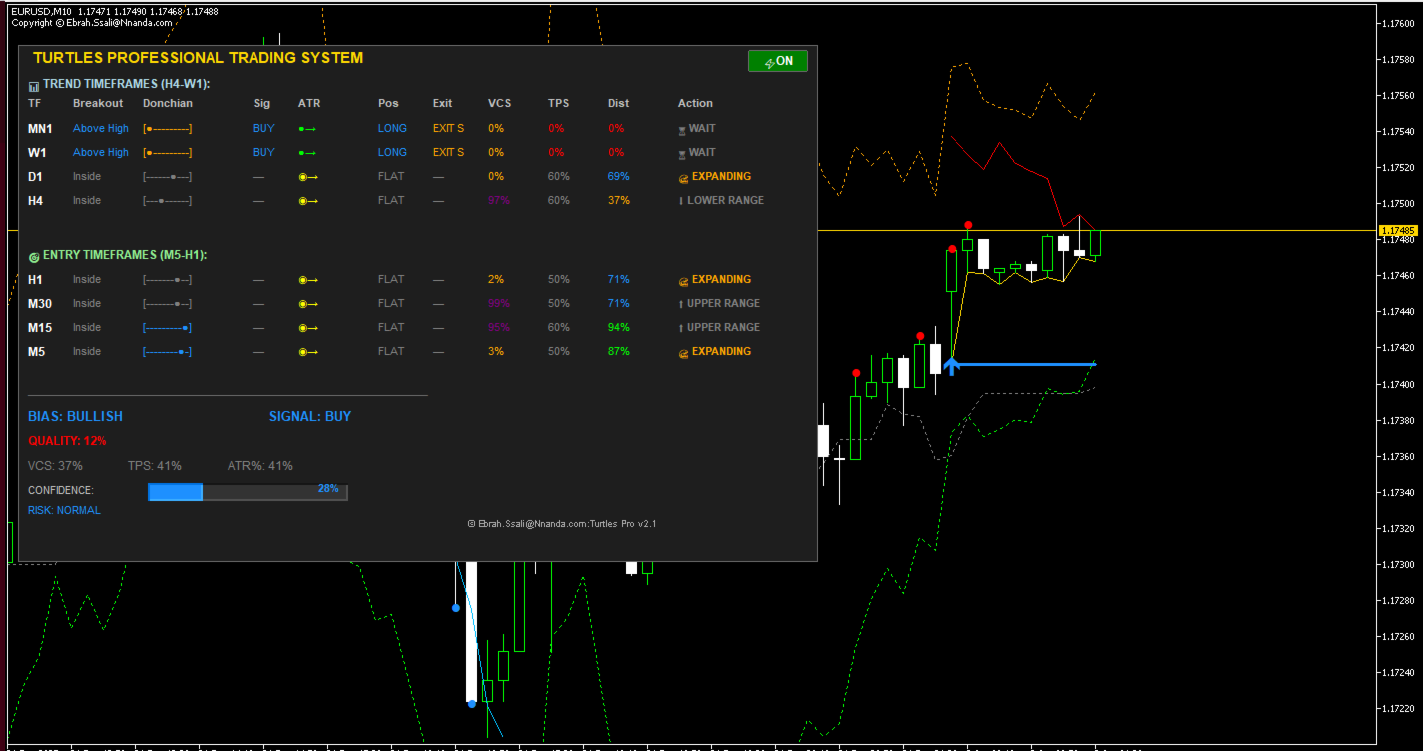
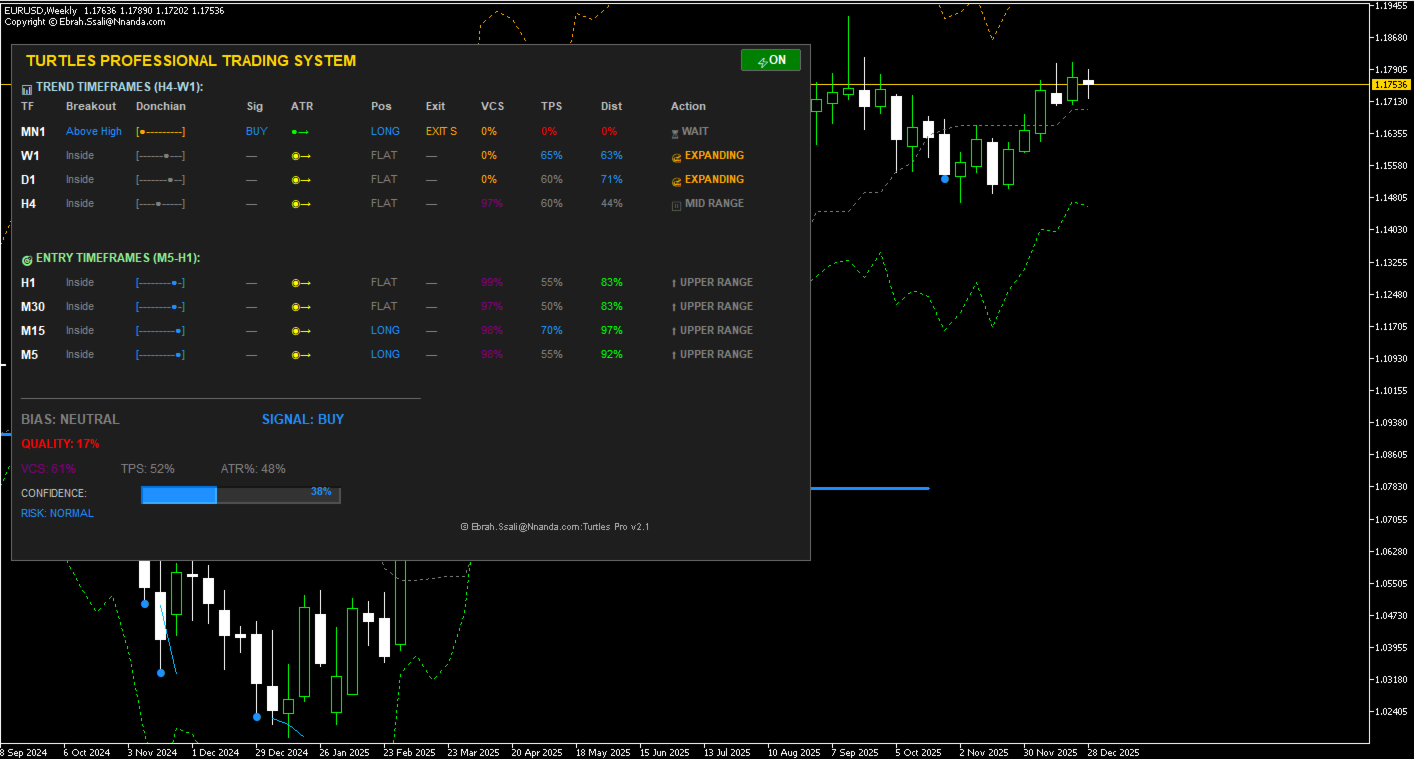
A 12-column visual engine providing real-time intelligence across 8 timeframes:
Donchian Position: Visual [●] bar showing exact location within the 0–100% channel.
Volatility (VCS) and Trend (TPS): Scores that quantify "Squeeze" and "Persistence."
Pyramid Tracking: Monitors unit additions based on classic Turtle rules (0.5× ATR).
Summary Area: Global BIAS, SIGNAL, and RISK (Low to High) assessment.

Quantitative Metrics

VCS (Volatility Contraction Score): Detects squeeze setups

TPS (Trend Persistence Score): Measures trend quality

ATR Percentile: Institutional volatility context


Professional Risk Management

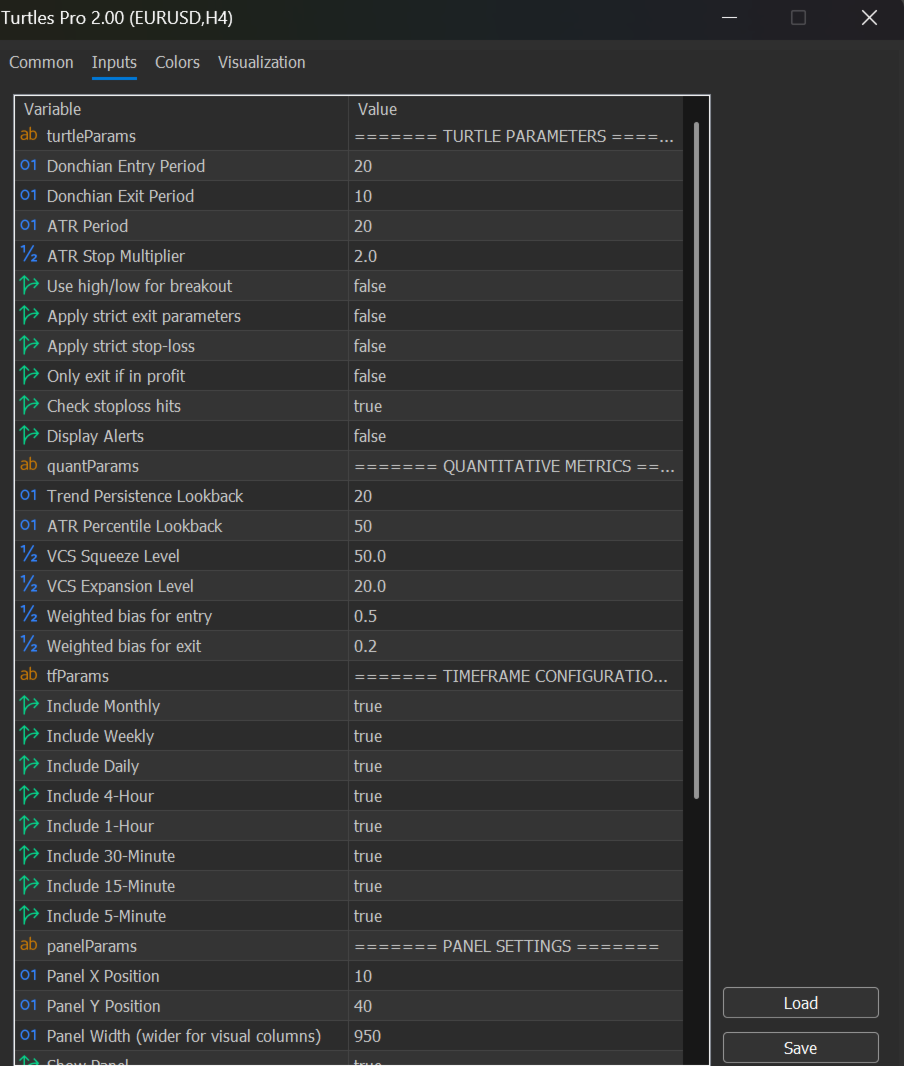
Stop-loss and take-profit guidance adapt to the market environment:

Wide Volatility: Uses 2.5–3.0× ATR stops.
Tight Volatility: Uses 1.5× ATR stops.
Exit Strategy: Automated signals based on the 10-period Donchian exit.

EA-Ready and CPU Optimized

Automation: 11 dedicated indicator buffers (Arrows, Stops, Channels) for seamless CopyBuffer() integration in Expert Advisors.
Efficiency: Features a Smart Toggle (⚡ON / 💤OFF). Turn the panel off to save  CPU while keeping the chart clear.

Why Choose Turtles Professional?

Legacy Proven: The Dennis and Eckhardt concept evolved for 2026 markets.
Zero Guesswork: One chart, eight timeframes, clear colour and emoji-coded actions.
Precision Timing: Real-time breakout detection vs. lagging standard indicators.

A complete Turtle trading system that doesn't just show data - it makes decisions, manages positions, and can be rigorously tested. This isn't built by indicator developers but by systems architects into a quant-grade decision engine. That is what separates retail indicators from institutional trading tools. Our development implements the Turtle trading system, combines visual intuition with quantitative rigor, while providing CPU-saving features for practical use.

Utility:

Zero Mental Math - Visual patterns replace number crunching

Context at Glance - state, trend, and action

Faster Decisions - Color-coded cues trigger instinctive responses

Pattern Recognition - Visual bars show channel position instantly

Actionable Intelligence - The trader can now scan the panel in seconds and know:

Where price is in each channel 

Whether volatility is expanding or contracting

What action to take (actionable signal column)

Trend quality (TPS)

Squeeze conditions (VCS)

This transforms the panel from a data display into a decision support system.

Stop hopping timeframes. Start trading with institutional insights and clarity. Due to character limitation and proprietory architecture confidentiality, we have not disclosed the entire 'How to' but reach out privately once you purchase with questions about aspects you wish to learn more about. For instance, the DIST (Distance) column is one of the most intuitive yet powerful features of Turtles Professional. It tells you exactly where price sits within the Donchian channel as a percentage, giving you instant context for breakout potential. 

The DIST column transforms the Donchian channel from a static line into a dynamic probability meter. It answers the question: "How close are we to a breakout?" with instant, colour-coded clarity. In Turtles Professional, you don't need to calculate where price sits in the channel, it's served to you on a silver platter, updated in real-time, across all timeframes. Position within the channel isn't just data, it's the foundation of every Turtle trade.

While all columns provide value, these five form the core decision-making engine:


- ACTION tells you WHAT TO DO

- VCS tells you WHEN it will happen

- DIST tells you WHERE you are

- TPS tells you IF it will continue

- BIAS tells you WHICH SIDE to trade


Master these five (ask for 'Read Me' after purchase), and you'll never be confused by the markets again.


© 2026 Ebrah.Ssali@Nnanda.com

Prodotti consigliati
MercariaPattern1-2-3 відстежує рух ціни, знаходить трьоххвильові структури 1-2-3 та підсвічує момент, коли сценарій підтверджується пробоєм ключового рівня. MercariaPattern1-2-3 tracks price movement, detects three-leg 1-2-3 structures and highlights the moment when the scenario is confirmed by a key level breakout. Індикатор збирає локальні свінги в компактну фігуру 0–1–2–3 , чекає підтвердженого пробою та будує стрілку входу з готовими рівнями SL/TP. The indicator combines local swings into a
Matreshka
Dimitr Trifonov
5 (2)
Matreshka self-testing and self-optimizing indicator: 1. Is an interpretation of the Elliott Wave Analysis Theory. 2. Based on the principle of the indicator type ZigZag, and the waves are based on the principle of interpretation of the theory of DeMark. 3. Filters waves in length and height. 4. Draws up to six levels of ZigZag at the same time, tracking waves of different orders. 5. Marks Pulsed and Recoil Waves. 6. Draws arrows to open positions 7. Draws three channels. 8. Notes support and re
The Expert Advisor and the video are attached in the Discussion tab . The robot applies only one order and strictly follows the signals to evaluate the indicator efficiency. Pan PrizMA CD Phase is an option based on the Pan PrizMA indicator. Details (in Russian). Averaging by a quadric-quartic polynomial increases the smoothness of lines, adds momentum and rhythm. Extrapolation by the sinusoid function near a constant allows adjusting the delay or lead of signals. The value of the phase - wave s
Overview The Market Perspective Structure Indicator is a comprehensive MetaTrader indicator designed to provide traders with a detailed analysis of market structure across multiple timeframes. It identifies and visualizes key price action elements, including swing highs and lows, Break of Structure (BOS), Change of Character (CHOCH), internal structures, equal highs/lows, premium/discount levels, previous levels from higher timeframes, and trading session zones. With extensive customization opt
Gartley Projections D
Oleksandr Medviediev
3 (2)
The indicator identifies the harmonic patterns (XABCD) according to developments of H.M.Gartley ( "Profits in the Stock Market" , 1935г). It projects D-point as a point in the perspective projection (specify ProjectionD_Mode = true in the settings). Does not redraw. When a bar of the working timeframe closes, if the identified pattern point has not moved during Patterns_Fractal_Bars bars, an arrow appears on the chart (in the direction of the expected price movement). From this moment on, the ar
Seconds Charts
Aleksandr Goryachev
Micro  ******************* Секундные графики MT5 ********************** Более точного инструмента для входа в сделку вы не найдёте. Входные параметры: Timeframe, sek - период построения графика, секунды Displayed bars - отображаемые бары Step of price levels, pp, 0-off - шаг отрисовки ценовых уровней, пункты Scale points per bar, 0-off - масштаб в пунктах на бар Show lines - отображение текущих уровней Show comment - отображение комментария Standard color scheme - стандартная цветовая сх
"Hunttern harmonic pattern finder" base on the dynamic zigzag with the notification and prediction mode This version of the indicator identifies 11 harmonic patterns and predicts them in real-time before they are completely formed. It offers the ability to calculate the error rate of Zigzag patterns depending on a risk threshold. It moreover sends out a notification once the pattern is complete. The supported patterns: ABCD BAT ALT BAT BUTTERFLY GARTLEY CRAB DEEP CRAB CYPHER SHARK THREE DRIV
Trade smarter, not harder: Empower your trading with Harmonacci Patterns This is arguably the most complete harmonic price formation auto-recognition indicator you can find for the MetaTrader Platform. It detects 19 different patterns, takes fibonacci projections as seriously as you do, displays the Potential Reversal Zone (PRZ) and finds suitable stop-loss and take-profit levels. [ Installation Guide | Update Guide | Troubleshooting | FAQ | All Products ] It detects 19 different harmonic pri
Overview Harmonic Patterns MT5 is a technical analysis indicator designed for the MetaTrader 5 platform. It identifies and displays harmonic price patterns, such as Butterfly, Cypher, Crab, Bat, Shark, and Gartley, in both bullish and bearish directions. The indicator calculates key price levels, including entry, stop loss, and three take-profit levels, to assist traders in analyzing market movements. Visual elements and customizable alerts enhance usability on the chart. Features Detects six ha
Hello My Dear Friend, im introduce about Binary Option Premium V8 it work, all currency pair 1 minute time frame, 1-5 minute expire 100% non repaint, no delay signal Alright. This indicator works on MT5 and is very easy to use. When you receive a signal from it, you wait for that candle with the signal to close and you enter your trade at the beginning of the next new candle. A red arrow means sell and a green arrow means buy. for easy identification of trade signal. Are you okay with that?  W
Ottieni l’indicatore AUX GRATUITO, il supporto EA e la guida completa, visita per favore – https://www.mql5.com/en/blogs/post/763955 Individua la tendenza. Leggi il pattern. Cronometra l'ingresso. 3 passaggi in meno di 30 secondi! Opera senza sforzo — nessuna analisi richiesta, il tuo assistente intelligente è pronto a semplificare il tuo flusso di lavoro Basta sovraccarico di grafici. Opera con fiducia utilizzando il rilevamento intelligente del bias. Compatibile con tutte le valute, criptova
L'indicatore Quadrato di Gann è uno strumento potente di analisi di mercato basato sull'articolo "Formula Matematica per le Previsioni di Mercato" scritto da W.D. Gann. Questo strumento utilizza concetti matematici e teorie di Gann per effettuare un'analisi precisa del mercato. Utilizza i quadrati di 144, 90, 52 e anche il quadrato di 9. Inoltre, integra il metodo del  per il quadrato di 9 e la sua relazione con canali e modelli stellari di quel quadrato. Manuale Utente e Applicazione: Prima di
WAPV Weis Wave Chart Forex
Eduardo Da Costa Custodio Santos
Il Weis Wave Chart Forex per MT5 è un indicatore di prezzo e volume. La lettura del prezzo e del volume è stata ampiamente diffusa tramite Richard Demille Wyckoff sulla base delle tre leggi da lui create: offerta e domanda, causa ed effetto e sforzo contro risultato. Già nel 1900 R.Wyckoff utilizzava la carta delle onde nelle sue analisi. Molti anni dopo, intorno al 1990, David Weis ha automatizzato il diagramma delle onde di R. Wyckoff e oggi vi portiamo l'evoluzione del diagramma delle onde di
Renko System
Marco Montemari
This indicator can be considered as a trading system. It offers a different view to see the currency pair: full timeless indicator, can be used for manual trading or for automatized trading with some expert advisor. When the price reaches a threshold a new block is created according to the set mode. The indicator beside the Renko bars, shows also 3 moving averages. Features renko mode median renko custom median renko 3 moving averages wicks datetime indicator for each block custom notification
ATrend
Zaha Feiz
4.82 (17)
"ATREND: Come funziona e come utilizzarlo" ### Come funziona L'indicatore "ATREND" per la piattaforma MT5 è progettato per fornire ai trader robusti segnali di acquisto e vendita utilizzando una combinazione di metodologie di analisi tecnica. Questo indicatore sfrutta principalmente l'Average True Range (ATR) per la misurazione della volatilità, insieme ad algoritmi di individuazione dei trend per identificare potenziali movimenti di mercato. Lascia un messaggio dopo l'acquisto e ricevi un rega
Cumulative Volume Delta MAX MTF Pro v3.0 - The Ultimate Volume-Based Trading Edge     One Indicator to Rule Them All: See What the Market REALLY Thinks   Stop guessing - Start knowing what institutional players are doing before price shows you. The CVD MAX MTF Pro indicator represents the pinnacle of volume analysis technology, transforming complex volume data into clear, actionable trading signals across multiple timeframes. This sophisticated tool doesn't just show you volume - it reveals th
Looking for a powerful yet lightweight swing detector that precisely identifies key market structure turning points? Want clear, reliable buy and sell signals that work across all timeframes and all instruments? Buy Sell Arrow Swing   MT5  is designed exactly for that—delivering accurate and efficient swing detection without complexity. This indicator clearly identifies Higher Highs (HH), Higher Lows (HL), Lower Highs (LH), and Lower Lows (LL) , allowing traders to visualize market structure, tr
The new update makes this indicator a complete tool for studying, analyzing and operating probabilistic patterns. It includes: On-chart Multi-asset percentage monitor. Configurable martingales. Twenty-one pre-configured patterns, including Mhi patterns and C3. An advanced pattern editor to store up to 5 custom patterns. Backtest mode to test results with loss reports. Trend filter. Hit operational filter. Martingale Cycles option. Various types of strategies and alerts. Confluence between patter
All about time and price by ICT. This indicator provides a comprehensive view of ICT killzones, Silver Bullet times, and ICT Macros, enhancing your trading experience.  In those time windows price either seeks liquidity or imbalances and you often find the most energetic price moves and turning points. Features: Automatic Adaptation: The ICT killzones intelligently adapt to the specific chart you are using. For Forex charts, it follows the ICT Forex times: In EST timezone: Session: Asia: 20h00-0
ENGLISH DESCRIPTION (MQL5 Standard Optimized) Product Name: Obsidian Forest Automaton AI (MT5) [Subtitle: Forest Structure | Obsidian Blade TEMA | Shield Safety] Introduction Obsidian Forest Automaton AI is a structural trend-following construct designed to navigate the market with the cold precision of an automaton. It builds a "Forest Structure" using Ichimoku Cloud , cuts through noise with the Obsidian Blade (TEMA) , and validates density with Standard Deviation . This creates a system that
Introduction to X3 Chart Pattern Scanner X3 Cherart Pattern Scanner is the non-repainting and non-lagging indicator detecting X3 chart patterns including Harmonic pattern, Elliott Wave pattern, X3 patterns, and Japanese Candlestick patterns. Historical patterns match with signal patterns. Hence, you can readily develop the solid trading strategy in your chart. More importantly, this superb pattern scanner can detect the optimal pattern of its kind. In addition, you can switch on and off individu
The Super Arrow Indicator provides non-repainting buy and sell signals with exceptional accuracy. Key Features No repainting – confirmed signals remain fixed Clear visual arrows: green for buy, red for sell Real-time alerts via pop-up, sound, and optional email Clean chart view with no unnecessary clutter Works on all markets: Forex, gold, oil, indices, crypto Adjustable Parameters TimeFrame Default:   "current time frame" Function:   Sets the time frame for indicator calculation Options:   Can
Gioteen Volatility Index (GVI) - your ultimate solution to overcoming market unpredictability and maximizing trading opportunities. This revolutionary indicator helps you in lowering your losing trades due to choppy market movements. The GVI is designed to measure market volatility, providing you with valuable insights to identify the most favorable trading prospects. Its intuitive interface consists of a dynamic red line representing the volatility index, accompanied by blue line that indicate
Delta Profile Volume
Teresinha Moraes Correia
Technical Description of the Indicator – Delta Profile for MetaTrader 5 The Delta Profile is an indicator developed for MetaTrader 5 focused on detailed analysis of volume flow within a defined range of candles. It organizes and displays information about the imbalance of positive volumes (associated with upward movements) and negative volumes (associated with downward movements) at different price levels. The result is a clear view of the chart points where the highest concentration of trades o
Tma Poc Gold
Ignacio Agustin Mene Franco
POC + TMA SCALPER GOLD - Expert Advisor Professional DESCRIPTION: Automated trading system designed specifically for XAU/USD, combining Point of Control (POC) with Triangular Moving Average (TMA) to identify high-volume and trending zones. It uses advanced risk management with dynamic trailing stops and an intelligent grid system. TECHNICA
Chanlun
Xiaonong Yu
The ChanLun or Chan theory is one of the most popular trading theories in China. But it seems like that it has little influence in western countries. Actually, the Chan Theory is based on a sophisticated mathematical model. The basic idea ChanLun is to simplify the bar chart by its model. With the help of ChanLun, a trader can analyze and predict the trend of future goods, stocks. In ChanLun, there are several basic elements called fractals, strokes, line segments and pivots . A trader should pa
Elliott Wave Trend was designed for the scientific wave counting. This tool focuses to get rid of the vagueness of the classic Elliott Wave Counting using the guideline from the template and pattern approach. In doing so, firstly Elliott Wave Trend offers the template for your wave counting. Secondly, it offers Wave Structural Score to assist to identify accurate wave formation. It offers both impulse wave Structural Score and corrective wave Structure Score. Structural Score is the rating to sh
Contact me for instruction, any questions! - Lifetime update free - Non-repaint - I just sell my products in Elif Kaya Profile, any other websites are stolen old versions, So no any new updates or support. Introduction Breakout Trend Scanner indicator works based on the Elliott Wave in technical analysis describes price movements in the financial market that are related to changes in trader sentiment and psychology and finds end of movement and breakout trend. The Elliott Wave pattern that is f
Prizmal Logic
Vladimir Lekhovitser
5 (1)
Segnale di trading in tempo reale Monitoraggio pubblico in tempo reale dell’attività di trading: https://www.mql5.com/it/signals/2353471 Informazioni ufficiali Profilo del venditore Canale ufficiale Manuale utente Istruzioni di configurazione e utilizzo: Apri manuale utente Questo Expert Advisor si basa su una strategia di trading guidata da regole. La strategia è orientata a identificare condizioni di mercato specifiche, anziché mantenere una presenza costante sul mercato. Il sistema
The   Fibonacci Confluence Toolkit   is a technical analysis tool designed to help traders identify potential price reversal zones by combining key market signals and patterns. It highlights areas of interest where significant price action or reactions are anticipated, automatically applies Fibonacci retracement levels to outline potential pullback zones, and detects engulfing candle patterns. Its unique strength lies in its reliance solely on price patterns, eliminating the need for user-define
Gli utenti di questo prodotto hanno anche acquistato
ARIPoint
Temirlan Kdyrkhan
ARIPoint is a powerful trading companion designed to generate high-probability entry signals with dynamic TP/SL/DP levels based on volatility. Built-in performance tracking shows win/loss stats, PP1/PP2 hits, and success rates all updated live. Key Features: Buy/Sell signals with adaptive volatility bands Real-time TP/SL/DP levels based on ATR Built-in MA Filter with optional ATR/StdDev volatility Performance stats panel (Success, Profit/Loss, PP1/PP2) Alerts via popup, sound, push, or email Cu
Azimuth Pro
Ottaviano De Cicco
5 (4)
LAUNCH PROMO Azimuth Pro price is initially set at 299$ for the first 100 buyers. Final price will be 499$ . THE DIFFERENCE BETWEEN RETAIL AND INSTITUTIONAL ENTRIES ISN'T THE INDICATOR — IT'S THE LOCATION. Most traders enter at arbitrary price levels, chasing momentum or reacting to lagging signals. Institutions wait for price to reach structured levels where supply and demand actually shift. Azimuth Pro maps these levels automatically: swing-anchored VWAP, multi-timeframe structure lines, an
Innanzitutto, vale la pena sottolineare che questo Strumento di Trading è un Indicatore Non-Ridipingente, Non-Ridisegnante e Non-Laggante, il che lo rende ideale per il trading professionale. Corso online, manuale utente e demo. L'Indicatore Smart Price Action Concepts è uno strumento molto potente sia per i nuovi che per i trader esperti. Racchiude più di 20 utili indicatori in uno solo, combinando idee di trading avanzate come l'Analisi del Trader del Circolo Interno e le Strategie di Tradin
Pointer Trend Switch — precision trend reversal indicator Pointer Trend Switch is a high-precision arrow indicator designed to detect key moments of trend reversal based on asymmetric price behavior within a selected range of bars. It identifies localized price impulses by analyzing how far price deviates from the opening level, helping traders find accurate entry points before a trend visibly shifts. This indicator is ideal for scalping, intraday strategies, and swing trading, and performs equa
L’indicatore evidenzia le zone in cui viene dichiarato interesse sul mercato , per poi mostrare la zona di accumulo degli ordini . Funziona come un book degli ordini su larga scala . Questo è l’indicatore per i grandi capitali . Le sue prestazioni sono eccezionali. Qualsiasi interesse ci sia nel mercato, lo vedrai chiaramente . (Questa è una versione completamente riscritta e automatizzata – non è più necessaria un’analisi manuale.) La velocità di transazione è un indicatore concettualmente nuo
TrendMaestro5
Stefano Frisetti
Attenzione alle truffe, questo indicatore e' distribuito esclusivamente su MQL5.com nota: questo indicatore e' per METATRADER5, se vuoi la versione per  METATRADER4 questo e' il link:   https://www.mql5.com/it/market/product/108106 TRENDMAESTRO ver 2.5 TRENDMAESTRO   riconosce un nuovo TREND sul nascere, non sbaglia mai. La sicurezza di identificare un nuovo TREND non ha prezzo. DESCRIZIONE TRENDMAESTRO identifica un nuovo TREND sul nascere, questo indicatore prende in esame la volatilita' i
RelicusRoad Pro: Sistema Operativo Quantitativo di Mercato 70% DI SCONTO ACCESSO A VITA (TEMPO LIMITATO) - UNISCITI A 2.000+ TRADER Perché la maggior parte dei trader fallisce anche con indicatori "perfetti"? Perché operano su Singoli Concetti isolati. Un segnale senza contesto è una scommessa. Per vincere serve CONFLUENZA . RelicusRoad Pro non è un semplice indicatore. È un Ecosistema Quantitativo completo . Mappa la "Fair Value Road", distinguendo tra rumore e rotture strutturali. Smetti di in
Native Channels
BeeXXI Corporation
5 (1)
This indicator recognizes all support and resistance levels. A number of unique high-performance techniques have been applied, which made the existence of this indicator possible. All formed channels are naturally visible: horizontal linear linear parabolic cubic (Polynomial 3 degrees - Wave) This is due to a bundle of approximating channels. The formed channels form "standing waves" in a hierarchical sequence. Thus, all support and resistance levels are visible. All parameter management is i
L'indicatore " Dynamic Scalper System MT5 " è progettato per il metodo di scalping, ovvero per il trading all'interno di onde di trend. Testato sulle principali coppie di valute e sull'oro, è compatibile con altri strumenti di trading. Fornisce segnali per l'apertura di posizioni a breve termine lungo il trend, con ulteriore supporto al movimento dei prezzi. Il principio dell'indicatore. Le frecce grandi determinano la direzione del trend. Un algoritmo per generare segnali per lo scalping sott
UZFX {SSS} Scalping Smart Signals MT5 è un indicatore di trading ad alte prestazioni non ridipinto progettato per scalper, day trader e swing trader che richiedono segnali accurati e in tempo reale in mercati in rapida evoluzione. Sviluppato da (UZFX-LABS), questo indicatore combina l'analisi dell'andamento dei prezzi, la conferma del trend e il filtraggio intelligente per generare segnali di acquisto e vendita ad alta probabilità su tutte le coppie di valute e tutti i timeframe. Caratteristich
Scalping Winning Signals Pro SWS
Muhammad Usman Siddique
5 (1)
UZFX SWS {Scalping Winning Signals} Pro v1.0 è un potente indicatore non ridipingente sviluppato da Usman Zabir (UZFX LABS) appositamente per scalper, day trader e swing trader alla ricerca di segnali di ingresso precisi in mercati in rapido movimento. Ideale per i trader che richiedono segnali affidabili e in tempo reale senza ritardi o false ridipinture. I MIEI INTERVALLI DI TEMPO CONSIGLIATI*: 30 M E OLTRE. {1H} È IL MIO PREFERITO. E I RISULTATI SONO SORPRENDENTI...! Le caratteristiche prin
Scalping Lines System MT5 - è un sistema di trading scalping specificamente progettato per il trading dell'oro, l'asset XAUUSD, su timeframe M1-M5. Combina indicatori per l'analisi di trend, volatilità e ipercomprato/ipervenduto, riuniti in un unico oscillatore per l'identificazione di segnali a breve termine. Tutti i parametri interni per le linee di segnale sono preconfigurati. Il parametro "Durata dell'onda di tendenza", che regola la durata di una serie di segnali nella direzione del trend
ARICoins
Temirlan Kdyrkhan
ARICoin is a powerful trading companion designed to generate high-probability entry signals with dynamic TP/SL/DP levels based on volatility. Built-in performance tracking shows win/loss stats, PP1/PP2 hits, and success rates all updated live. Key Features: Buy/Sell signals with adaptive volatility bands Real-time TP/SL/DP levels based on ATR Built-in MA Filter with optional ATR/StdDev volatility Performance stats panel (Success, Profit/Loss, PP1/PP2) Alerts via popup, sound, push, or email Cust
ARIScalping
Temirlan Kdyrkhan
ARIScalp is a powerful trading companion designed to generate high-probability entry signals with dynamic TP/SL/DP levels based on volatility. Built-in performance tracking shows win/loss stats, PP1/PP2 hits, and success rates all updated live. Key Features: Buy/Sell signals with adaptive volatility bands Real-time TP/SL/DP levels based on ATR Built-in MA Filter with optional ATR/StdDev volatility Performance stats panel (Success, Profit/Loss, PP1/PP2) Alerts via popup, sound, push, or email Cus
AriX
Temirlan Kdyrkhan
AriX Indicator for MT5 A powerful trend-following and signal-evaluation tool AriX is a custom MT5 indicator that combines Moving Averages and ATR-based risk/reward logic to generate clear buy/sell signals. It visualizes dynamic SL/TP levels, evaluates past trade outcomes, and displays win/loss statistics in a clean on-chart panel. Key features include: Buy/Sell signals based on MA crossovers ATR-based SL/TP1/TP2/TP3 levels with visual lines and labels Signal outcome tracking with real-time stat
Weis Wave with Alert MT5
Trade The Volume Waves Single Member P.C.
4.94 (17)
Rental/Lifetime Package Options and Privileges  Rent Monthly Six Months   Yearly/Lifetime Weis Wave with Speed with Alert+Speed Index x x x Manual  x x x Quick Set up Video x x x Blog x x x Lifetime Updates x x x Setup and Training Material x x Discord Access Channel "The SI traders"          x Rectangle Break Alert Tool      x How to trade with it:    http://www.tradethevolumewaves.com   ** If you purchase please contact me to setup your  : Training Room and  complete manual access.  Wei
The AX Forex Indicator MT5 is a sophisticated trading tool designed to provide traders with a comprehensive analysis of multiple currency pairs. This   powerful indicator   simplifies the complex nature of the forex market, making it accessible for both novice and experienced traders. AX Forex Indicator uses   advanced algorithms   to detect trends, patterns and is an essential tool for traders aiming to enhance their forex trading performance. With its robust features, ease of use, and reliabl
TPA True Price Action indicator reveals the true price action of the market makers through 100% non-repainting signals strictly at the close of a candle! TPA shows entries and re-entries, every time the bulls are definitely stronger than the bears and vice versa. Not to confuse with red/green candles. The shift of power gets confirmed at the earliest stage and is ONE exit strategy of several. There are available now two free parts of the TPA User Guide for our customers. The first "The Basics"
Trend deviation scalper
Ekaterina Saltykova
1 (1)
Trend deviation scalper - is the manual system to scalp choppy market places. Indicator defines bull/bear trend and it's force. Inside exact trend system also defines "weak" places, when trend is ready to reverse. So as a rule, system plots a sell arrow when bull trend becomes weak and possibly reverses to bear trend. For buy arrow is opposite : arrow is plotted on bear weak trend. Such arrangement allows you to get a favorable price and stand up market noise. Loss arrows are closing by common p
Presenting one-of-a-kind Gann Indicator for XAUUSD IQ Gold Gann Levels is a non-repainting, precision tool designed exclusively for XAUUSD/Gold intraday trading. It uses W.D. Gann’s square root method to plot real-time support and resistance levels, helping traders spot high-probability entries with confidence and clarity. William Delbert Gann (W.D. Gann) was an exceptional market analyst whose trading technique was based on a complex blend of mathematics, geometry, astrology, and ancient calcul
Piranha version 2
Maria Strudov
5 (1)
"Piranha" - an autonomous trading system that determines overbought and oversold levels on the chart. Red and blue zones represent overbought and oversold levels respectively. Entry points are marked with arrows: a downward arrow in the red zone for "sell" and an upward arrow in the blue zone for "buy". The Take profit level is indicated by the green moving average. Key features: Adjusting the Take profit level as the green moving average changes position. Averaging ability when a new market e
AlgoEAs Trend Dashboard V1 Indicator for MT5 Introduction: This is a Dashboard Indicator based on 7 built in Multi Timeframe indicators. This strategy gives Buy/Sell Ideas based on 9 trend states. Easy to view gas guage to view current trend. Has as optional Alerts to enable with 9 messages. Run on M15 chart, with M15, H1, and H4 indicator time frames. Great tool! Features: Non-Repainting Dashboard For Desktop MT5 Only, Works On Any Mt5 Pair Great for Intraday and Swing Trading Easy view gas
Big Player Range
Thalles Nascimento De Carvalho
5 (3)
BigPlayerRange – Il miglior indicatore per MT5 BigPlayerRange è considerato il miglior indicatore per Mini Indice e Mini Dollaro su MetaTrader 5. Questo strumento essenziale evidenzia le zone strategiche di azione dei grandi player, offrendo un’analisi tecnica istituzionale di altissima precisione. Come usare BigPlayerRange: Questo indicatore mostra zone di acquisto (linea verde) e di vendita (linea rossa). Quando il prezzo chiude fuori da queste aree, è probabile un movimento di tendenz
MetaForecast M5
Vahidreza Heidar Gholami
5 (3)
MetaForecast predice e visualizza il futuro di qualsiasi mercato basandosi sull'armonia dei dati dei prezzi. Sebbene il mercato non sia sempre prevedibile, se esiste un modello nei prezzi, MetaForecast può prevedere il futuro con la massima precisione possibile. Rispetto ad altri prodotti simili, MetaForecast può generare risultati più accurati analizzando le tendenze di mercato. Parametri di input Past size (Dimensione passata) Specifica il numero di barre che MetaForecast utilizza per creare
IVISTscalp5
Vadym Zhukovskyi
5 (6)
What's new about iVISTscalp5 forecast indicator (Version 10)? iVISTscalp5 is a unique nonlinear forecasting for a week ahead system for any financial instrument which executes fast scalping using time levels. iVISTscalp5 is a tool for easy study and understanding of financial market. 1) iVISTscalp5 forecast indicator has been completely rewritten into another programming language (C++), which has accelerated data loading and processing. As a result, a different graphical display of forecasts
Step into the world of Forex trading with confidence, clarity, and precision using Gold Indicator a next-generation tool engineered to take your trading performance to the next level. Whether you’re a seasoned professional or just beginning your journey in the currency markets, Gold Indicator equips you with powerful insights and help you trade smarter, not harder. Built on the proven synergy of three advanced indicators, Gold Indicator focuses exclusively on medium and long-term trends elimina
Silver Trade
Metin Erkamoglu
MATADOR SILVER – XAGUSD MT5 M5 Timeframe Scalp Signals MATADOR SILVER is a professional signal and decision-support indicator developed specifically for XAGUSD (Silver) scalping on the M5 timeframe , designed for real market conditions and disciplined execution. This indicator does NOT open, manage, or close trades automatically . It provides structured BUY & SELL signals , intelligent filtering, and alerts, allowing traders to execute trades using their own strategy and risk management rules .
Orderflow Scalp Pro v2.4   delivers institutional-grade trading intelligence through advanced volume analysis, dynamic VWAP calculations, real-time aggressive score monitoring, and precision arrow signals. This complete trading system transforms complex market data into clear, actionable signals for consistent profitability on 3-4 minute timeframes. Full Documentation: [Download PDF] Four Powerful Components in One System Volume Profile HeatMap with POC/VAH/VAL Transform your charts into inst
TriParity AfterShock PRO Scanner (NOWCAST built-in) TriParity AfterShock PRO Scanner is a discretionary MT5 market-filtering tool built on triangular parity (AB×BC≈AC). It helps you compress your watchlist and quickly identify high-quality “aftershock” regimes —short-lived distortion setups that can appear on lower timeframes after interbank correction flows. Important: This is NOT triangular arbitrage execution . Triangular arbitrage requires near-simultaneous 3-leg execution, ultra-low laten
LTL Long Trend Locator
Muhammad Usman Siddique
LTL Long Trend Locator v2.0 - Indicatore professionale per il trading di tendenza LTL Long Trend Locator aiuta i trader a individuare i momenti migliori per entrare e uscire dal mercato identificando tendenze forti e durature. Fornisce segnali chiari quando le tendenze iniziano e finiscono, aiutandoti a fare trading nella giusta direzione al momento giusto. Aiuta i trader a individuare tendenze di mercato forti e mostra esattamente dove piazzare le operazioni con livelli chiari di ingresso, st
Altri dall’autore
Cumulative Volume Delta (CVD) MA-X: Intelligent Order Flow Sentiment Tool Unlock the hidden mechanics of the market with the   Cumulative Volume Delta (CVD) MA-X . While standard volume indicators only tell you   how much   was traded, CVD MA-X tells you   W ho is winning   the battle between buyers and sellers When . By aggregating tick-level price action and volume distribution, this indicator provides a crystal-clear map of market conviction and exhaustion. The Trader’s Edge: Why CVD MA-X? Mo
The Ultimate Ichimoku MTF Dashboard: Your All-In-One Trading Edge Transform Your Trading with One Powerful Indicator Imagine having a professional trading assistant that monitors multiple timeframes simultaneously, identifies high-probability entries, warns you of potential reversals, and provides clear risk management guidance-all in one clean, intuitive display. That's exactly what the Ichimoku MTF Dashboard delivers.     Why This Isn't Just Another In
MTF Candlestick Patterns Detector : Your Ultimate Price Action Command Centre   In the fast-paced world of trading, missing a single reversal pattern can be the difference between a profitable week and a missed opportunity. The MTF Candlestick Patterns Detector is a professional-grade MQL5 indicator designed to scan, detect, and aggregate over 24 legendary candlestick patterns across all timeframes simultaneously. Stop hunting and guessing through charts. Let the algorithm bring the high-probabi
MTF WAD Simplified Indicator - Professional Trading Solution     Overview The MTF WAD Simplified is a sophisticated multi-timeframe volume-based indicator designed to track smart money flow across financial markets. By monitoring the Williams Accumulation/Distribution (WAD) across 8 different timeframes, this tool provides traders with unprecedented insight into institutional accumulation and distribution patterns.     Core Benefits for Traders     1. Smart Money Tracking - Detect Institutional
Critical Market Session Information with a Single Glance Stop juggling multiple tools and squinting at time zone converters. The SessionInfoDisplay Indicator is your new, indispensable trading co-pilot that puts real-time market intelligence directly on your chart.   What It Does: Your Essential Trading Dashboard   This intelligent indicator provides three critical pieces of information at a glance: 1. Real-Time Session Detection    - Automatically identifies which major financial session is act
FREE
MTF VWAP Indicator - Quick Overview   This indicator shows you where institutional money is flowing across multiple timeframes using Volume Weighted Average Price (VWAP) to identify high-probability trading zones.     What It Actually Does:     1. Tracks Smart Money Levels: - Shows Daily, Weekly, and Monthly VWAP lines where big players (banks, funds) are trading - Tells you if price is above or below these key institutional levels - Shows distance from VWAP as a percentage (tells you how extend
RSI v SMA MTF Indicator : Professional Trading Edge in One Tool   Summary The RSI v SMA MTF Indicator is a sophisticated, multi-timeframe momentum analysis tool that transforms the traditional RSI into a powerful, actionable trading system. By combining RSI slope analysis with SMA crossover signals, divergence detection, and real-time multi-timeframe confluence, this indicator provides traders with a more comprehensive view of market momentum across all relevant timeframes.     Core Utility an
Clr-Dynamic RSI v SMA Indicator: A Comprehensive Analysis of Features and Advantages The Clr-Dynamic RSI v SMA indicator represents a significant evolutionary leap in technical analysis tools, transforming the classic Relative Strength Index (RSI) from a potentially ambiguous oscillator into a sophisticated, multi-dimensional trading system. At its core, this indicator retains the mathematical foundation of the RSI, measuring the speed and change of price movements, but radically enhances its
Indicator Overview This is a sophisticated Multi-Timeframe (MTF) indicator that not only applies the classic Fisher Transform formula but integrates it into a comprehensive trading system featuring a real-time dashboard. The indicator excels at pinpointing reversals through advanced divergence detection and providing a clear, multi-timeframe view of market structure.     How It Works: Core Fisher Logic   1.   Normalization and Signal Generation         The indicator transforms price (using med
Cumulative Volume Delta MAX MTF Pro v3.0 - The Ultimate Volume-Based Trading Edge     One Indicator to Rule Them All: See What the Market REALLY Thinks   Stop guessing - Start knowing what institutional players are doing before price shows you. The CVD MAX MTF Pro indicator represents the pinnacle of volume analysis technology, transforming complex volume data into clear, actionable trading signals across multiple timeframes. This sophisticated tool doesn't just show you volume - it reveals th
MTF Connecting Fractals Multi-Timeframe Market Structure. One Glance. Real Decisions. MTF Connecting Fractals is not just another arrow-printing indicator. It’s a complete multi-timeframe market structure intelligence system designed to answer the most important trading questions in real time - clearly, visually, and without clutter. Built around fractals as objective structure anchors, this tool gives traders a decisive edge by combining price action, structural context, proximity risk, and
Multi-Timeframe Money Flow Index (MTF MFI) with Smart Divergence and Dashboard Unlock the flow of institutional money across every timeframe. Are you tired of guessing the trend only to be trapped by a sudden reversal? The Multi-Timeframe Money Flow Index (MTF MFI) is a professional-grade trading tool designed to provide a bird's-eye view of market liquidity and momentum. By aggregating volume-weighted data from W1 down to M1, this indicator eliminates noise and highlights high-probability tra
MTF Parabolic SAR Maximize your trading efficiency with the Multi-Timeframe Parabolic SAR Trend and Momentum Dashboard. Designed for serious traders who value clarity over clutter, this tool aggregates price action across six timeframes into a single, sleek visual interface.  By combining that reliable classic Parabolic SAR logic with advanced momentum scoring and risk assessment, this indicator transforms raw data into actionable trade signals.  The Strategic Edge: Why This Indicator? Most tra
Multi-Timeframes Heiken Ashi Dashboard : The Trend is your Friend Indeed Confluence Trading System     Transform Your Trading with Crystal-Clear Market Structure Visualization Tired of confusing charts and conflicting signals? The Multi-Timeframe Heiken Ashi Dashboard is your complete solution for professional-grade market analysis. This all-in-one indicator combines smoothed Heiken Ashi candles with an intelligent multi-timeframe panel to give you unprecedented clarity in any market condition
Hybrid BB-LRMA [Trend and Volatility Engine]   Master the markets with the Hybrid BB-LRMA, a professional-grade technical analysis tool that fuses the volatility-tracking power of Bollinger Bands (BB) with the hyper-responsive Linear Regression Moving Average (LRMA) to eliminate lag and pinpoint high-probability entries with arrow Signals   Why Hybrid BB-LRMA? Most moving averages are too slow, and Bollinger Bands alone can be noisy. The Hybrid BB-LRMA solves this by using a gradient-based LRMA
Hybrid FATL Fractal: Professional Digital-Signal Logic   Simplify the Complexity of Market Structure.   Unlock the power of digital signal processing combined with price action geometry. The Hybrid FATL Fractal is a professional-grade technical analysis tool designed to eliminate market noise and pinpoint high-probability institutional turning points. By merging the Fast Adaptive Trend Line (FATL) algorithm with Dynamic Fractal Breakout logic, this indicator provides a dual-layered filter that a
Volume Profile SAF - Institutional-Grade Volume-informed Market Structure Indicator     Unlock Professional Market Intelligence with less Effort   Stop guessing. Start seeing. The Volume Profile SAF (Set and Forget) transforms complex market structure analysis into crystal-clear, actionable trading signals that institutional traders pay thousands for. Experience the power of real-time volume profiling, value area tracking, and precision POC cross alerts - all in one lightweight, EA-ready indicat
Fisher Transform MTF Pro v4.03 Professional Multi-Timeframe Trading Decision System Fisher Transform MTF Pro turns complex multi-timeframe data into clear, actionable trade decisions in seconds. It answers instantly:  What’s the trend?  Where’s the entry?  How strong is the setup?  What are the risks?  Should I buy, sell, or wait?  The Edge   Zero-Line Filter (Trend Protection) Prevents counter-trend trades by default:  No buys above zero  No sells below zero This forces alignment with th
Hybrid Hull-LSMA : The Trend Meets Momentum Powerhouse Are you struggling with moving averages that are either too slow to react or too noisy to trust? The Hybrid Hull-LSMA is a solution, engineered to solve the "lag vs. noise" dilemma. By fusing the ultra-smooth Hull Moving Average (HMA) with the predictive Least Squares Moving Average (LSMA), this indicator delivers a high-definition view of market structure and entry timing. Why the Hybrid Hull-LSMA? Standard indicators follow the market; t
Filtro:
Nessuna recensione
Rispondi alla recensione