MA Deviation Gr
- Indicatori
- Versione: 1.0

MA Deviation
Overview This indicator displays the deviation rate between price and a moving average, and draws upper/lower bands using standard deviation.
Features
-
Deviation Rate Line – Displays how far the price has deviated from the moving average, expressed as a percentage.
- Formula: Deviation Rate = (Close / Moving Average × 100) − 100
-
Center Line – The moving average of the deviation rate.
-
Upper/Lower Bands – Statistical upper and lower boundaries calculated using standard deviation.
- Formula:
- Upper Band = Center Line + (Standard Deviation × Multiplier)
- Lower Band = Center Line − (Standard Deviation × Multiplier)
- Standard Deviation: double diff = RateBuffer[i - j] - CenterBuffer[i] / sum_sq_diff += diff * diff / StdBuffer[i] = MathSqrt(sum_sq_diff / period_for_calc)
- Formula:
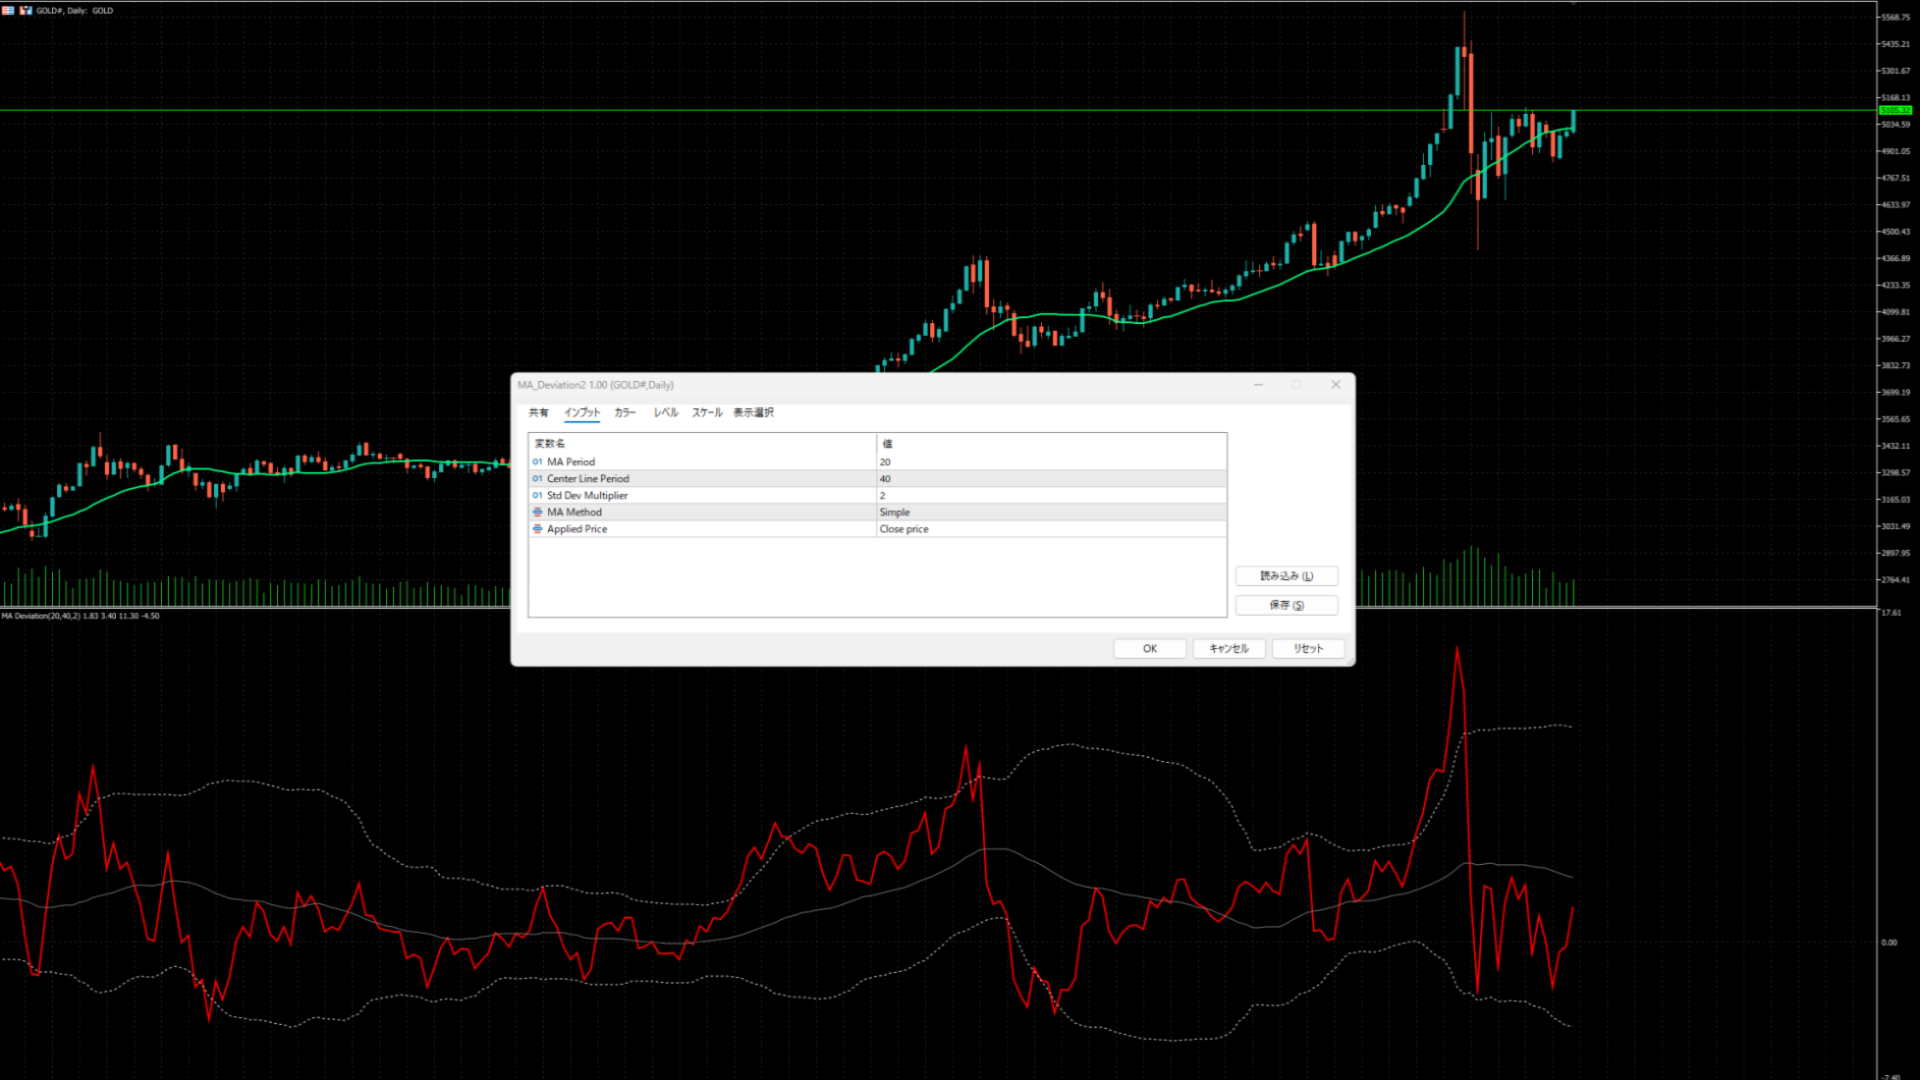
Parameters
- (MAPeriod) – Moving average period used as the basis for the deviation rate (default: 20)
- (Center Line Period) – Moving average period for the deviation rate (default: 40)
- (StdDevMultiplier) – Standard deviation multiplier for determining the upper/lower bands (default: 2)
- (MAMethod) – Select from SMA, EMA, SMMA, or LWMA (default: SMA)
- (AppliedPrice) – Select from Close, Open, High, or Low (default: Close)
How to Read
- Deviation Rate Line (red) – Shows how far the price is from the moving average.
- Positive value: price is above the moving average
- Negative value: price is below the moving average
- Center Line (gray) – The average of the deviation rate (not the same as the zero line).
- Upper/Lower Bands (white dotted lines) – Statistically overbought/oversold zones.
- Deviation rate crossing above the upper band: potential overbought condition
- Deviation rate crossing below the lower band: potential oversold condition
Trading Strategies
-
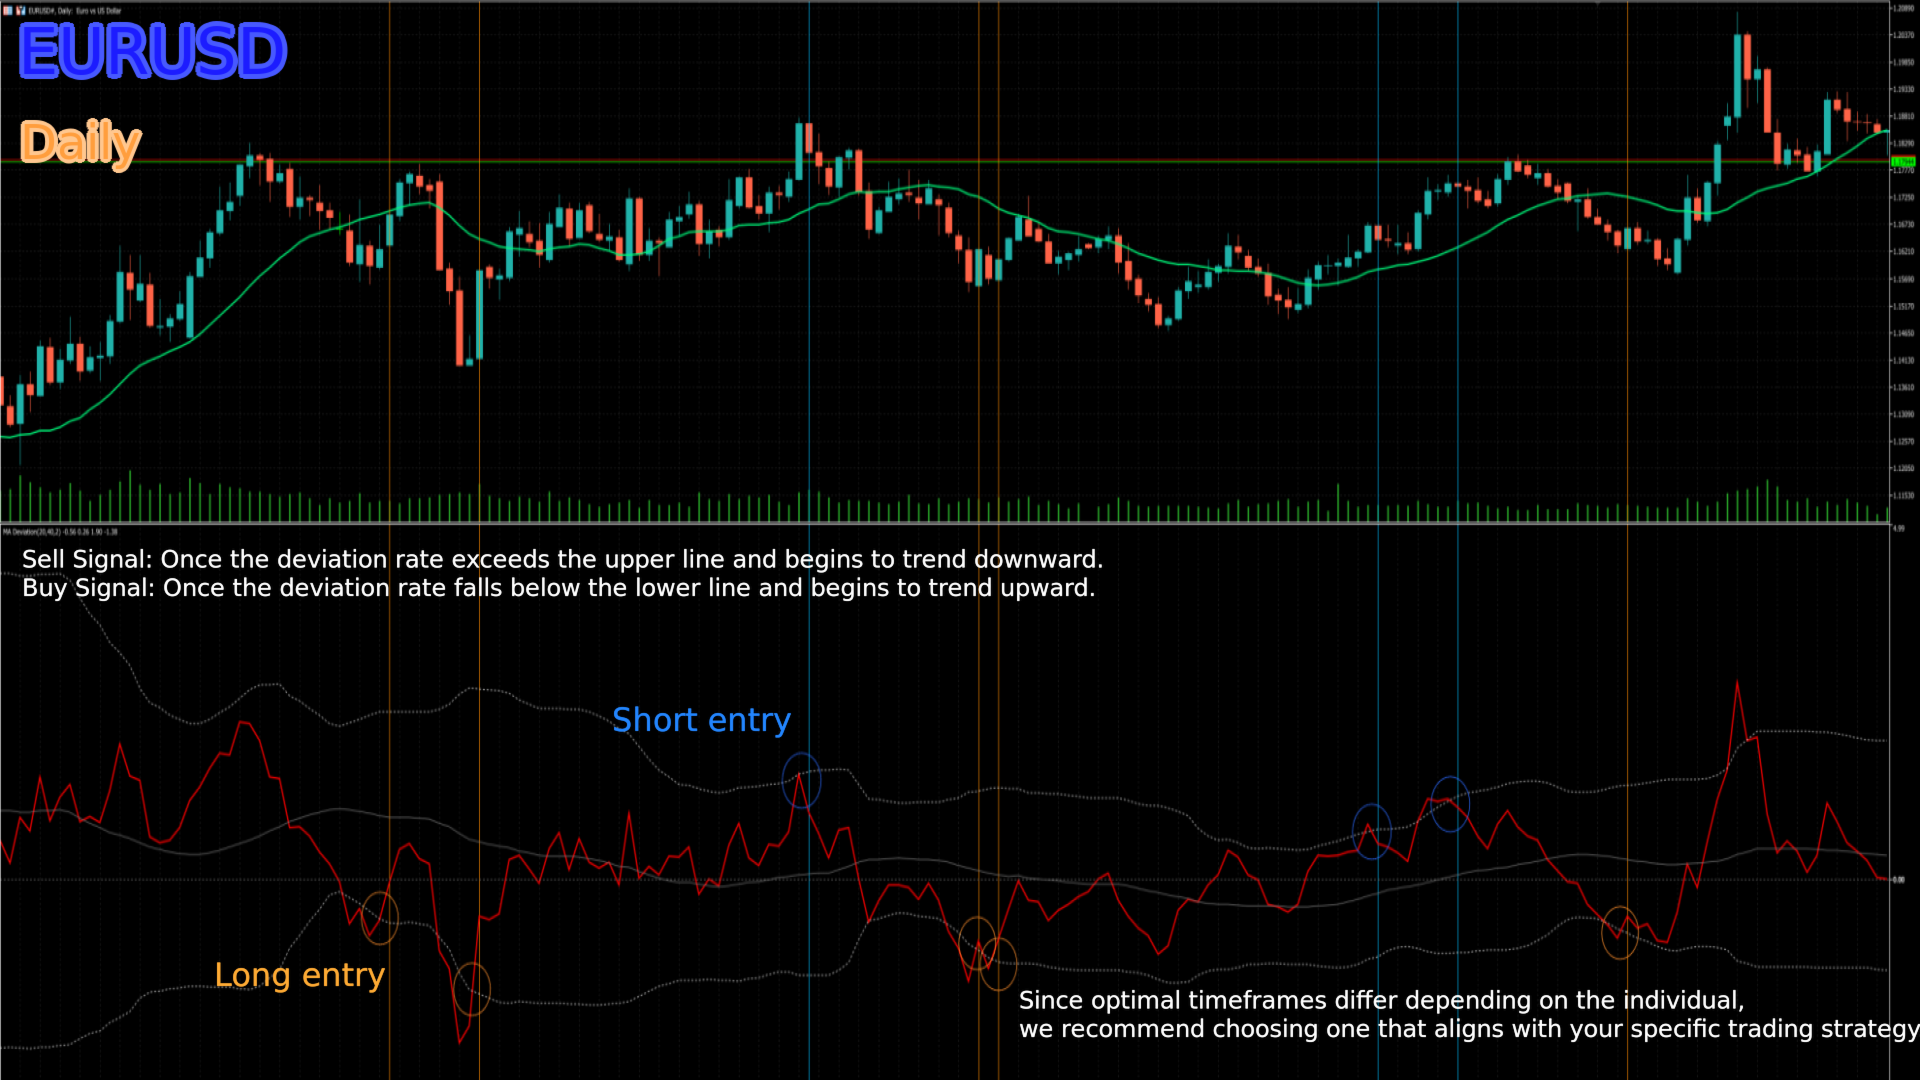
Mean Reversion Strategy
- Sell signal: after the deviation rate exceeds the upper band and then turns downward
- Buy signal: after the deviation rate falls below the lower band and then turns upward
-
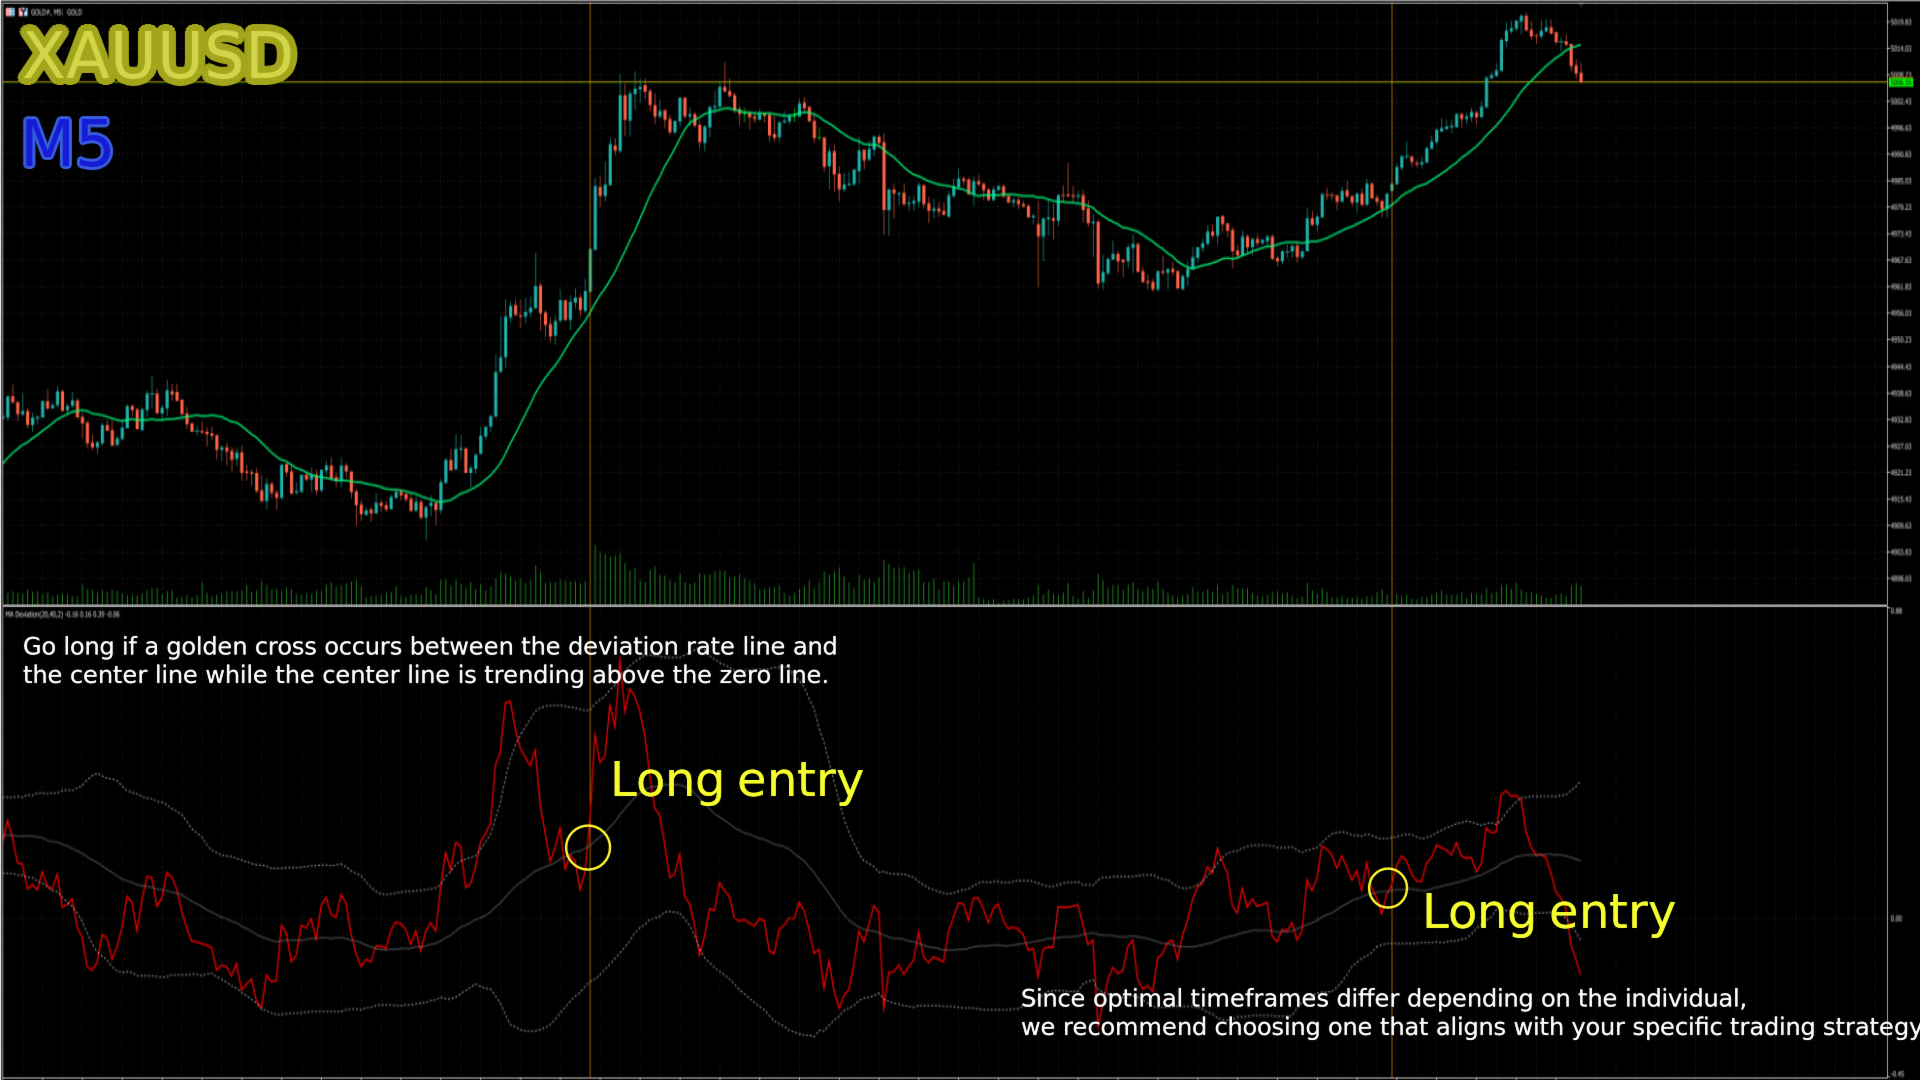
Trend Following Strategy
- During a strong uptrend, the deviation rate line may remain above the zero line.
- Buy signal: a golden cross between the center line and the deviation rate line while the center line is trading above the zero line
- Sell signal: a dead cross between the center line and the deviation rate line while the center line is trading below the zero line
Disclaimer
It is recommended to use this indicator in combination with other technical indicators rather than in isolation.
This is a statistical indicator based on historical data and does not guarantee future price movements.
It is important to backtest and find the settings that best suit your own trading style.