Pivot Points slim
- Indicatori
- Versione: 1.0

Pivot Point Slim Indicator
Overview
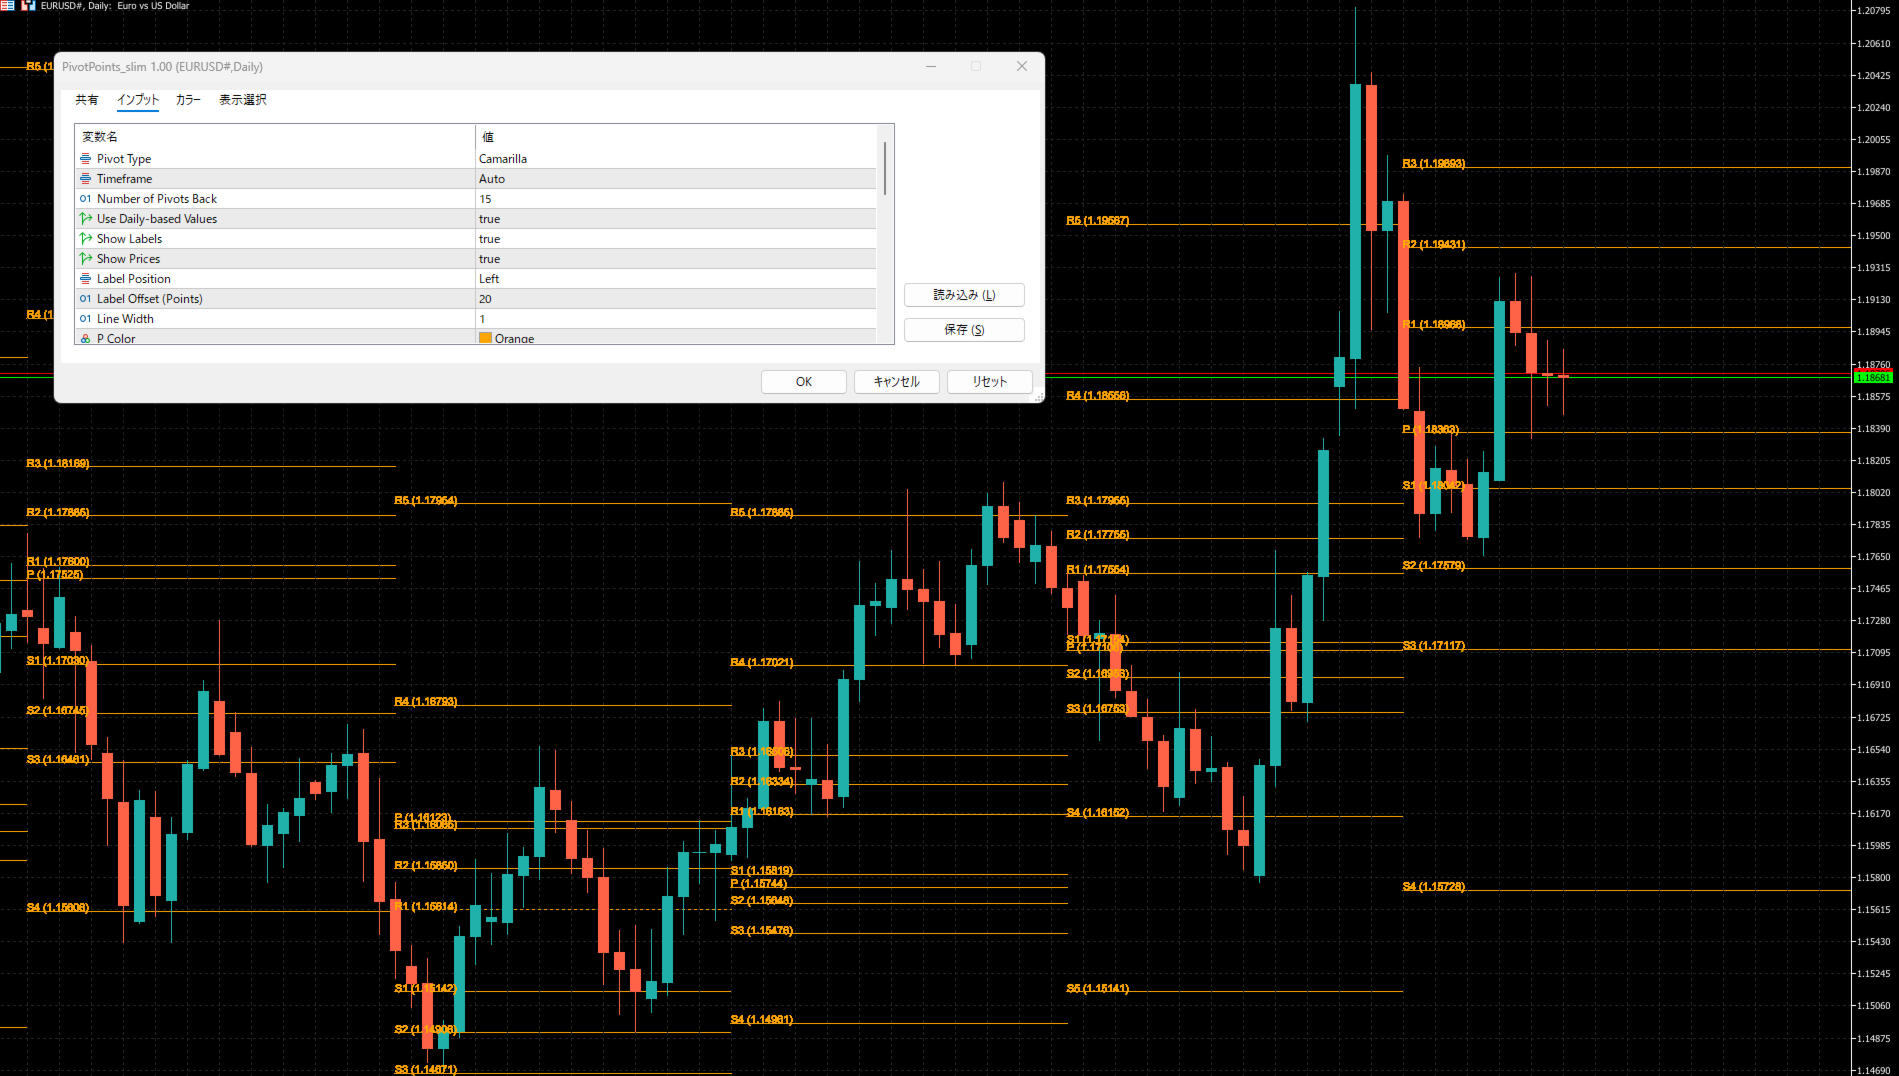
A professional-grade pivot point indicator equipped with 6 types of pivots. With a clean, easy-to-read design, it automatically displays important support and resistance levels on your chart.
Customizable Display Settings
- Individual color settings for each level (P, S1-S5, R1-R5)
- Show/hide toggle for each level
- Label display on/off
- Price display on/off
- Label position (left/right)
- Label offset adjustment (spacing between lines and text)
- Line width adjustment
- Historical display count (up to 15 periods)
Basic Parameters
- Pivot Type - Select pivot calculation method
- Traditional - The most common standard pivot calculation formula (S1-S5, R1-R5)
- 5 support and resistance levels
- Applicable to all trading styles
- Fibonacci - Pivots using Fibonacci ratios (S1-S3, R1-R3)
- Uses Fibonacci ratios (38.2%, 61.8%)
- 3 support and resistance levels
- Ideal for Fibonacci enthusiasts
- Woodie - Calculation formula emphasizing closing price (S1-S4, R1-R4)
- 4 support and resistance levels
- Suitable for day trading
- Classic - Classic pivot calculation formula (S1-S4, R1-R4)
- 4 support and resistance levels
- Adheres to traditional technical analysis
- DM (DeMark) - Calculation formula developed by Tom DeMark (S1, R1)
- 1 support and resistance level
- Simple and highly accurate
- Camarilla - Pivots for intraday scalping (S1-S5, R1-R5)
- 5 support and resistance levels
- Optimal for scalping and day trading
- Traditional - The most common standard pivot calculation formula (S1-S5, R1-R5)
Timeframe - Base timeframe for pivot calculation
- Auto (Automatic) - Automatically selects optimal pivot period based on chart timeframe
- 15 minutes or less → Daily pivots
- Over 15 minutes to less than daily → Weekly pivots
- Daily → Monthly pivots
- Daily - Pivots based on daily data
- Weekly - Pivots based on weekly data
- Monthly - Pivots based on monthly data
Number of Pivots Back - How many past periods of pivots to display (1-15)
Use Daily-based Values - Use daily-based values (Recommended: ON)
Display Settings
- Show Labels - Display level names (P, S1, R1, etc.)
- Show Prices - Display prices
- Label Position - Label display position (Left/Right)
- Label Offset - Vertical offset for labels (points)
- Line Width - Line thickness
Color Settings
Individual color and show/hide settings available for each level (P, S1-S5, R1-R5)
Notes
- The indicator updates in real-time
- If the indicator doesn't display, try changing the timeframe settings
- New levels are automatically drawn when a new pivot period begins
- Old pivots are saved up to the configured history count
- When Daily-based Values is turned on, daily data is used even on intraday charts
Disclaimer
This indicator is for educational and informational purposes only. Trading decisions are your own responsibility. Past performance does not guarantee future results.
Version History
- v1.00 Initial release
- 6 types of pivot calculation methods
- Automatic timeframe selection
- Fully customizable display settings