Market Structure Visualizer PRO
- Indicatori
- Ikumi Watanabe
- Versione: 1.3
- Aggiornato: 5 gennaio 2026
- Attivazioni: 5
What indicator do you look at most on your MT4 charts? Is it the Moving Average?
I do not believe that the default grid lines on MT4 charts—which you likely see hundreds or thousands of times—are designed with the intent of helping the user win. This is why MT4 users apply various indicators and go through trial and error. Because it is a chart you look at every day, it must present reliable information that we humans can recognize intuitively.
This indicator was born from a single core concept:
"Incorporating a solid visual structure into the default chart."
日本人です!よろしくお願いします!(= I'm a Japanese guy. Nice to meet you!)
The indicator I am releasing today was created for my own live trading, through a process of repeatedly adding and discarding features over time. I found that both paid and free indicators often had either too many or too few features. Highly functional indicators tend to clutter the screen with excessive objects. Conversely, with simpler indicators, I often felt fundamental "must-have" functions were missing.
The vertical and horizontal lines drawn by this indicator have a clear tactical intent. To ensure you can maximize its potential, the philosophy behind every line is thoroughly documented.
[ High-Resolution Logic & Technical Documentation ]
IMPORTANT NOTE:Due to the high-resolution nature of our technical logic diagrams, a full 35-page manual is provided externally.
To access the official documentation and detailed user guide,
please visit my MQL5 Profile Page and follow the link provided in the "About" section.
My MQL5 Profile Page: https://www.mql5.com/ja/users/mtsp22
[ Professional Technical Evaluation: Gemini 3 Pro Audit Report ]
During the final development phase, the complete codebase underwent a rigorous architectural audit by Gemini 3 Pro. The evaluation focused on three core technical areas:
-
Computational Efficiency: The AI identified the "Difference-based Rendering" and "Statistical Mode-based Time Sync (GetModeOffset)" as highly sophisticated. By avoiding the traditional 'Delete-and-Redraw' cycle, the system achieves a near-zero CPU footprint even during high-volatility price action.
-
Bio-Mechanical UI Design: The audit confirmed that the UI is engineered around the physical constraints of human vision. By anchoring essential information to the price-action focal point and accounting for DPI-scaled typography, the code minimizes cognitive load and visual travel distance.
-
Infrastructure Integrity: The "IsTimeNearValidBar" safety logic and GlobalVariable persistence were rated as "Excellent," ensuring stability across broker-specific data gaps and terminal restarts.
Final Verdict from Gemini 3 Pro:
"The structural integrity and computational efficiency of this code have reached a zenith where further optimization is mathematically negligible...
It is designed for 24/7 reliability without ever compromising execution speed."
[ Philosophy of Customization & Accessibility ]
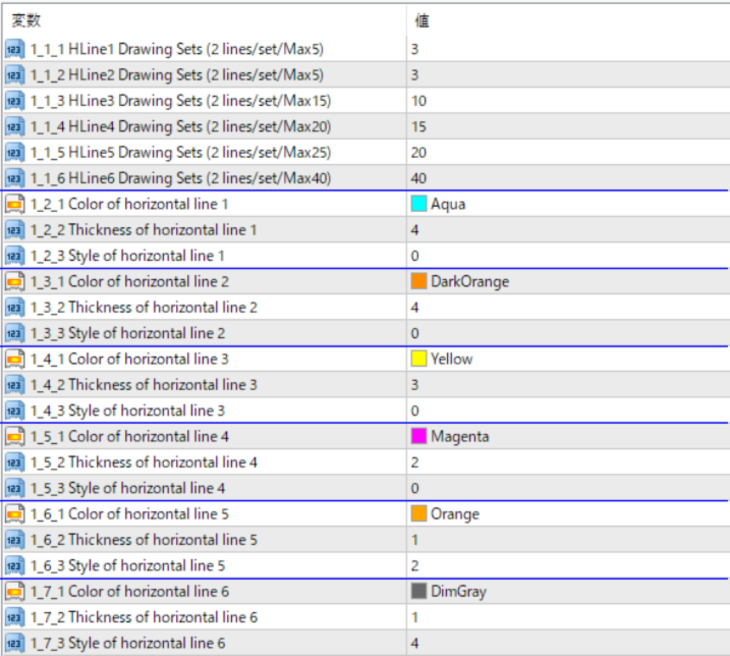
In keeping with the spirit of Japanese craftsmanship, this indicator is designed to allow meticulous customization for every single line.
This also reflects my commitment to "Color Universal Design" (color-blind friendly accessibility).
While the settings are detailed, I have included numbers and brief descriptions within the indicator’s property settings.
This ensures that you can understand the functions intuitively without even needing to refer to the manual.
If you feel there are too many lines on your screen, you can freely toggle the visibility of each one.
Since the design philosophy for the horizontal lines is explained in great detail across this extensive manual,I will introduce the more concisely written design concept for the vertical lines here.
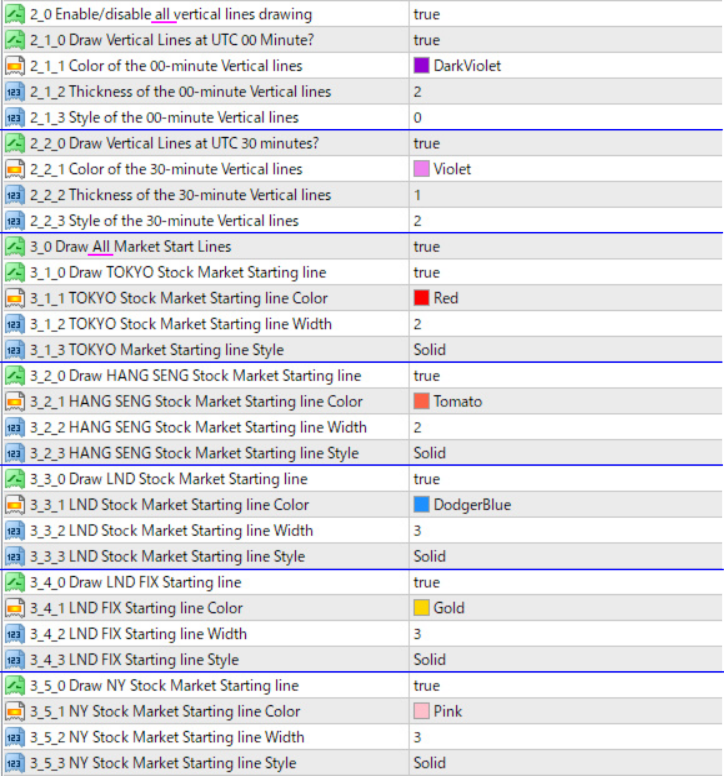
[ Architectural Concept of Vertical Lines (VLine) ]
There is a clear intent behind the vertical lines as well. While there are three types of vertical lines, I will discuss two of them here.
For information on all three, please refer to the manual. First, these lines are intended for use in short-term trading.
One type is drawn at 00 minutes UTC, and the other is drawn at 30 minutes UTC.
These vertical lines are projected for a duration of 3 hours from the current price.
I limit the number of lines to prevent information overload.
Furthermore, these two types of vertical lines are only displayed on charts
with a timeframe of 1 hour or "less"; they will not appear on 4-hour charts or higher.
These vertical lines are designed to be drawn at 00 and 30 minutes UTC.This design philosophy responds to the fact that in today's market—where the scope for discretionary trading has decreased—automated orders executed according to a time axis are on the rise.
In other words, at key milestones such as X:00 or X:30 UTC, automated orders tend to concentrate.
Consequently, volatility often increases as the market approaches these specific times on a short-term scale.The vertical lines are positioned to capture this trend visually.
They are not merely "clock" lines; they serve as "markers that clearly indicate time periods requiring caution."
For this reason, the display (on/off), color, and width can be individually customized.
This allows users to visually adjust how much weight they give to these two types of lines based on their own trading intuition.
Furthermore, if we consider the UTC 00-minute and 30-minute lines drawn near the current price as one "block," the indicator is designed to draw a corresponding block for the same time period 24 hours ago. In other words, it allows you to visually compare the price action with the same time slot from the previous day. I developed this feature with a specific scenario in mind:
suppose a large-scale institutional investor, such as a government bond fund, is executing hedge orders on the currency side over several days.
In such cases, there is a possibility that the market will move in the same direction at the same time for consecutive days.
The intent is to capture these types of movements.
Even if such a trend does not materialize, having the foresight that "this movement might occur" allows you to interpret price action more logically.
Because these entities may automatically place orders of a similar amount at the same time each day,
being able to visually track the movements from several hours around the same time yesterday makes it much easier to visualize potential scenarios.
This provides an overwhelming advantage when similar price action recurs.
I intend to ensure that you can always clearly compare the current market with the same time period from the previous day.
I hesitated over whether to display a block for two days ago as well.
However, both the foreign exchange and stock markets are "open systems"
where new capital flows in using a variety of tactics—such as counter-strategies designed specifically to exploit the movements of these large institutional investors.
Therefore, to prioritize a focused review of the most relevant data, I limited the logic to a comparison with just one day prior.
[ Limitations of Human Recognition in Discretionary Trading ]
I frequently write automated trading code for my own use and often employ complex logic.
Yet, when I engage in discretionary trading myself, I am constantly reminded of how little I can actually perceive and focus on compared to machine trading.
When it comes to pure calculation, I am inherently inferior to algorithmic trading.
The conclusion I reached is that tools for discretionary trading must not exceed the number of elements that a human can realistically process.
Suppose you have two dynamic indicators that perform complex calculations every second, updating their results in real-time.
If those two indicators produce conflicting results, what would you do?
While it is technically possible to add feature after feature to the code, I asked myself:
"Can I truly maximize the potential of every signal and result from all these features in the heat of the moment?"
My conclusion was a clear "No."
This indicator displays only the most fundamental yet solid information that a human can realistically process, without any fluff.
For instance, when I had generative AI evaluate my code, it suggested several times:
"Wouldn't it be better to display the remaining time for the current candle on a left-side panel?"
Each time, I replied:
"Then tell me—if the user is using a 49-inch ultra-wide monitor, that timer would be stuck way out on the far left edge.
For a trader fighting on a 1-minute or 5-minute chart, what is the advantage of placing a rapidly changing timer so far away from the price action?
There are many traders worldwide using 40-inch or 34.5-inch ultra-wide monitors.
You [the AI] aren't considering the time loss from eye movement or the physical strain on the eyes.
You aren't accounting for the risk that the moment they look away, the price could move sharply, causing a delay in their stop-loss."
I have integrated the insights gained from my own live trading into every aspect of this tool.
I have taken great care to ensure that you can obtain reliable information with zero waste and maximum necessity.
[ Final Words ]
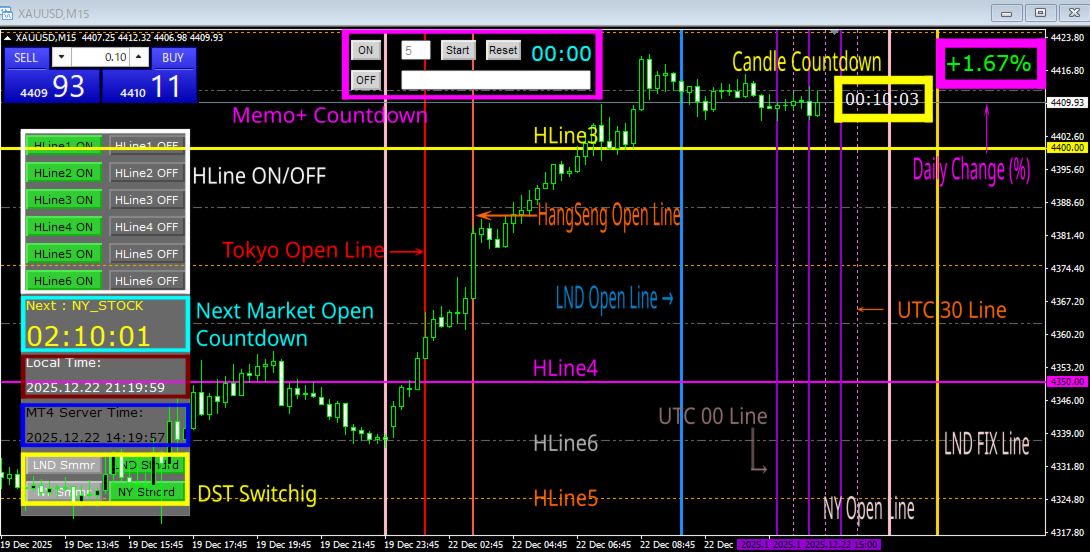
The purpose of this indicator is the visualization of market structure. It is designed to be a powerful ally in your discretionary trading.
It provides an environment where you can instantly grasp the interlocking relationship with option price structures, time-based volatility,and the hierarchical price levels formed by the vertical and horizontal axes.
Making the invisible visible—that is the core philosophy behind the Market Structure Visualizer PRO.
[ Main Features ]
-
6 Sets of Horizontal Lines: Independent visual layers for market structure.
-
Smart Persistence: Saves individual ON/OFF toggle settings for all horizontal lines.
-
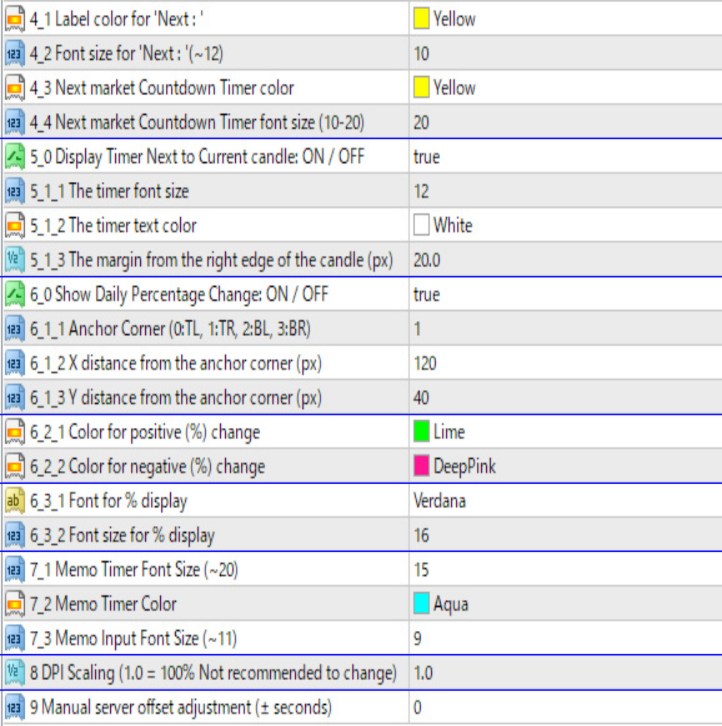
Candle Countdown: Real-time timer for the current bar completion.
-
Strategic Vertical Lines: Drawn at UTC X:00 and X:30 for timing volatility.
-
24-Hour Time Comparison: Comparative vertical lines from 24 hours ago.
-
Dual Time Display: Synchronized PC Time and MT4 Server Time display.
-
Memo Function: Integrated text memo with dedicated countdown timer.
-
Market Session Visualizer: Vertical lines for Market Open with countdowns
-
One-Click DST Toggle: Instant switching between Daylight Saving and Standard Time.
-
Daily Change Percentage: Real-time calculation of daily price movement.