Atlon

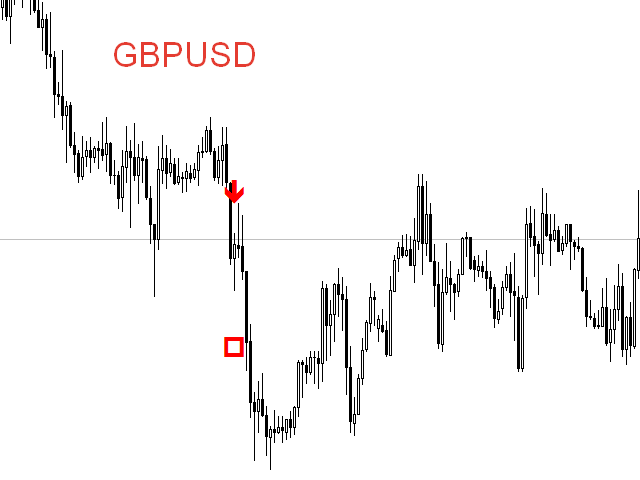
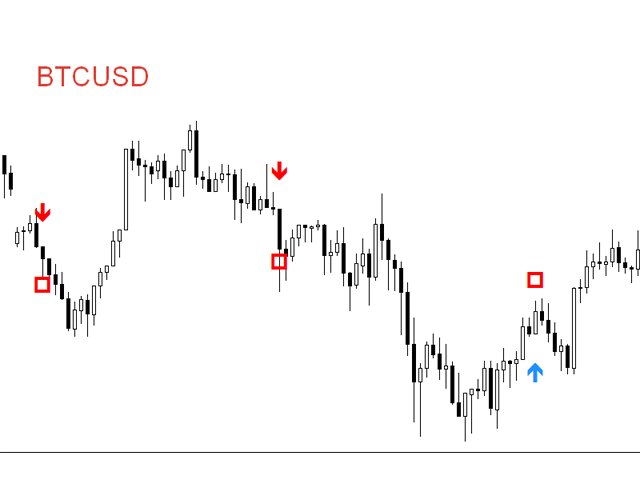
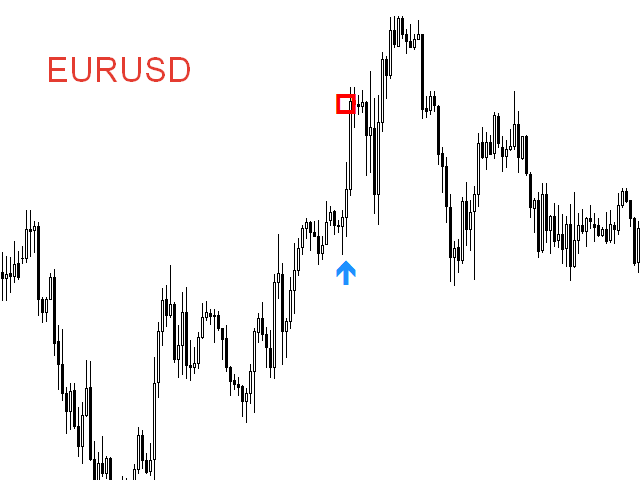
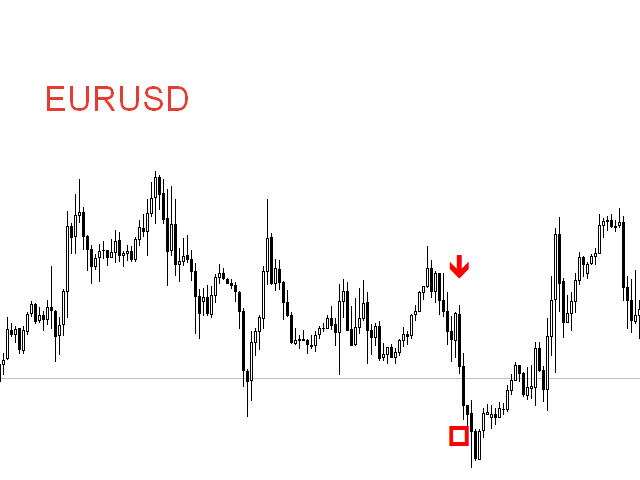
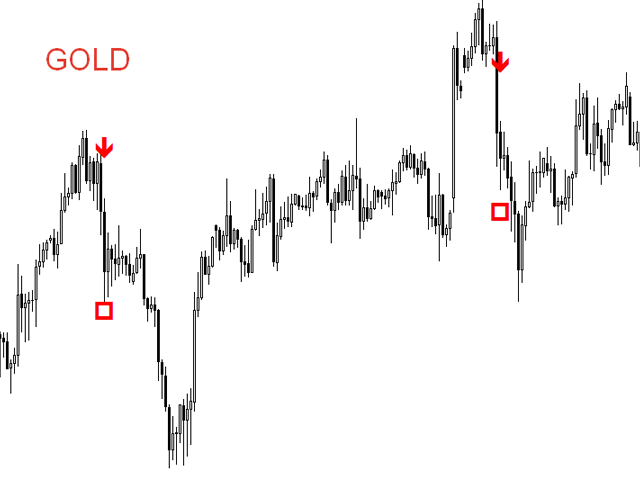
Signal complex Atlon is a ready-made trading system that sends signals in the form of arrows to e-mail and push notifications to your phone.

Atlon also displays ready-made TP levels in the form of red squares.

The system works on any chart (currency pairs, stocks, cryptocurrencies, metals, oil). Timeframe H1.

The system does not redraw and the arrows do not disappear anywhere.

The set includes ready-made settings that must be loaded before installing on the chart.

Download settings

System parameters:

Spectrum size in bars - Spectrum size in bars.

Spectrum size in points - Spectrum size in points.

Noise - Noise

Max bars - Maximum number of bars

Show TP - Show TP or not.

Filter TF - Use the selected timeframe for analysis.

Alert at display - Show signals on the chart

Push to mobile mt4 - Send signals to phone

Send mail - Send signals to e-mail


Prodotti consigliati
TradeLogic Pro – The Advanced MT4 EA for Long Term Investing TradeLogic Pro   is an advanced   MetaTrader 4 Expert Advisor (EA)   designed to harness the power of price imbalances in the forex trading markets. Whether you’re a beginner or a professional trader,   TradeLogic Pro   uses sophisticated market analysis to identify high-potential entry points, allowing you to trade smarter and more efficiently. How Does TradeLogic Pro Work? At the core of   TradeLogic Pro   is its ability to   detect
VR Cub
Vladimir Pastushak
VR Cub è un indicatore per ottenere punti di ingresso di alta qualità. L'indicatore è stato sviluppato per facilitare i calcoli matematici e semplificare la ricerca dei punti di ingresso in una posizione. La strategia di trading per la quale è stato scritto l'indicatore ha dimostrato la sua efficacia per molti anni. La semplicità della strategia di trading è il suo grande vantaggio, che consente anche ai trader alle prime armi di commerciare con successo con essa. VR Cub calcola i punti di apert
Power Renko MT4
Pierce Vallieres
Power Renko is an indicator which plots Renko bricks underneath the chart using a histogram. You can select the brick size and the timeframe of the Renko bricks as well as whether or not to use the close price or the high/low price of the candles. Renko bricks are based on price alone, not time, therefor the Renko bricks will not be aligned with the chart's time. They are extremely useful for trend trading and many different strategies can be formed from them. Buffers are provided allowing you t
Indicement MT4
Profalgo Limited
5 (2)
Benvenuti a Indicement! PROP FIRM PRONTO! -> scarica i file del set   qui PROMOZIONE DI LANCIO: Ne sono rimaste solo poche copie al prezzo attuale! Prezzo finale: 990$ NEW: Choose 1 EA for FREE! (limited to 2 trading account numbers) Offerta Combo Ultimate     ->     clicca qui UNISCITI AL GRUPPO PUBBLICO:   Clicca qui   VERSION 4.0 LIVE RESULTS OLD VERSION FINAL RESULTS INDICEMENT   mette a frutto i miei 15 anni di esperienza nella creazione di algoritmi di trading professionali per i mercati
Bigger chart labels would allow the user to be entirely aware of which chart he/she is on. Each chart window is unique, containing different patterns and economic motives so acknowledging the chart window would be absolutely essential! There are well known Economic Time Zones included in clear view, by choice!    Simple does it! Use your computing mouse scroller, clicking with the right finger on the label, in order to customize the label properties. From there, choose your preferred color, fon
FREE
GMMA Trade X is an EA based on GMMA. GMMA parameters such as MovingAveragePeriod1-24, MovingAverageMAShift1-24, MovingAverageShift1-24 and CandlestickShift1-24 can be adjusted. GMMA Trade X applies BTN TECHNOLOGY's state-of-the-art intelligent technology to help you create optimal results for your trades. May your dreams come true through GMMA Trade X. Good luck. = == == Inquiries = == == E-Mail:support@btntechfx.com
The indicator is designed to work on any trading platform. The program is based on proprietary algorithms and W.D.Ganna's mathematics, allowing you to calculate target levels of price movement based on three points with the highest degree of certainty. It is a great tool for stock trading. The indicator has three buttons: NEW - call up a triangle for calculation. DEL - delete the selected triangle. DELS - completely remove all constructions. The probability of achieving the goals is more than 80
The BLACK ZONE PREMIUM INDICATOR is a powerful all-in-one trading assistant built to bring clarity, precision, and consistency to forex trading. It combines multi-timeframe market structure, trade forecasting, risk management, and live monitoring into one professional-grade tool. From planning trades to managing them with discipline, this indicator equips traders with everything they need to make informed and confident decisions. If you’ve been looking for a professional solution that simplifies
Choch Pattern
Rodion Matveichuk
5 (1)
Профессиональный индикатор "Choch Pattern Levels" с RSI-фильтром для MT4 Описание: Вы устали от ложных пробоев и хотите находить точки разворота тренда с высокой точностью? Индикатор Choch Pattern Levels — это ваш профессиональный инструмент для определения смены характера рынка (Change of Character), дополненный мощным фильтром RSI и анализом объемов , чтобы вы входили в рынок только по самым надежным сигналам. Этот индикатор автоматически находит и отрисовывает на графике ключевые паттерны раз
FREE
PipFinite Exit EDGE
Karlo Wilson Vendiola
4.83 (115)
Did You Have A Profitable Trade But Suddenly Reversed? In a solid strategy, exiting a trade is equally important as entering. Exit EDGE helps maximize your current trade profit and avoid turning winning trades to losers. Never Miss An Exit Signal Again Monitor all pairs and timeframes in just 1 chart www.mql5.com/en/blogs/post/726558 How To Trade You can close your open trades as soon as you receive a signal Close your Buy orders if you receive an Exit Buy Signal. Close your Sell orders if
L'indicatore SMC Venom Model BPR è uno strumento professionale per i trader che operano nell'ambito del concetto di Smart Money (SMC). Identifica automaticamente due modelli chiave sul grafico dei prezzi: FVG   (Fair Value Gap) è una combinazione di tre candele, in cui c'è un gap tra la prima e la terza candela. Forma una zona tra livelli in cui non c'è supporto di volume, il che spesso porta a una correzione dei prezzi. BPR   (Balanced Price Range) è una combinazione di due modelli FVG che for
UR Vortex
Krzysztof Jan Debski
UR Vortex The Probabilistic UR Vortex Formula: An Accurate System for Predictive Market Analysis using Volatility and Standard Deviation Calculations. The   UR Vortex   indicator is a technical analysis tool that uses volatility and standard deviation calculations to predict potential tops and bottoms in a market. It measures the strength of a trend by calculating the distance between the current price and a moving average, and then standardizing this distance by dividing it by the average true
Koala Supply Demand
Ashkan Hazegh Nikrou
5 (2)
Presentazione dell'indicatore Koala Supply Demand per MetaTrader 4 (ti invitiamo a condividere la tua recensione o il tuo feedback, positivo o negativo, in modo che altri trader possano trarre vantaggio dalla tua esperienza.) : Benvenuti nell'indicatore Koala Supply Demand. Questo indicatore è progettato per identificare le zone di offerta e domanda ininterrotte. Questo indicatore può aiutare il trader a visualizzare il mercato come zone; è possibile vedere come il prezzo rispetti alcune potent
FREE
Auto Fibo Pro m
DMITRII GRIDASOV
Indicatore "Auto FIBO Pro" Crypto_Forex: è un ottimo strumento ausiliario nel trading! - L'indicatore calcola e posiziona automaticamente sul grafico i livelli di Fibo e le linee di tendenza locali (colore rosso). - I livelli di Fibonacci indicano le aree chiave in cui il prezzo può invertirsi. - I livelli più importanti sono 23,6%, 38,2%, 50% e 61,8%. - Puoi usarlo per lo scalping di inversione o per il trading di zone grid. - Ci sono molte opportunità per migliorare il tuo sistema attuale us
Gold Titan King Scalper
Dodong Christian Arnon
Indicator Description GOLD TITAN KING SIGNAL INDICATOR High-Precision Gold Scalping Buy/Sell Signals – Manual Trading Assistant Overview The Gold Titan King Signal Indicator is a manual trading assistant tool designed for high-frequency scalping on Gold (XAUUSD) and other major pairs. It generates clear BUY/SELL signals with precise entry levels, along with adjustable Stop Loss and Take Profit levels displayed directly on the chart. ️ This tool is NOT an EA. It does not execute trades
Gioteen Volatility Index (GVI)   - your ultimate solution to overcoming market unpredictability and maximizing trading opportunities. This revolutionary indicator helps you in lowering your losing trades due to choppy market movements. The GVI is designed to measure market volatility, providing you with valuable insights to identify the most favorable trading prospects. Its intuitive interface consists of a dynamic red line representing the volatility index, accompanied by blue line that indicat
Wolfe Wave Scanner MT4
Reza Aghajanpour
4.64 (11)
**  All Symbols  x  All Timeframes  scan just by pressing scanner button ** *** Contact me  to send you instruction and add you in "Wolfe Wave Scanner group" for sharing or seeing experiences with other users. Introduction: A Wolfe Wave is created with five-wave patterns in price. It shows supply and demand and a fight towards a balance price. T hese waves of price actions can help traders identify the boundaries of   the trend . Also  It helps forecast how the price will move in the near future
Cyber Engulf Indicator - Professional Trading System for MetaTrader 4 What is the Indicator? Cyber Engulf is an advanced technical analysis indicator that detects engulfing patterns filtered by moving average. It identifies trend reversal points, helping you spot changes in market structure early. What Does It Do? Automatically identifies engulfing candlestick patterns Filters out false signals using moving average Displays buy and sell signals with blue/up and red/down arrows Works across mult
FREE
Trade Direction
Gevorg Hakobyan
5 (1)
The oscillator shows trend direction using its own algorithm, which is based on calculating price values ​​by analyzing prices of separate currencies (original valuation of currencies). The histogram shows the average value of physical price change over the selected period. When the histogram has a positive value, the trend is rising, if negative - the trend id falling. The indicator uses standard RSI to determine the current market direction on a selected period as follows: the default value of
RSI TrendLine Divergency Message is an indicator for the MetaTrader 4 trading platform. Unlike the original indicator, this three in one version has a system of alerts that inform on market situation changes. It consists of the following signals: when the Main line crosses the levels of extreme zones and 50% level; when the Main line crosses the Trend line in the indicator window; divergence on the last bar. Parameters of levels of extremum, 50-level and divergence are adjustable. Parameters La
Introduction to Chart Pattern MT Chart Pattern MT is a chart pattern scanner to detect the triangle pattern, falling wedge pattern, rising wedge pattern, channel pattern and so on. Chart Pattern MT uses highly sophisticated chart pattern detection algorithm. However, we have designed it in the easy to use with intuitive user interface. Chart Pattern MT will show all the patterns in your chart in the most efficient format for your trading. You do not have to do tedious manual pattern detection an
Fourteen plus nine TD Sequential
MOHAMMED IMAD HUSSEIN BASSEE
Fourteen plus nine What is it for? Applying Tom DeMark’s TD Sequential serves the purpose of identifying a price point where an uptrend or a downtrend exhausts itself and reverses. . What are the main components of TD Sequential? TD Sequential has two parts – TD Setup and TD Countdown. The first phase of TD Sequential starts with a TD Setup and is completed with a 9 count. When the 9 count is completed, it is at that point, a price pause, price pullback, or reversal is likely. It is also at tha
Market Structure Zig Zag
Lesedi Oliver Seilane
4.66 (29)
Free Market structure zig zag to assist in price action trading the screenshots describe how to use and how to spot patterns new version comes with alerts, email alert and  push notification alert can be used on all pairs  can be used on all timeframes  you can add additional confirmation indicators the indicator shows you your higher high and low highs as well as your lower lows and lower highs  the indication makes price action analysis easier to spot.
FREE
Black Out EA
Jason Thato Hartley
Thank you for visiting us. We would like to introduce our new BLACK OUT EA which comes along with a moving average indicator for better trading This EA open and closes trades for you, no need to stress yourself. You can trade on any broker using any time frame . there are no restrictions!! You can easily increase your Lot size on the EA settings Backtest was done for two months. stay tuned for more !!!
Before enabling the automatic functions, please note that your EAs must include a small MQL code addition to communicate with the scheduler. I will guide you through the exact steps. If you are using EAs from other developers and you do not have access to their source code, you cannot add this integration. In that case, the scheduler can only be used in manual mode. Overview Alpha Trading Scheduler is an MT4 tool that helps control when automated trading is allowed inside one terminal. It does
Before
Nadiya Mirosh
The Before indicator predicts the most likely short-term price movement based on complex mathematical calculations. Most of the standard indicators commonly used in trading strategies are based on fairly simple calculations. This does not mean that there were no outstanding mathematicians in the world at the time of their creation. It is just that computers did not yet exist in those days, or their power was not enough for the sequential implementation of complex mathematical operations. Nowad
Forex Gump
Andrey Kozak
2.4 (5)
Forex Gump is a fully finished semi-automatic trading system. In the form of arrows, signals are displayed on the screen for opening and closing deals. All you need is to follow the instructions of the indicator. When the indicator shows a blue arrow, you need to open a buy order. When the indicator shows a red arrow, you need to open a sell order. Close orders when the indicator draws a yellow cross. In order to get the most effective result, we recommend using the timeframes H1, H4, D1. There
Next level of trend trading here. Possibility 75%, the indicator analyzes the current market to determine short (small dot), middle (circle with a dot inside) and long (cross with a circle and a dot inside) trends.  Wingdings characters of  Aqua color represents the beginning of the UP trend. Wingdings characters of  Orange color represents the beginning of the DOWN trend. Possibility 75% Indicator will improve your trading in the world of forex, commodities, cryptocurrencies and indices.
"Trend Finder" is a trend trading strategy that combines market noise filtration and all necessary functions in one tool! The system automatically displays entry and exit points using arrows. Only one parameter is sufficient for configuration. It offers simple, intuitively understandable, and effective trend detection. The intelligent algorithm of the "Trend Finder" indicator identifies potential market reversal points. Often, a good trend can be visually observed on the price chart. However, a
Automated Supply and Demand Trading Edge MT4   These videos demonstrate how we apply the supply and demand system to our latest trading review and market analysis.  US Tech 100 Index Trade Setup time laps 12/6/2023.  https://youtu.be/zHdjHnr3GNo   https://youtu.be/JJanqcNzLGM ,  https://youtu.be/l70MIHaQQa4 ,  https://youtu.be/pg0oiT5_8y0   Enhance your Trading Strategy with the Supply and Demand Trading Edge MT4. Gain a competitive market advantage with the Supply and Demand Trading Edge MT4
Gli utenti di questo prodotto hanno anche acquistato
Indicatore Miraculous – Strumento Forex e Binario 100% Non-Repaint Basato sul Quadrato di Nove di Gann Questo video presenta l' Indicatore Miraculous , uno strumento di trading altamente accurato e potente, sviluppato specificamente per i trader di Forex e Opzioni Binarie . Ciò che rende unico questo indicatore è la sua base sul leggendario Quadrato di Nove di Gann e sulla Legge della Vibrazione di Gann , rendendolo uno degli strumenti di previsione più precisi disponibili nel trading moderno. L
Presentiamo l'Indicatore F-16 Plane, uno strumento all'avanguardia per MT4 progettato per rivoluzionare la tua esperienza di trading. Ispirato alla velocità e alla precisione imbattibili dell'aereo da combattimento F-16, questo indicatore combina algoritmi avanzati e tecnologia all'avanguardia per offrire prestazioni senza precedenti sui mercati finanziari. Con l'Indicatore F-16 Plane, volerai al di sopra della concorrenza poiché fornisce analisi in tempo reale e genera segnali di trading estrem
Meravith
Ivan Stefanov
5 (1)
L'indicatore analizza il volume da ogni punto e calcola i livelli di esaurimento del mercato per quel volume. È composto da tre linee: Linea di esaurimento del volume rialzista Linea di esaurimento del volume ribassista Una linea che indica la tendenza del mercato. Questa linea cambia colore per riflettere se il mercato è rialzista o ribassista. Puoi analizzare il mercato da qualsiasi punto di partenza tu scelga. Una volta che una linea di esaurimento del volume è raggiunta, identifica un nuovo
L'indicatore " Dynamic Scalper System " è progettato per il metodo di scalping, ovvero per il trading all'interno di onde di trend. Testato sulle principali coppie di valute e sull'oro, è compatibile con altri strumenti di trading. Fornisce segnali per l'apertura di posizioni a breve termine lungo il trend, con ulteriore supporto al movimento dei prezzi. Il principio dell'indicatore. Le frecce grandi determinano la direzione del trend. Un algoritmo per generare segnali per lo scalping sotto fo
BinaryIndicator
Andrey Spiridonov
BinaryIndicator is a highly accurate indicator for trading binary options. It shows excellent results in scalping. This indicator is based in multifactor analysis of trend indicators, as well as confirmation oscillators, which in the end gives an increased accuracy of signals. Advantages of the indicator Increased accuracy of signals. Excellent results when trading binary options with a short expiration time from M30 to M1 . It works on any timeframes. Works with any trade symbols. Parameters
Gold Channel is a volatility-based indicator, developed with a specific timing algorithm for the XAUUSD pair, which consists of finding possible corrections in the market. This indicator shows two outer lines, an inner line (retracement line) and an arrow sign, where the theory of the channel is to help identify overbought and oversold conditions in the market. The market price will generally fall between the boundaries of the channel. If prices touch or move outside the channel it is a tradi
Everyone who purchases the Scalping signals M1 indicator receives a FREE BONUS — a fully automated Expert Advisor that trades based on the indicator’s signals. The indicator shows the arrows — the robot can execute the trades for you, following all signals and risk-management rules. Scalping signals M1 – a ready-made trend-following entry system for M1 Scalping signals M1 is an indicator that turns your chart into a clear action map: a colored trend channel shows the direction of the market, and
The Hurricane Indicator
Paul Nicholas Clevett
5 (1)
Currently switched to the 4 hour chart - but use other time frames for confirmation. :-)  I change my main time frame based on the market movement at the time. The Hurricane Forex Indicator is a multi time frame indicator that includes such things as Trade Notifications, Trade Calculator, Momentum Indicator, risk reward and much more. We have a free Trade room for our users as well. Please check out the video for full details of how this indicator works as it has over 15 years worth of developme
This indicator is a multifunctional technical analysis tool based on the combination of an adaptive exponential moving average and volatility filters calculated through the Average True Range (ATR). It is designed to accurately identify the current price direction, highlight key trend reversal areas, and visualize potential turning zones. The algorithm is built upon the dynamic construction of a trend ribbon using two levels of volatility — outer and inner ranges. The outer boundaries serve as i
Rtc ML Ai Predictor MT4
Muhammad Faisal Sagala
Rtc ML Ai | Predictor CORE MACHINE LEARNING ENGINE Adaptive ML Market Predictor – Multi-Bar Trend & Candle Forecast What This Indicator Does This indicator is a  real-time market prediction engine  designed to analyze price behavior and estimate  future market tendencies . Unlike conventional indicators, this system  does not rely on static parameters or historical curve-fitting , but adapts its internal state dynamically during live market operation. Instead of using static rules, the indic
FFx Engulfing Setup Alerter gives trade suggestions with Entry, Target 1, Target 2 and StopLoss. Below are the different options available: Entry suggestion - pips to be added over the break for the entry 3 different options to calculate the SL - by pips, by ATR multiplier or at the pattern High/Low 3 different options to calculate the 2 TPs - by pips, by ATR multiplier or at Risk/Reward Offset the dashboard - any place on the chart Remove the suggestion once the price reached the SL line Lines
FFx InsideBar Setup Alerter gives trade suggestions with Entry, Target 1, Target 2 and StopLoss. Below are the different options available: Entry suggestion - pips to be added over the break for the entry Minimum candle size - to avoid too close buy/sell entry suggestions 3 different options to calculate the SL - by pips, by ATR multiplier or at the pattern High/Low 3 different options to calculate the 2 TPs - by pips, by ATR multiplier or at Risk/Reward Offset the dashboard - any place on the c
FFx OutsideBar Setup Alerter gives trade suggestions with Entry, Target 1, Target 2 and StopLoss. Below are the different options available: Entry suggestion - pips to be added over the break for the entry. 3 different options to calculate the SL - by pips, by ATR multiplier or at the pattern High/Low. 3 different options to calculate the 2 TPs - by pips, by ATR multiplier or at Risk/Reward. Offset the dashboard - any place on the chart. Remove the suggestion once the price reached the SL line.
FFx PinBar Setup Alerter gives trade suggestions with Entry, Target 1, Target 2 and StopLoss. Below are the different options available: Entry suggestion - pips to be added over the break for the entry Minimum candle size - to avoid too small candles 3 different options to calculate the SL - by pips, by ATR multiplier or at the pattern High/Low 3 different options to calculate the 2 TPs - by pips, by ATR multiplier or at Risk/Reward Offset the dashboard - any place on the chart Remove the sugges
Automatic, live & interactive picture of all trendlines. Assign push, email and sound alerts to the lines of your choice and be informed about price rollback, breakout, rollback after breakout, number of rollbacks, line expiration by double breakout. Correct, drag or delete the lines and interactively tune the line system. https://youtu.be/EJUo9pYiHFA . Chart examples https: //www.mql5.com/en/users/efficientforex Price Interaction Events All events are effective immediately and only after one
The purpose of this new version of the MT4 standard indicator provided in your platform is to display in a sub-window multiple timeframes of the same indicator with its divergences. See the example shown in the picture below. But the display isn't like a simple MTF indicator. This is the real display of the indicator on its timeframe. Here's the options available in the FFx divergences indicator: Select the timeframes to be displayed (M1 to Monthly) Define the width (number of bars) for each tim
The purpose of this new version of the MT4 standard indicator provided in your platform is to display in a sub-window multiple timeframes of the same indicator with its divergences. See the example shown in the picture below. But the display isn't like a simple MTF indicator. This is the real display of the indicator on its timeframe. Here's the options available in the FFx divergences indicator: Select the timeframes to be displayed (M1 to Monthly). Define the width (number of bars) for each ti
The FFx Dashboard MTF alerter will show you on a single chart all the timeframes (M1 to Monthly) with their own status for the indicator. 2 Alert Options: Single timeframe: each selected timeframe alert separately when a signal occurs Multi timeframes: all selected timeframes must agree for an alert to be triggered Both options have an input to select the timeframes to be used for the alert(s). How to Understand the Status: Green/Red square: histogram above/below 0 line Green square + Red bord
The FFx Dashboard MTF alerter will show you on a single chart all the timeframes (M1 to Monthly) with their own status for the indicator. 2 Alert Options: Single timeframe: each selected timeframe alert separately when a signal occurs Multi timeframes: all selected timeframes must agree for an alert to be triggered Both options have an input to select the timeframes to be used for the alert(s). How to understand the status: Green/Red square: RSI above/below 50 line Green square + Red border: R
The FFx Dashboard MTF alerter will show you on a single chart all the timeframes (M1 to Monthly) with their own status for the indicator. 2 Alert Options: Single timeframe: each selected timeframe alert separately when a signal occurs Multi timeframes: all selected timeframes must agree for an alert to be triggered Both options have an input to select the timeframes to be used for the alert(s). How to understand the status: Green/Red square: Stoch above/below 50 line Green square + Red border:
The FFx Dashboard MTF alerter will show you on a single chart all the timeframes (M1 to Monthly) with their own status for the indicator. 2 Alert Options: Single timeframe: each selected timeframe alert separately when a signal occurs Multi timeframes: all selected timeframes must agree for an alert to be triggered Both options have an input to select the timeframes to be used for the alert(s). How to understand the status: Green/Red square: Price above/below Cloud (Kumo) Green square + Red bo
The FFx Dashboard MTF alerter will show you on a single chart all the timeframes (M1 to Monthly) with their own status for the indicator. 2 Alert Options: Single timeframe: each selected timeframe alert separately when a signal occurs Multi timeframes: all selected timeframes must agree for an alert to be triggered Both options have an input to select the timeframes to be used for the alert(s). How to understand the status: Green/Red square: MA pointing Up/Down Green square + Red border: MA po
The FFx Dashboard MTF alerter will show you on a single chart all the timeframes (M1 to Monthly) with their own status for the indicator. 2 Alert Options: Single timeframe: each selected timeframe alert separately when a signal occurs. Multi timeframes: all selected timeframes must agree for an alert to be triggered. Both options have an input to select the timeframes to be used for the alert(s). How to understand the status: Green square: Price above PSAR Red square: Price below PSAR Options
The FFx Dashboard MTF alerter will show you on a single chart all the timeframes (M1 to Monthly) with their own status for the indicator. 2 Alert Options: Single timeframe: each selected timeframe alert separately when a signal occurs Multi timeframes: all selected timeframes must agree for an alert to be triggered Both options have an input to select the timeframes to be used for the alert(s). How to understand the status: Green/Red square: CCI above/below levels (ie. 100/-100) Grey square: C
The FFx Dashboard MTF alerter will show you on a single chart all the timeframes (M1 to Monthly) with their own status for the indicator. 2 Alert Options: Single timeframe: each selected timeframe alert separately when a signal occurs Multi timeframes: all selected timeframes must agree for an alert to be triggered Both options have an input to select the timeframes to be used for the alert(s). How to understand the status: Green/Red square: ADX above level Grey square: ADX below level Red bor
The FFx Dashboard MTF alerter will show you on a single chart all the timeframes (M1 to Monthly) with their own status. 2 Alert Options: Single timeframe: each selected timeframe alert separately when a signal occurs Multi timeframes: all selected timeframes must agree for an alert to be triggered Both options have an input to select the timeframes to be used for the alert(s). How to understand the status: Green/Red square: bullish/bearish candle Options available in the FFx Dashboard Alerter
The [GRAFF] III manual trading system is based on multiple MetaTrader (MT4) indicators. Together, the entire PACK of GRAFF III indicators makes an advanced trading tool. The system consists of over 20 different custom-built indicators which have been carefully selected and tested in the long term to produce strong and efficient trading signals. The particular indicators are based on different mathematical formulas, so the entire system is calibrated to remove false signals from its own indicator
Altri dall’autore
The newest indicator for binary options. The indicator looks for large market turns and gives out qualitative signals for 2 candles ahead. The indicator also works on Forex, but was developed initially under binary options. After the appearance of the arrow, you receive a notification by e-mail, PUSH notification to the phone or an allert at the terminal. Signals appear at the beginning of the new bar. Timeframe 1 hour. Expiration period 2 candles. More than 75% of signals are closed in posi
The GENEVA trading system this is a tool that can conduct a comprehensive analysis of the Forex market, stock market, and cryptocurrency market. With this tool, you will receive ready-made signals to enter the market. Let's see what the system looks like: To begin with, the system is exclusively trend-based, which means that you are already in a winning situation, because you only work on the trend. The system has its own trend/flat analyzer built in. This means that during lateral movement,
Filtro:
Nessuna recensione
Rispondi alla recensione