Gann Zone Pro
- Indicatori
-
Kirill Borovskii
 My name is Kyril Borovsky and I provide professional services to teach methods of W.D.Ganna and give expert advice on trading in the forex market, which allow clients to achieve the planned financial goals. I also offer software based on years of experience and knowledge of the methods of the
 - Versione: 1.1
- Aggiornato: 15 marzo 2024
- Attivazioni: 5
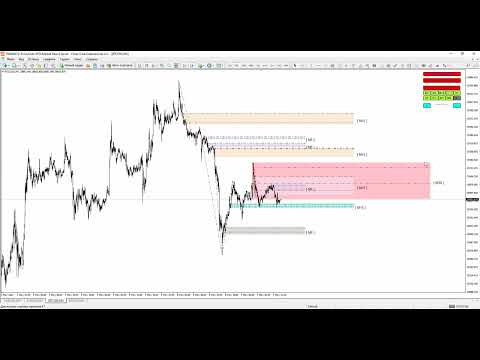
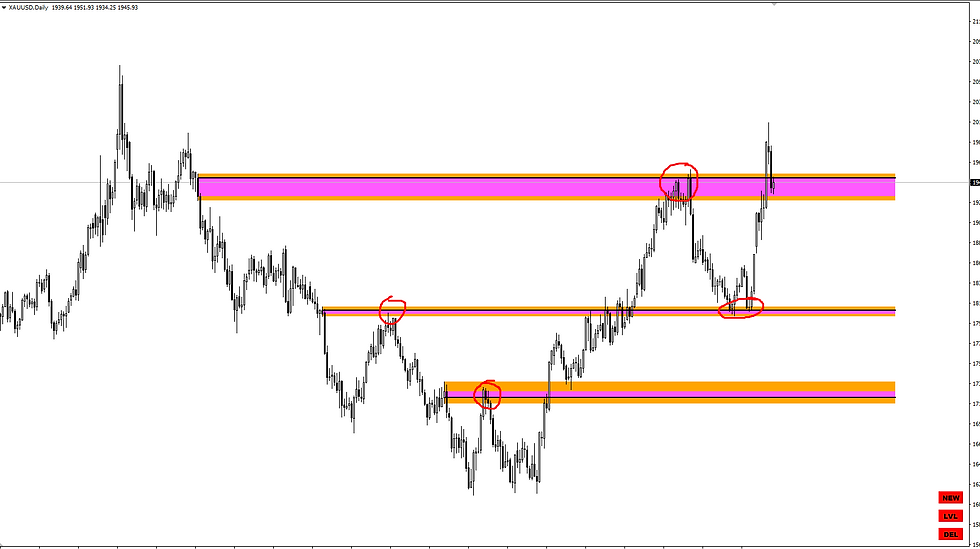
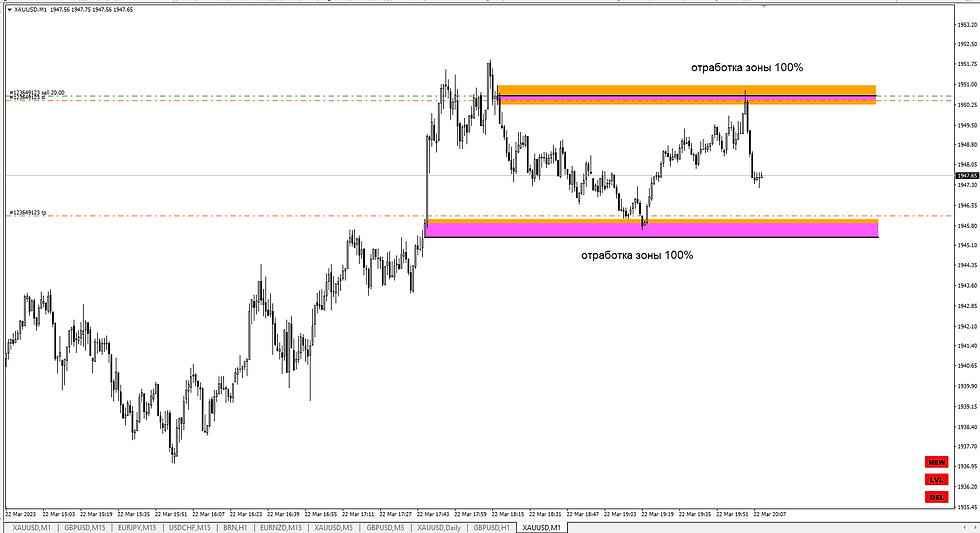
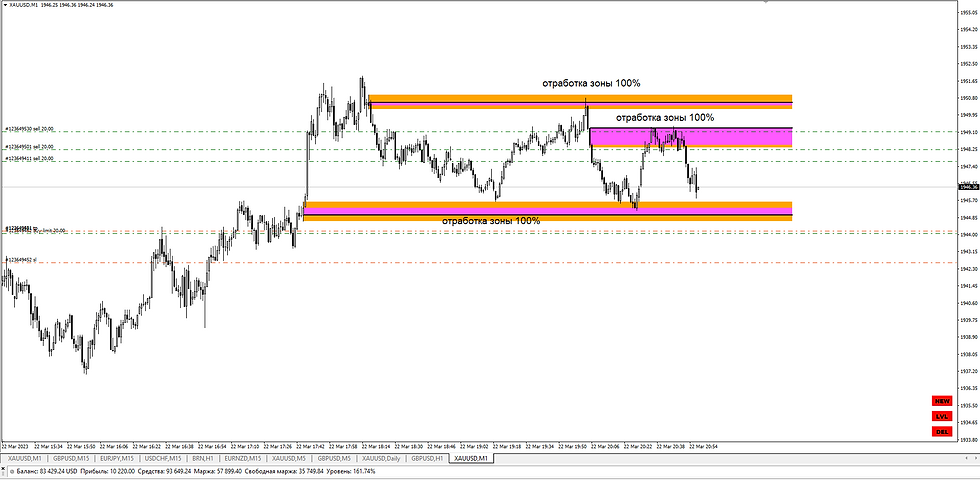
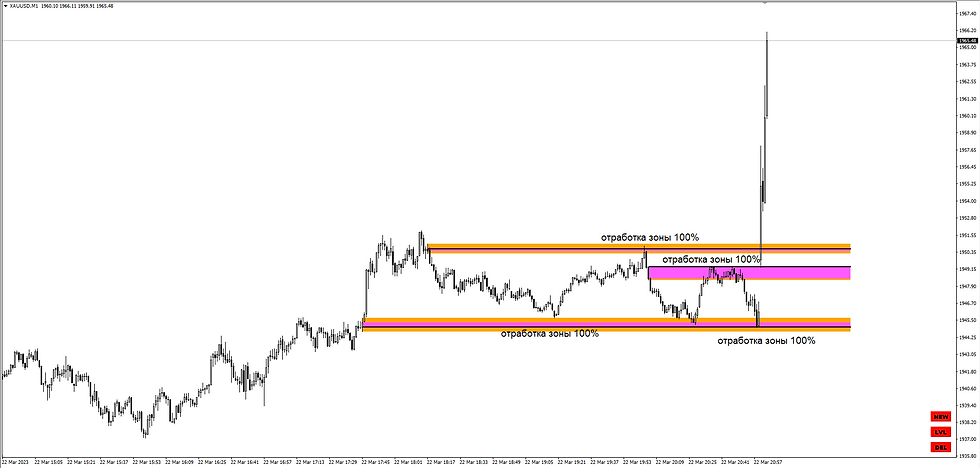
This indicator identifies and displays zones, as it were areas of strength, where the price will unfold. The indicator can work on any chart, any instrument, at any timeframe. The indicator has two modes. The indicator is equipped with a control panel with buttons for convenience and split into two modes.
Manual mode:
To work with manual mode, you need to press the NEW button, a segment will appear. This segment is stretched over the movement and the LVL button is pressed. The level is displayed.
Automatic mode:
To automatically build levels, you need to select the timeframe (or several) of interest by pressing the necessary buttons. Then start the AVTO button. All levels will be drawn at the end of the graph in the future.
Description of buttons:
Show Levels Panel : By double-clicking, you can display or hide the panel of buttons. In collapsed form, this button can be moved around the chart to a convenient location for you.
NEW : Creates a new segment for determining the level manually.
LVL : Creates the level.
MOD : Deletes the selected level. (Click on the button, click on the selected level)
CUT : Trims the level to the desired size. (Click on the button, click on the level in the place where you want to trim the level)
DEL : Deletes levels
RL : Displays levels only in the future starting from the last bar or from the place where the level was found by automatic calculation.
+/- : Adds levels above and below.
This indicator can be used both as a standalone trading product (trading from zones) and as an addition to your trading strategy.