Support and Resistance Algorithm
- Indicatori
- Versione: 1.0
- Attivazioni: 5

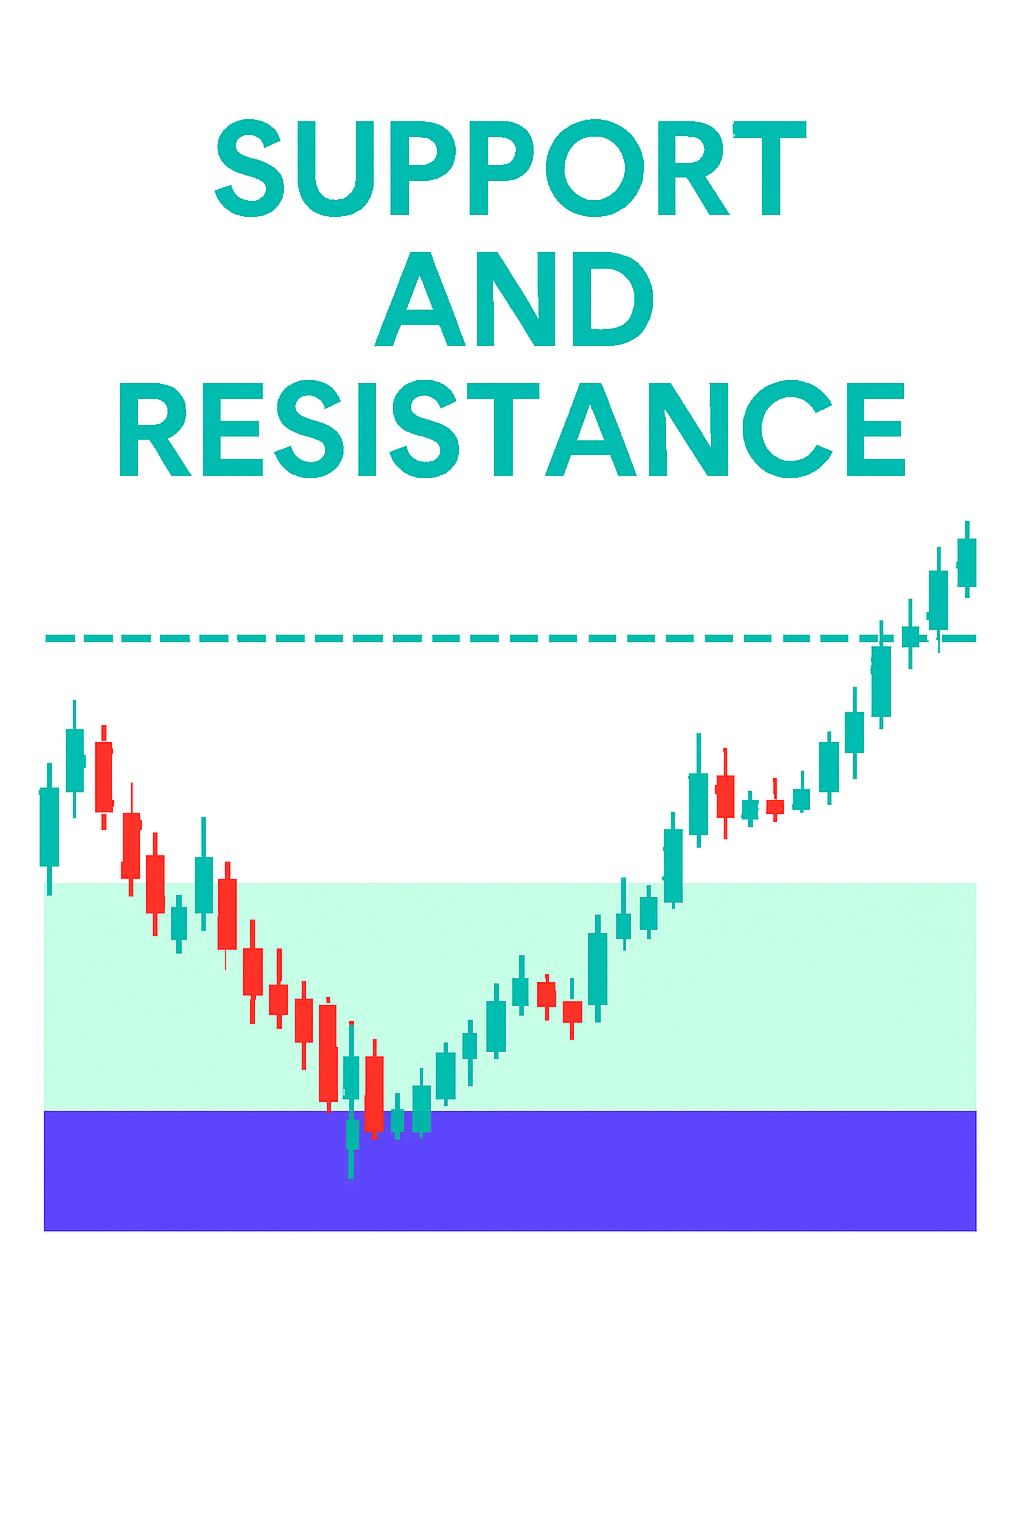
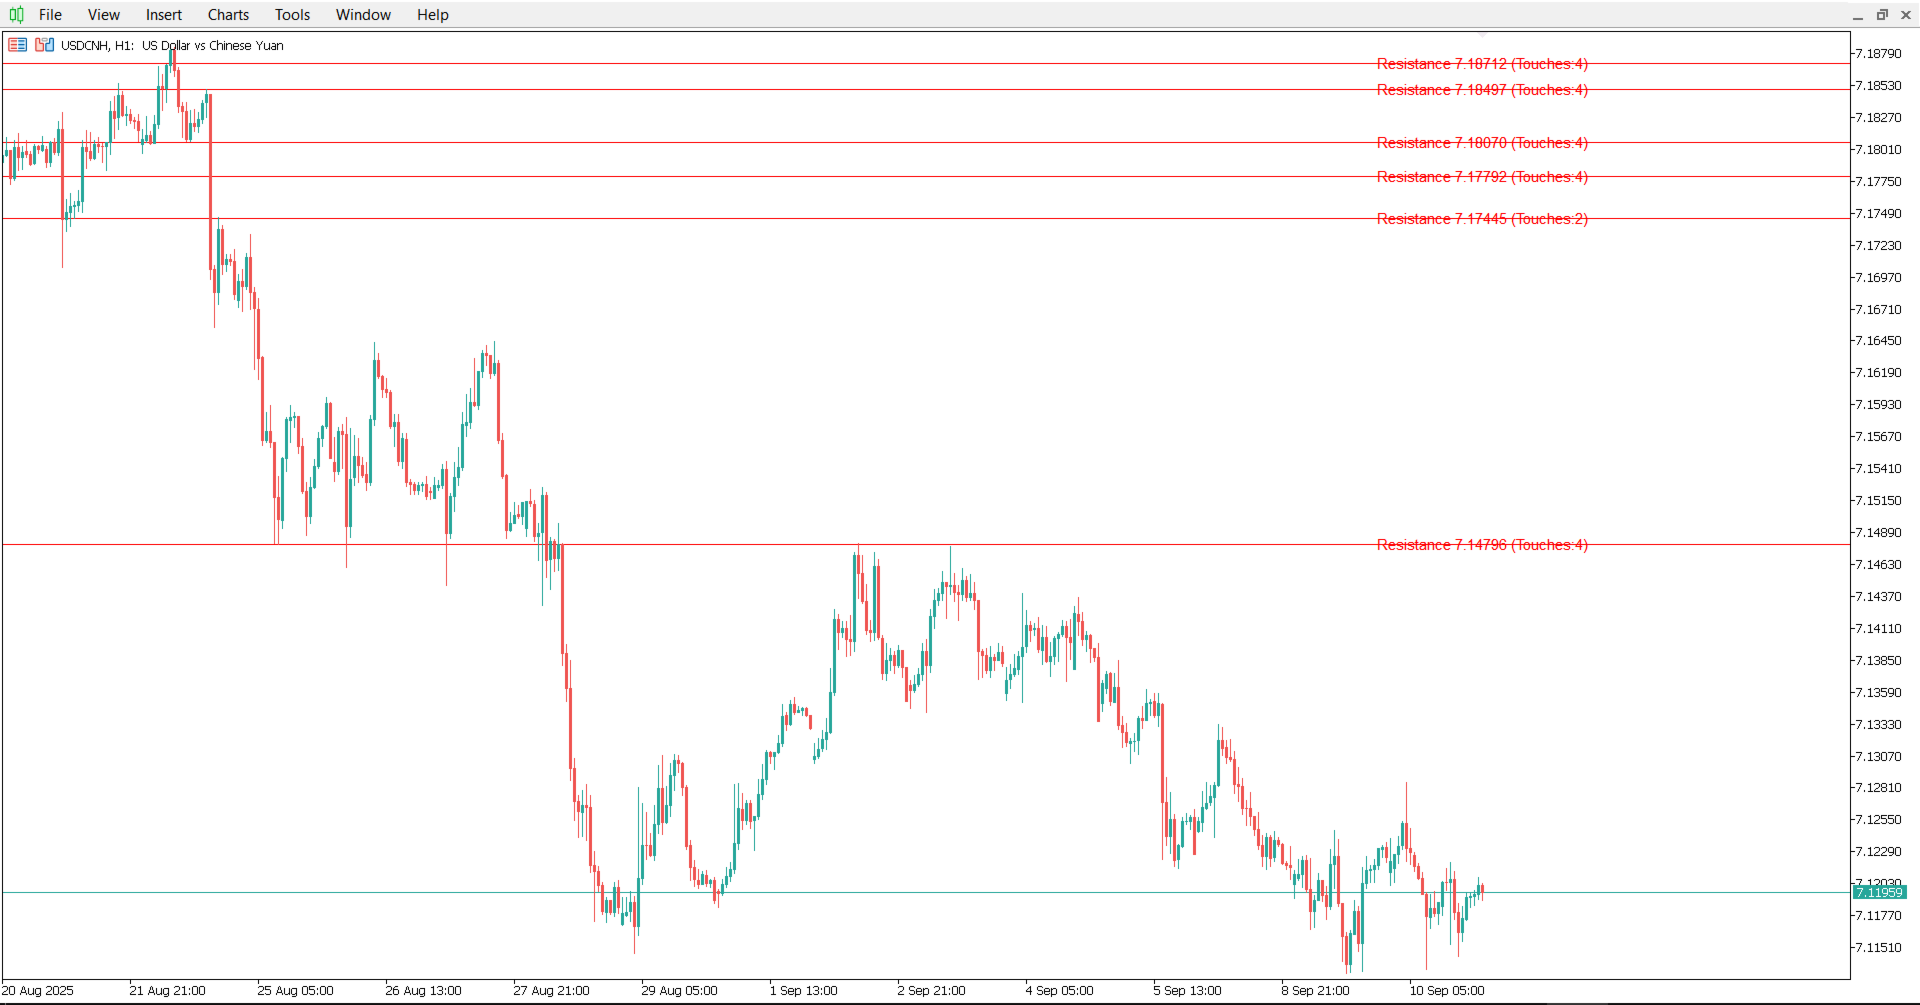
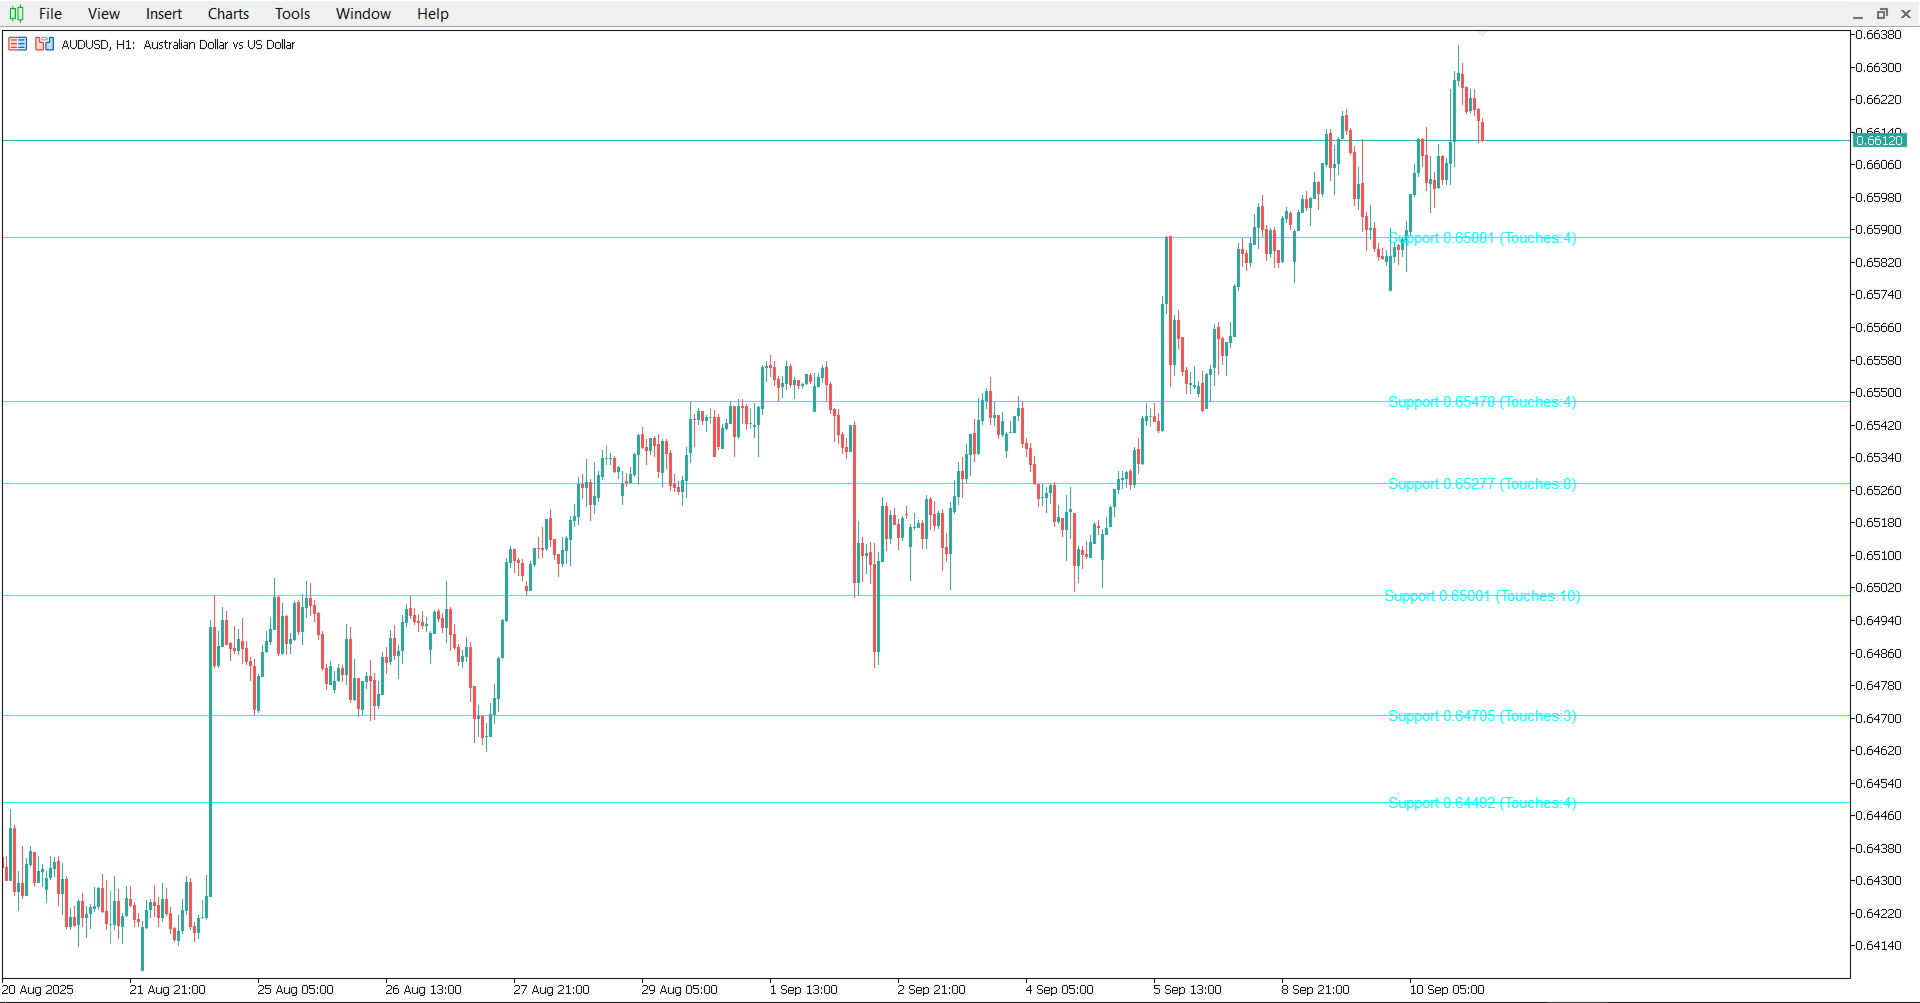
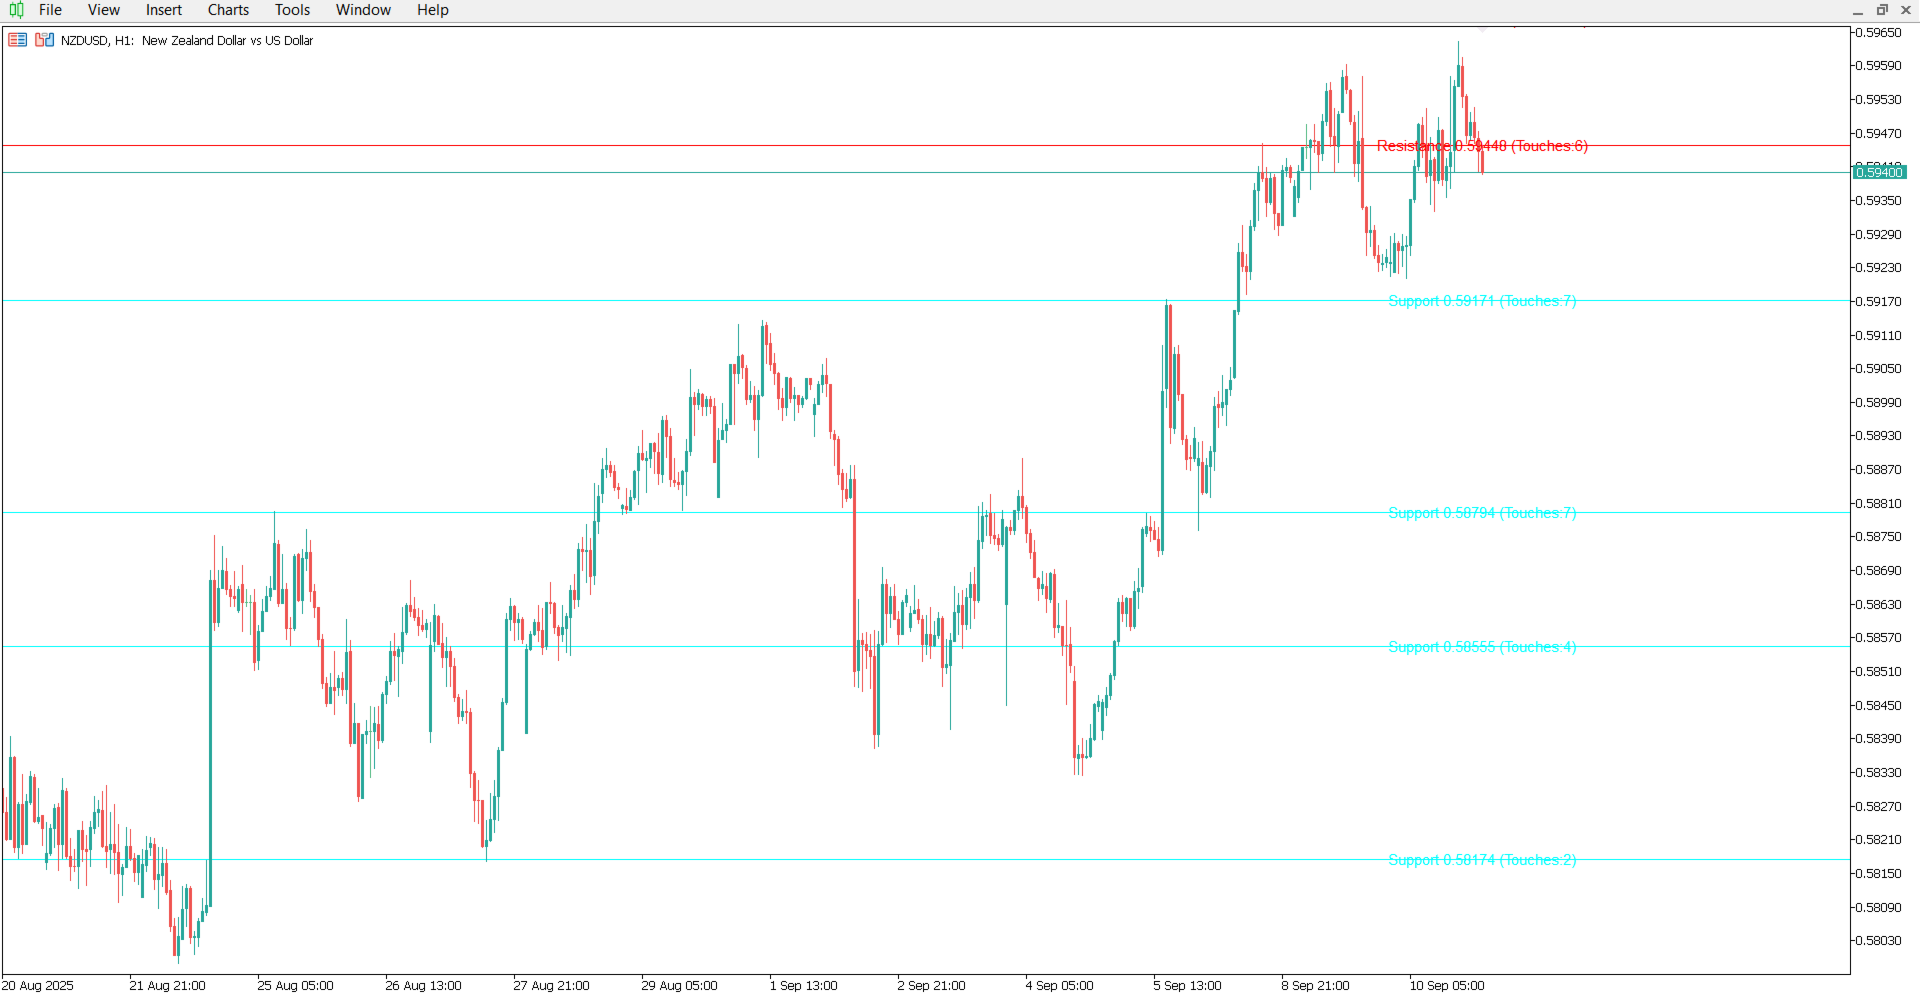
Discover the Strongest Support and Resistance Areas. This indicator is an advanced tool for identifying and plotting support and resistance levels on a chart. Instead of using a simple method, it follows a dynamic approach to identifying the most important levels. Its goal: to find important highs and lows that represent potential price reversal points.
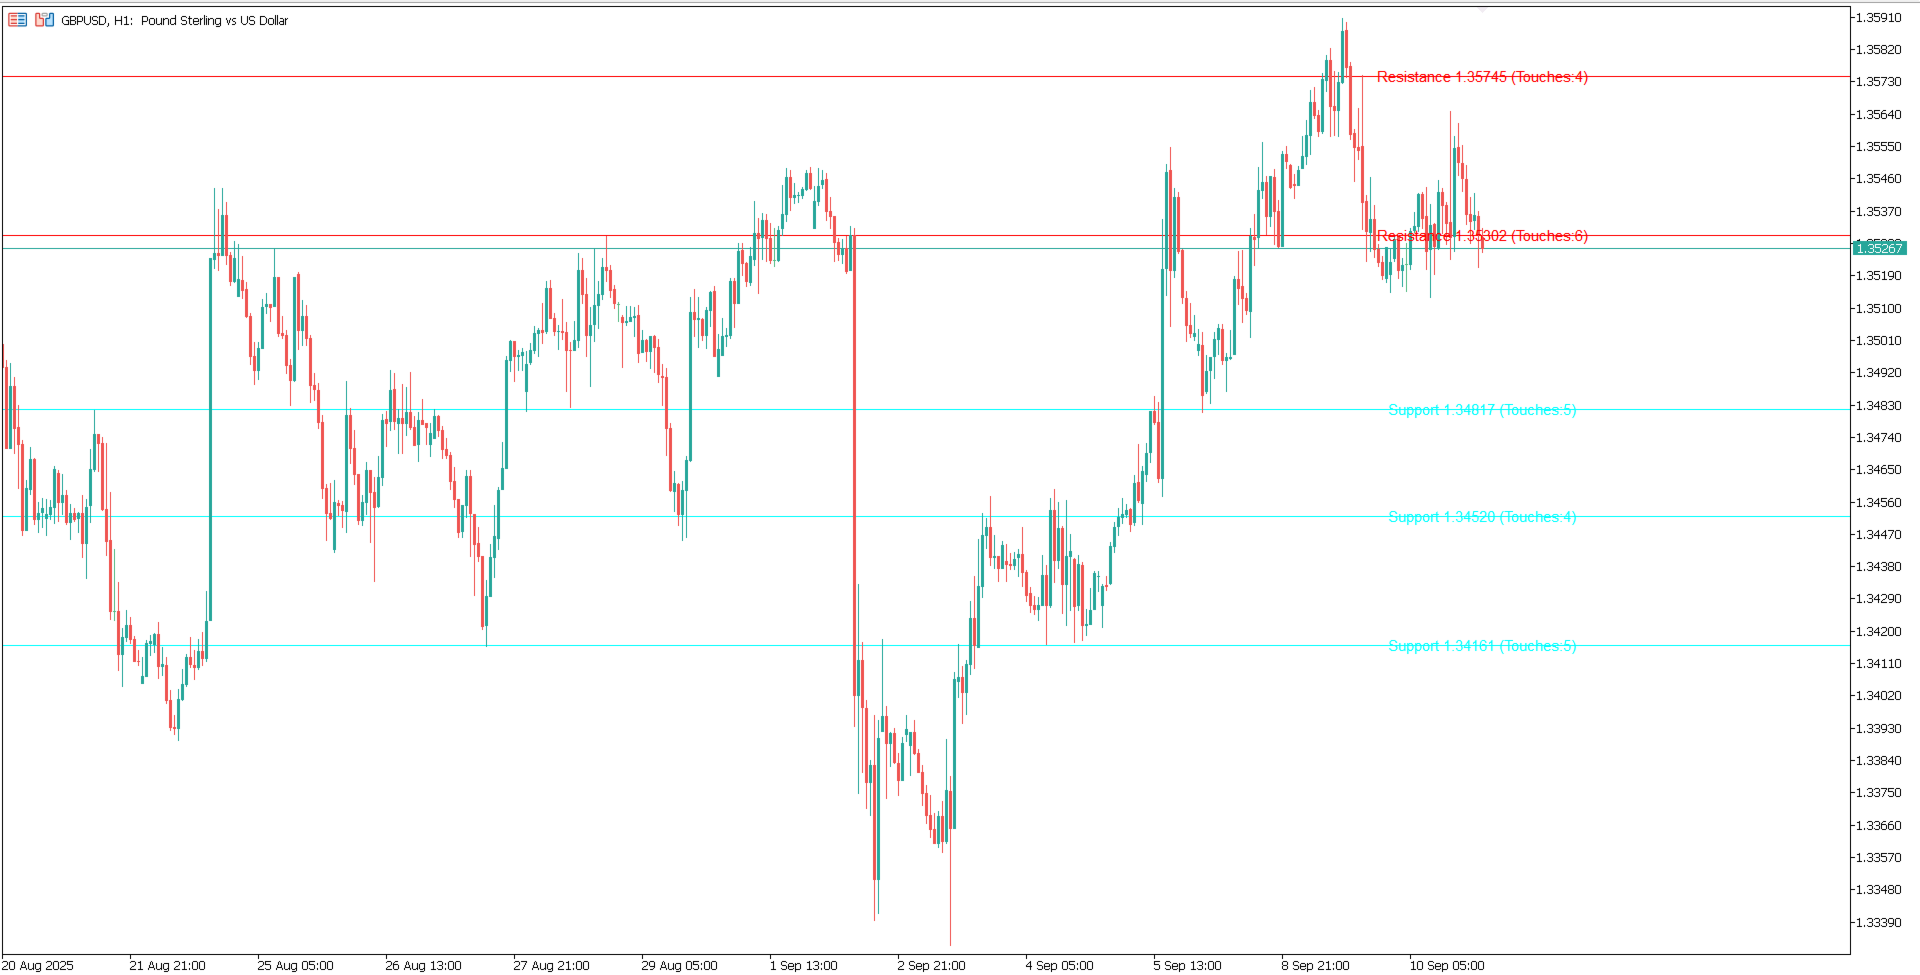
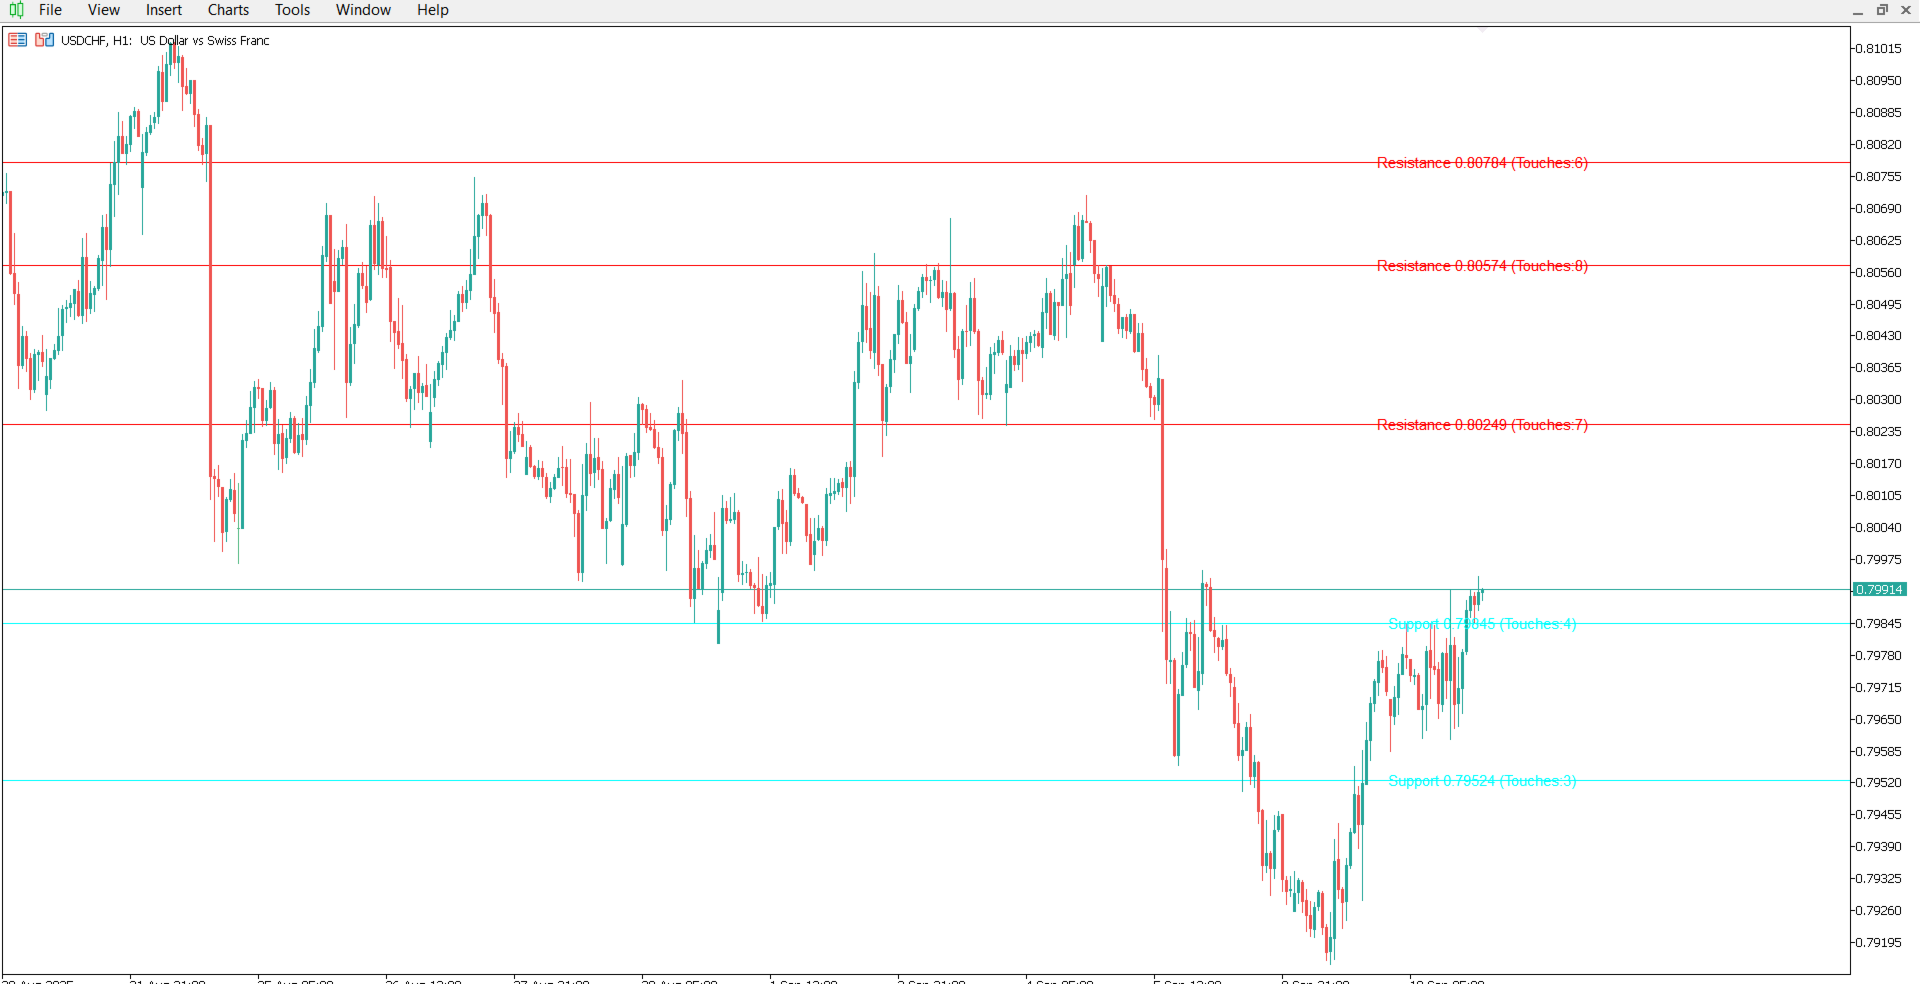
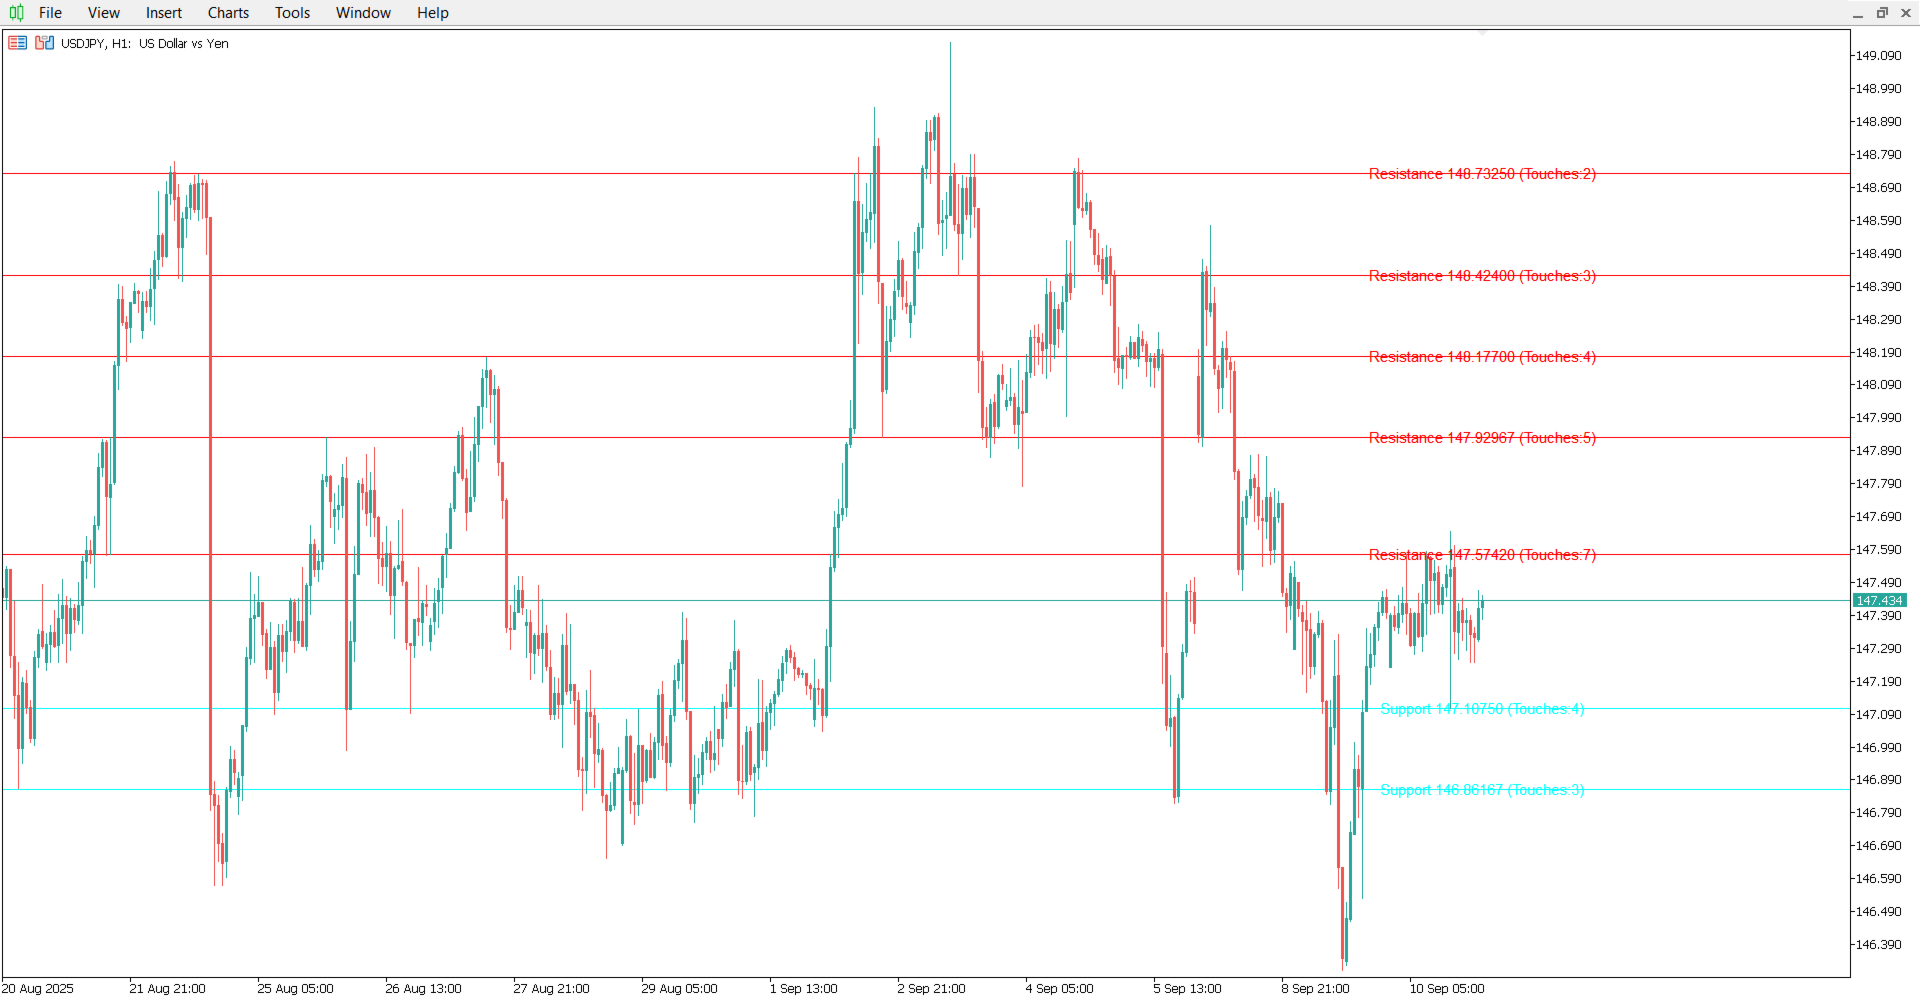
The indicator analyzes three different time frames that you specify in the inputs: TF1, TF2, and TF3. Support and Resistance is the professional indicator every serious trader seeks. The indicator calculates support and resistance dynamically, not statically.
Features
It plots the strongest support and resistance levels automatically and with high accuracy.
It relies on intelligent multi-timeframe analysis (H1, H4, and D1) to identify the most robust and reliable levels.
It offers an elegant visual presentation with clear colors that instantly distinguish support and resistance.
Advanced filtering prevents duplication and chart blur, giving you a clear and crisp view.
Instant dynamic updating with each new candle.
A lightweight and fast-performing tool, even on live accounts with large data sets.
Clarer insights, faster decisions, more profitable trading.
Turn your chart into a smart map that reveals the strongest reversal zones in the market.
Conclusion:
This indicator doesn't rely on simply drawing simple lines. It uses a complex algorithm to collect, combine, and filter swing points across multiple timeframes to present the most important and dynamic levels. This makes it a powerful tool for identifying key trading zones.
This indicator will be updated monthly. I will continue to develop it.