ViewTrend
- Indicatori
- Versione: 1.0
🔥 ViewTrend
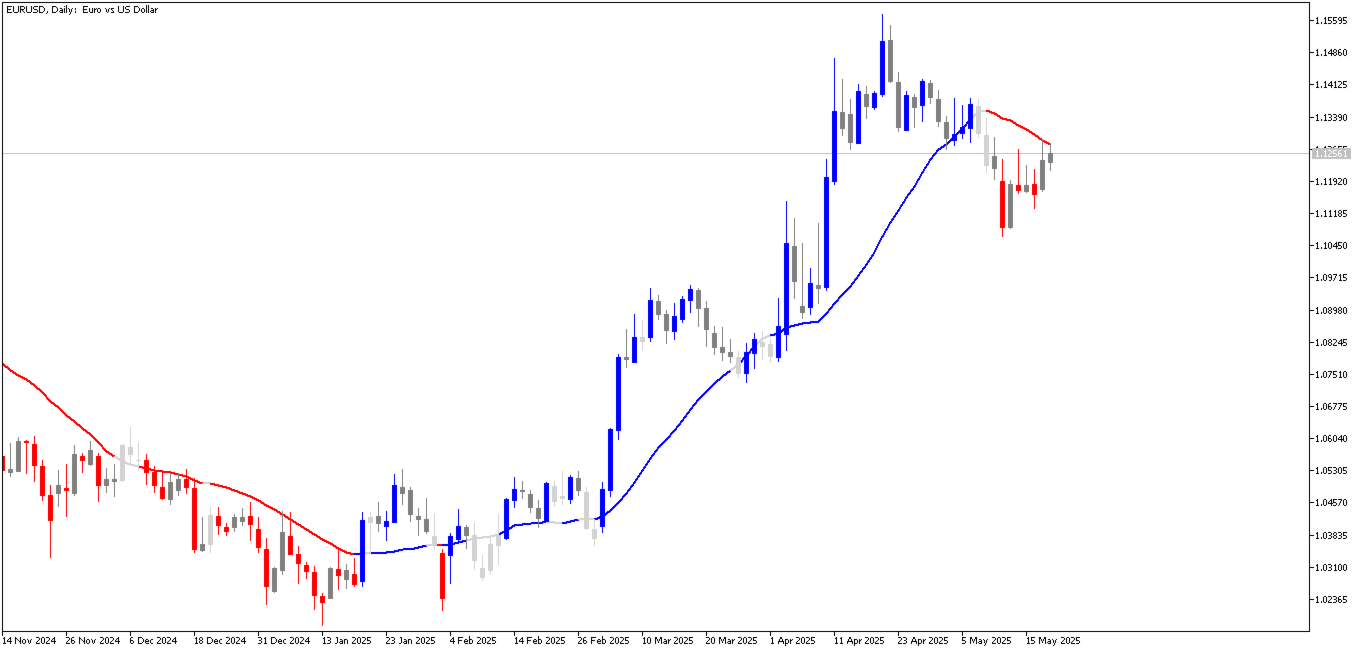
The ViewTrend indicator provides a visual interpretation of market conditions by coloring the candles and the moving average line based on defined technical criteria.
➡️ How does it work?
The agorithm analyzes the relationship between the current closing price, the previous closing price, and the behavior of a simple moving average (SMA). Based on this analysis, the indicator colors the candles and the moving average line according to the technical scenario observed:
Blue — Suggestion: Consider Buy-Only Scenarios
When the moving average is rising, and the current closing price is above the average, the indicator colors the moving average and candles in blue, suggesting a favorable condition for buy (long) trades.
Note: This may indicate an uptrend, but the user should always confirm with their own analysis and risk management.
Red — Suggestion: Consider Sell-Only Scenarios
When the moving average is falling, and the current closing price is below the average, the indicator turns red, suggesting a potential moment to consider sell (short) trades.
Note: This may signal a downtrend, but the user should always validate it with their own strategy and risk controls.
Gray or Light Gray — Suggestion: Wait
When there's no clear alignment between the price behavior and the moving average direction, the indicator shows a neutral color (gray or light gray). This signals a moment of possible indecision, suggesting that the user waits for a clearer condition before entering the market.
💥 Special Offer
Lifetime license for free!


Yes very good construction. And for free! Thank you very much!