Wedge Triangle Indicator
- Indicatori
- Versione: 1.2
- Attivazioni: 5

Strategy set to trade Triangle wedge break
This is a simple very effective strategy
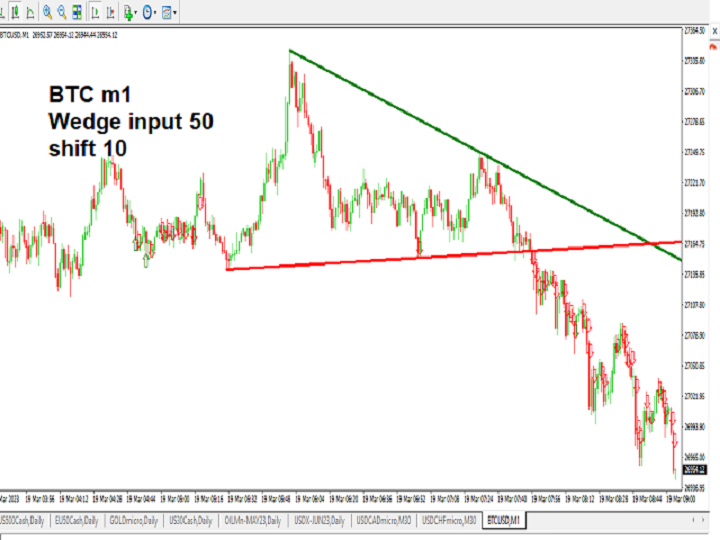
based on detecting and showing triangle wedges formation
Strategy set to trade Triangle wedge break
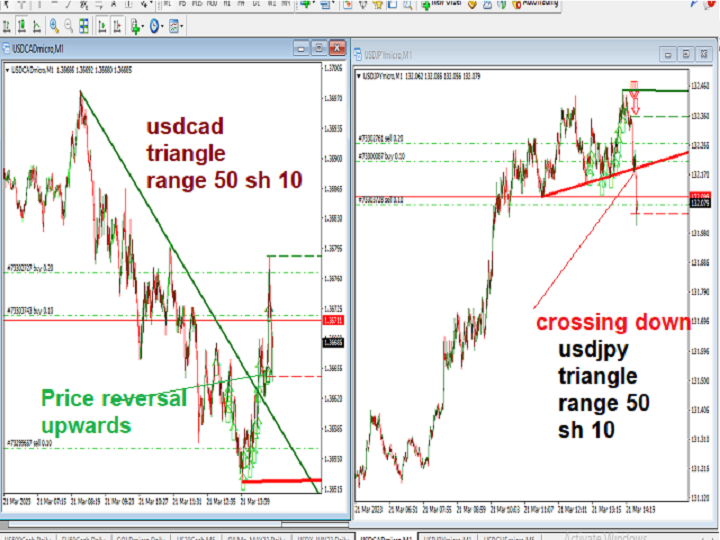
Red Arrows appears on crossing triangle down
Green Arrows appears on crossing triangle Up
You can also trade lower and upper triangle limit :(new version may be released to allow arrows for side ways trading)
---Sell on price declines from High triangle Level - Buy on increasing from Lower triangle level
2 inputs parameters are used
1- Range : to determine triangle wideness : small time frames needs high range input 30 or 50 or above
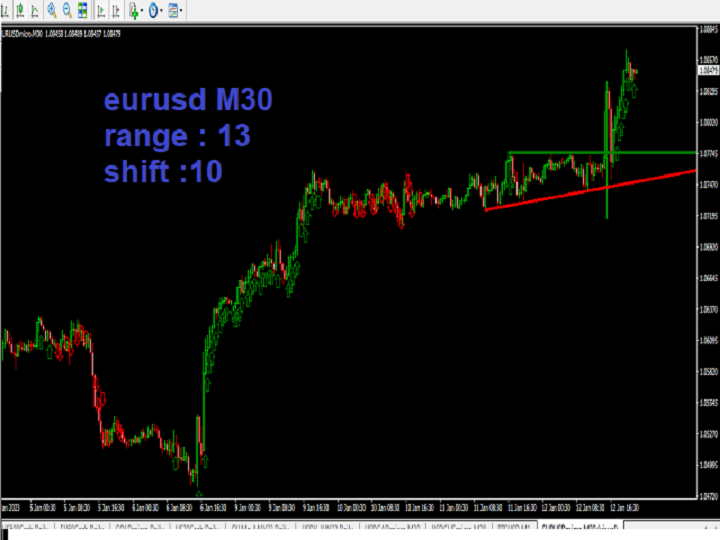
High time frames needs Low range input 25 or below
2- Shift : set to value above 5
indicators works on any timeframes