Trend Balance Bar

Trend Bar Balance Indicator

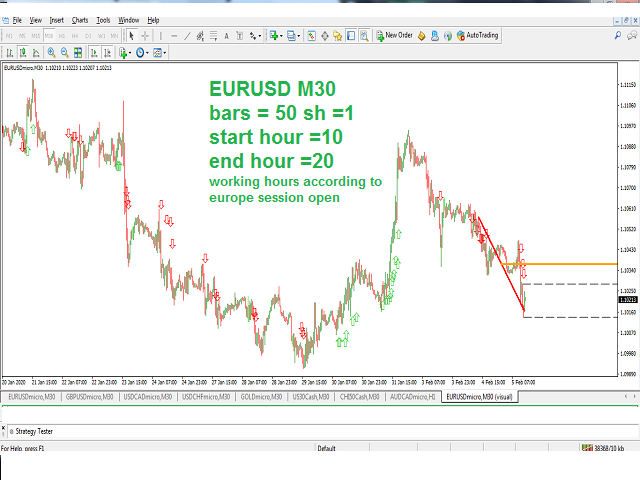
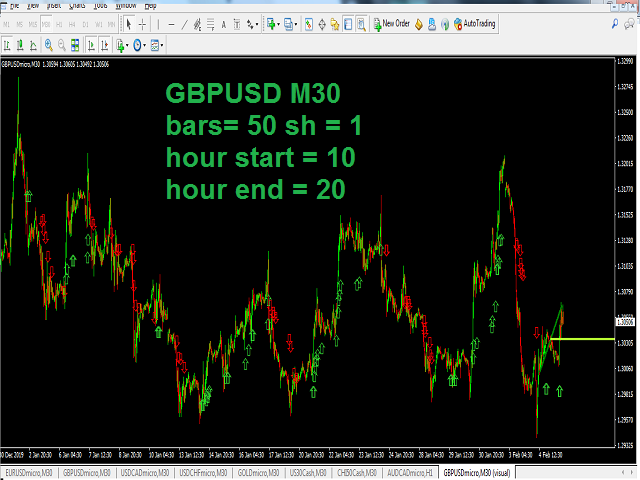
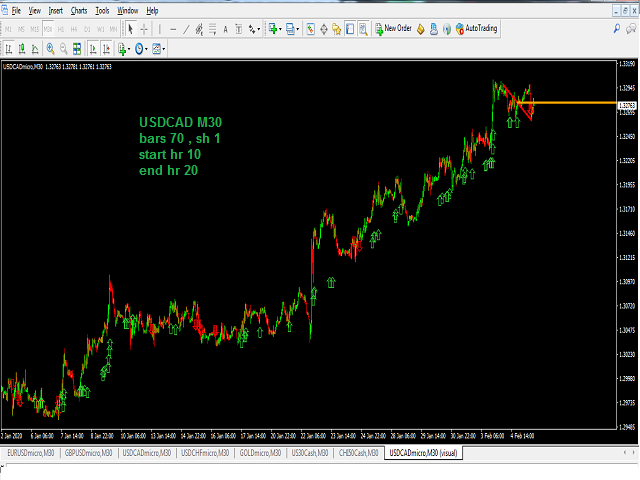
Simple indicator based on trend detection and support resistance breakage 

It detects the major trend and the minor support and resistance levels

*** a signal for UP /BUY is detected and alerted in a BULL trend and a resistance level break

*** a signal for DOWN /SELL is detected and alerted  in a Bear trend and a support level break

THE POWER OF THIS INDICATOR I USE IT WHEN YOU COMBINE ITS DAILY SIGNALS FROM DIFFERENT CHART SYMBOLS AT SAME TIME AND CLOSE ALL ORDERS BY END OF DAY

Inputs :

 *** Bars count : used for trend calculations and support resistance levels (min value 20)

*** Shift : calculations start after how many bars 

*** Indicator start Hour for signaling (i use the start of europe session 10 as per ME times)

*** Indicator end Hour for signaling (i use 20 as per ME times)

*** enable/disable alerts

*** enable/disable Email alerts

You can try it on any time frame M1,M5,M15,M30,H1,H4 as long as bars count not less than 20

--- I use M30  with parameters Bars = 50 , shift = 1 , hour start = 10 , hour end = 20)

of course higher time frames need lower bars input (not less than 20)


Prodotti consigliati
Auto Fibo Pro m
DMITRII GRIDASOV
Indicatore "Auto FIBO Pro" Crypto_Forex: è un ottimo strumento ausiliario nel trading! - L'indicatore calcola e posiziona automaticamente sul grafico i livelli di Fibo e le linee di tendenza locali (colore rosso). - I livelli di Fibonacci indicano le aree chiave in cui il prezzo può invertirsi. - I livelli più importanti sono 23,6%, 38,2%, 50% e 61,8%. - Puoi usarlo per lo scalping di inversione o per il trading di zone grid. - Ci sono molte opportunità per migliorare il tuo sistema attuale us
Gold Titan King Scalper
Dodong Christian Arnon
Indicator Description GOLD TITAN KING SIGNAL INDICATOR High-Precision Gold Scalping Buy/Sell Signals – Manual Trading Assistant Overview The Gold Titan King Signal Indicator is a manual trading assistant tool designed for high-frequency scalping on Gold (XAUUSD) and other major pairs. It generates clear BUY/SELL signals with precise entry levels, along with adjustable Stop Loss and Take Profit levels displayed directly on the chart. ️ This tool is NOT an EA. It does not execute trades
Owl smart levels
Sergey Ermolov
4.24 (37)
Versione MT5  |  FAQ L' indicatore Owl Smart Levels   è un sistema di trading completo all'interno dell'unico indicatore che include strumenti di analisi di mercato popolari come i   frattali avanzati di Bill Williams , Valable ZigZag che costruisce   la corretta struttura a onde   del mercato, e i   livelli di Fibonacci che segnano i livelli esatti di entrata nel mercato e luoghi per prendere profitti. Descrizione dettagliata della strategia Istruzioni per lavorare con l'indicatore Consulente-
Super Reversal Pattern
Parfait Mujinga Ndalika
Super Reversal Pattern Indicator Unlock the power of advanced pattern recognition with our Super Reversal Pattern Indicator. Designed for traders seeking precision and reliability, this indicator identifies one of the most effective reversal patterns in technical analysis, offering a significant edge in your trading strategy. Key Features: Non-Repainting Accuracy: Enjoy the confidence of non-repainting technology. Once a Super Reversal Pattern is detected, it remains static, providing consiste
Rainbow Price Visualizer v1.21 See where the market really breathes. Turns your MT4 chart into an ultra-precise heatmap that highlights price zones favored by big players. Why it matters 300 price levels at 0.2‑pip resolution — microscopic detail. 8 visual themes (Rainbow, Fire, Ocean…) for instant readibility. Smart opacity: low noise fades, real zones pop. Lightweight rendering with automatic cleanup. Fully customizable: saturation, opacity, resolution, history depth. Bands project into the f
Trend PA
Mikhail Nazarenko
5 (3)
The Trend PA indicator uses   Price Action   and its own filtering algorithm to determine the trend. This approach helps to accurately determine entry points and the current trend on any timeframe. The indicator uses its own algorithm for analyzing price changes and Price Action. Which gives you the advantage of recognizing, without delay, a new nascent trend with fewer false positives. Trend filtering conditions can be selected in the settings individually for your trading style. The indicator
Alpha Trend sign has been a very popular trading tool in our company for a long time. It can verify our trading system and clearly indicate trading signals, and the signals will not drift. Main functions: Based on the market display of active areas, indicators can be used to intuitively determine whether the current market trend belongs to a trend market or a volatile market. And enter the market according to the indicator arrows, with green arrows indicating buy and red arrows indicating se
L'indicatore SMC Venom Model BPR è uno strumento professionale per i trader che operano nell'ambito del concetto di Smart Money (SMC). Identifica automaticamente due modelli chiave sul grafico dei prezzi: FVG   (Fair Value Gap) è una combinazione di tre candele, in cui c'è un gap tra la prima e la terza candela. Forma una zona tra livelli in cui non c'è supporto di volume, il che spesso porta a una correzione dei prezzi. BPR   (Balanced Price Range) è una combinazione di due modelli FVG che for
Trend Ray
Andriy Sydoruk
The indicator shows the potential trend direction by cyclical-wave dependence. Thus, all the rays of the intersection will be optimal rays, in the direction of which the price is expected to move, taking into account the indicator period. Rays can be used as a direction for potential market movement. But we must not forget that the approach must be comprehensive, the indicator signals require additional information to enter the market.
QuantumEdge Trader
Hossam Ali Ahmed Ali
QuantumEdge Trader v1.0 AI-Powered Precision Signals for Serious Traders QuantumEdge Trader is a smart and reliable indicator that delivers accurate BUY and SELL signals using advanced market analysis and trend detection. Designed for M1 to M60 timeframes, it's ideal for scalping and intraday strategies. --- Key Features: No Repaint – Signals never change after appearing Smart trend filters to reduce noise Adjustable sensitivity and alerts Perfect for XAUUSD, EURUSD, and m
The Th3Eng PipFinite indicator is based on a very excellent analysis of the right trend direction with perfect custom algorithms. It show the true direction and the best point to start trading. With StopLoss point and Three Take Profit points. Also it show the right pivot of the price and small points to order to replace the dynamic support and resistance channel, Which surrounds the price. And Finally it draws a very helpful Box on the left side on the chart includes (take profits and Stop loss
The new update makes this indicator a complete tool for studying, analyzing and operating probabilistic patterns. It includes: On-chart Multi-asset percentage monitor. Configurable martingales. Twenty-one pre-configured patterns , including Mhi patterns and C3. An advanced pattern editor to store up to 5 custom patterns. Backtest mode to test results with loss reports. Trend filter. Hit operational filter. Martingale Cycles option. Various types of strategies and alerts. Confluence between patte
Indicatore Crypto_Forex "Morning Star pattern" per MT4. - L'indicatore "Morning Star pattern" è un indicatore molto potente per il trading Price Action: nessuna rielaborazione, nessun ritardo. - L'indicatore rileva i pattern rialzisti Morning Star sul grafico: segnale freccia blu sul grafico (vedi immagini). - Con avvisi su PC, dispositivi mobili ed e-mail. - È disponibile anche il suo fratello, l'indicatore ribassista "Evening Star pattern" (segui il link qui sotto). - L'indicatore "Morning S
Infinity Trend Pro
Yaroslav Varankin
1 (1)
This is a trend indicator without redrawing Developed instead of the binary options strategy (by the color of the Martingale candlestick) Also works well in forex trading When to open trades (binary options) A signal will appear in the place with a candle signaling the current candle It is recommended to open a deal for one candle of the current timeframe M1 and M5 When a blue dot appears, open a deal up When a red dot appears, open a trade down. How to open trades on Forex. When a signal is rec
Indicatore Crypto_Forex "Force Index con zone dinamiche di ipervenduto/ipercomprato" per MT4, senza ridisegno. - Force Index è uno degli indicatori principali che combina i dati di prezzo e volume in un singolo valore. - È fantastico per prendere le negoziazioni di vendita dalla zona dinamica di ipercomprato e le negoziazioni di acquisto dalla zona dinamica di ipervenduto. - Questo indicatore è eccellente per il trading di momentum nella direzione del trend. - Zona dinamica di ipercomprato - s
PZ Mean Reversion MT4
PZ TRADING SLU
3 (4)
Indicatore unico che implementa un approccio professionale e quantitativo al trading di reversione. Sfrutta il fatto che il prezzo devia e ritorna alla media in modo prevedibile e misurabile, il che consente regole di entrata e uscita chiare che superano di gran lunga le strategie di trading non quantitative. [ Installation Guide | Update Guide | Troubleshooting | FAQ | All Products ] Segnali di trading chiari Incredibilmente facile da scambiare Colori e dimensioni personalizzabili Implementa l
Trend Scanner
Vladimir Kalendzhyan
4.33 (6)
By purchasing this indicator, you have the right to receive a free copy of one of   my other indicator's or advisor’s!  (All future updates are included. No limits) . To get it , please contact me by  mql5 message ! The Trend Scanner trend line indicator displays the trend direction and its changes. The indicator works on all currency pairs and  timeframes. The indicator simultaneously displays multiple readings on the price chart: the support and resistance lines of the currency pair, the exist
Simple to read and powerful, no fancy lines and drawings to clutter your chart or distract you. The trend probability oscillator estimates how likely a trend will continue in a certain period. The cummulator period controls how many bars in the past to use and is a proxy for the timescale the trend probability should hold. The use of a Max Line improves this further by indicating when a trend is likely to reverse. In most cases a trend must lose momentum before reversing. Hence, a trend probabil
The indicator detects and displays 3 Drives harmonic pattern (see the screenshot). The pattern is plotted by the extreme values of the ZigZag indicator (included in the resources, no need to install). After detecting the pattern, the indicator notifies of that by a pop-up window, a mobile notification and an email. The indicator highlights the process of the pattern formation and not just the complete pattern. In the former case, it is displayed in the contour triangles. After the pattern is com
Daily Candle Predictor è un indicatore che prevede il prezzo di chiusura di una candela. L'indicatore è destinato principalmente all'uso sui grafici D1. Questo indicatore è adatto sia per il trading forex tradizionale che per il trading di opzioni binarie. L'indicatore può essere utilizzato come sistema di trading autonomo o può fungere da aggiunta al sistema di trading esistente. Questo indicatore analizza la candela corrente, calcolando alcuni fattori di forza all'interno del corpo della cande
Trendiness Index
Libertas LLC
5 (3)
"The trend is your friend" is one of the best known sayings in investing, because capturing large trendy price movements can be extremely profitable. However, trading with the trend is often easier said than done, because many indicators are based on price reversals not trends. These aren't very effective at identifying trendy periods, or predicting whether trends will continue. We developed the Trendiness Index to help address this problem by indicating the strength and direction of price trend
Please follow the "How To Trade" instructions exactly for best results Wycoff theory is vastly used by institutional traders but when it comes to retail traders the concept isn't well understood by most. It is even more difficult to implement in intraday & swing trading. This No REPAINT indicator helps you in analyzing the market cycles and plots buy/sell signals at the start of trending phase. It studies the market strength of bulls and bears and does a effort Vs reward matrix calculation befor
Cosmic Diviner X Planet
Olena Kondratenko
4 (2)
This unique multi-currency strategy simultaneously determines the strength of trends and market entry points, visualizing this using histograms on the chart. The indicator is optimally adapted for trading on the timeframes М5, М15, М30, Н1. For the convenience of users, the indicator renders the entry point (in the form of an arrow), recommended take profit levels (TP1, TP2 with text labels) and the recommended Stop Loss level. The take profit levels (TP1, TP2) are automatically calculated for
[ZhiBiCCI] indicators are suitable for all cycle use, and are also suitable for all market varieties. [ZhiBiCCI] Green solid line is a reversal of bullish divergence. The green dotted line is a classic bullish divergence. [ZhiBiCCI] The solid line to the red is a reverse bearish divergence. The red dotted line is a classical bearish divergence. [ZhiBiCCI] can be set in the parameters (Alert, Send mail, Send notification), set to (true) to send instant signals to the alarm window, email, insta
VR Cub
Vladimir Pastushak
VR Cub è un indicatore per ottenere punti di ingresso di alta qualità. L'indicatore è stato sviluppato per facilitare i calcoli matematici e semplificare la ricerca dei punti di ingresso in una posizione. La strategia di trading per la quale è stato scritto l'indicatore ha dimostrato la sua efficacia per molti anni. La semplicità della strategia di trading è il suo grande vantaggio, che consente anche ai trader alle prime armi di commerciare con successo con essa. VR Cub calcola i punti di apert
This is a new strategy for SUPPLY DEMAND areas It is based on a calculation using the tick volume to detect the big price action in market for both bear /bull actions this smart volume action candles are used to determine the supply and demand areas prices in between main supply and demand lines indicate sideway market  up arrows will be shown when prices moves above the main supply and the secondary supply lines Down arrows will be shown when prices moves below the main demand and the secondary
Indicator. "Indicator wave or Indicator Ma". Using 23 standard indicators and the author's algorithm, the levels of purchases (from 0 to +100) and sales (from 0 to -100) are calculated. Then, using the calculated levels, the "Wave Indicator" draws a wave with 21 moving averages. The wave number is equal to the averaging period of the calculated levels. Waves # 1 - 7 Fast Moving Averages Waves from No. 8 -14 moving averages Waves from No. 15-21 slow moving averages Looking at the figures drawn
Indicatore Crypto_Forex HTF Ichimoku per MT4. - L'indicatore Ichimoku è uno degli indicatori di tendenza più potenti. HTF significa - Higher Time Frame. - Questo indicatore è eccellente per i Trend Trader e anche in combinazione con le voci Price Action. - L'indicatore HTF Ichimoku consente di collegare Ichimoku da un timeframe più elevato al grafico corrente. - Trend rialzista: linea rossa sopra quella blu (ed entrambe le linee sono sopra la nuvola) / Trend ribassista: linea rossa sotto quell
Binary Options Support Resistance Indicator This indicator is designed for binary options trading and effectively shows retracements from support and resistance levels. Signals appear on the current candle. A red arrow pointing downwards indicates a potential selling opportunity, while a blue arrow pointing upwards suggests buying opportunities. All that needs adjustment is the color of the signal arrows. It is recommended to use it on the M1-M5 timeframes as signals are frequent on these timef
"Dynamic Scalping Oscillator" - è un indicatore Crypto_Forex personalizzato avanzato - uno strumento di trading efficiente per MT4! - Nuova generazione di oscillatori - guarda le immagini per vedere come usarlo. - L'oscillatore Dynamic Scalping ha zone di ipervenduto/ipercomprato adattive. - L'oscillatore è uno strumento ausiliario per trovare punti di ingresso esatti dalle aree dinamiche di ipervenduto/ipercomprato. - Valori di ipervenduto: sotto la linea verde, valori di ipercomprato: sopra
Gli utenti di questo prodotto hanno anche acquistato
Gann Made Easy
Oleg Rodin
4.83 (150)
Gann Made Easy è un sistema di trading Forex professionale e facile da usare che si basa sui migliori principi del trading utilizzando la teoria di mr. WD Gann. L'indicatore fornisce segnali ACQUISTA e VENDI accurati, inclusi i livelli di Stop Loss e Take Profit. Puoi fare trading anche in movimento utilizzando le notifiche PUSH. CONTATTATEMI DOPO L'ACQUISTO PER RICEVERE CONSIGLI DI TRADING, BONUS E L'ASSISTENTE EA GANN MADE EASY GRATUITAMENTE! Probabilmente hai già sentito parlare molte volte d
Attualmente 20% di sconto! La soluzione migliore per ogni principiante o trader esperto! Questo software per cruscotti funziona su 28 coppie di valute. Si basa su 2 dei nostri indicatori principali (Advanced Currency Strength 28 e Advanced Currency Impulse). Offre un'ottima panoramica dell'intero mercato Forex. Mostra i valori di forza delle valute avanzate, la velocità di movimento delle valute e i segnali per 28 coppie Forex in tutti i (9) timeframe. Immaginate come migliorerà il vostro tra
Game Changer Indicator
Vasiliy Strukov
4.67 (9)
Game Changer è un indicatore di tendenza rivoluzionario, progettato per essere utilizzato su qualsiasi strumento finanziario, per trasformare il tuo Metatrader in un potente analizzatore di trend. L'indicatore non ridisegna e non subisce ritardi. Funziona su qualsiasi intervallo temporale e aiuta a identificare i trend, segnala potenziali inversioni, funge da meccanismo di trailing stop e fornisce avvisi in tempo reale per risposte tempestive del mercato. Che tu sia un trader esperto, un profess
M1 Sniper
Oleg Rodin
4.89 (18)
M1 SNIPER è un sistema di indicatori di trading facile da usare. Si tratta di un indicatore a freccia progettato per l'intervallo temporale M1. L'indicatore può essere utilizzato come sistema autonomo per lo scalping sull'intervallo temporale M1 e come parte del tuo sistema di trading esistente. Sebbene questo sistema di trading sia stato progettato specificamente per il trading sull'intervallo temporale M1, può comunque essere utilizzato anche con altri intervalli temporali. Inizialmente ho pro
Smc Blast Signal
Mohit Dhariwal
3.67 (3)
NEW YEAR 2026 SALE OFFER PRICE AT JUST 75 DOLLARS FEW COPIES ONLY From 1st Jan -5th Jan MIDNIGHT GRAB YOUR COPY ON THIS New Year EVE Full Fledged EA will also be provided in this offer along with the purchase of Indicator. Limited copies only at this price and Ea too. Grab your copy soon SMC Blast Signal with FVG, BOS and trend Breakout The SMC Blast Signal  is a  Precise trading system for Meta Trader 4 that uses Smart Money Concepts (SMC) , including Fair Value Gaps (FVG) and Break of Structu
Scalper Inside PRO
Alexey Minkov
4.74 (69)
An exclusive indicator that utilizes an innovative algorithm to swiftly and accurately determine the market trend. The indicator automatically calculates opening, closing, and profit levels, providing detailed trading statistics. With these features, you can choose the most appropriate trading instrument for the current market conditions. Additionally, you can easily integrate your own arrow indicators into Scalper Inside Pro to quickly evaluate their statistics and profitability. Scalper Inside
Indicatore in anticipo   determina i livelli e le zone di inversione del mercato , consente di attendere che il prezzo ritorni al livello ed entrare all'inizio di un nuovo trend, e non alla sua fine. Lui mostra   livelli di inversione   dove il mercato conferma un cambio di direzione e forma un ulteriore movimento. L'indicatore funziona senza ridisegnare, è ottimizzato per qualsiasi strumento e rivela il suo massimo potenziale quando abbinato al   LINEE DI TENDENZA PRO   indicatore. Scanner st
Dynamic Forex28 Navigator
Bernhard Schweigert
4.43 (7)
Dynamic Forex28 Navigator - Lo strumento di trading Forex di nuova generazione. ATTUALMENTE SCONTATO DEL 49%. Dynamic Forex28 Navigator è l'evoluzione dei nostri indicatori popolari di lunga data, che combinano la potenza di tre in uno: Advanced Currency Strength28 Indicator (695 recensioni) + Advanced Currency IMPULSE con ALERT (520 recensioni) + CS28 Combo Signals (Bonus). Dettagli sull'indicatore https://www.mql5.com/en/blogs/post/758844 Cosa offre l'indicatore di forza di nuova generazione?
ATTUALMENTE SCONTATO DEL 26% La soluzione migliore per ogni principiante o trader esperto! Questo indicatore è uno strumento di trading unico, di alta qualità e conveniente perché abbiamo incorporato una serie di caratteristiche proprietarie e una nuova formula. Con un solo grafico è possibile leggere la forza delle valute per 28 coppie Forex! Immaginate come migliorerà il vostro trading perché sarete in grado di individuare l'esatto punto di innesco di una nuova tendenza o di un'opportunità
Trend Screener
STE S.S.COMPANY
4.79 (95)
Indicatore di tendenza, soluzione unica rivoluzionaria per il trading di tendenze e il filtraggio con tutte le importanti funzionalità di tendenza integrate in un unico strumento! È un indicatore multi-timeframe e multi-valuta al 100% non ridipingibile che può essere utilizzato su tutti i simboli/strumenti: forex, materie prime, criptovalute, indici e azioni. OFFERTA A TEMPO LIMITATO: l'indicatore di screening di supporto e resistenza è disponibile a soli 50$ e a vita. (Prezzo originale 250$) (o
Advanced Supply Demand
Bernhard Schweigert
4.91 (296)
New Year Trading Special – 50% OFF Best Solution for any Newbie or Expert Trader! This indicator is a unique, high quality and affordable trading tool because we have incorporated a number of proprietary features and a new formula. With this update, you will be able to show double timeframe zones. You will not only be able to show a higher TF but to show both, the chart TF, PLUS the higher TF: SHOWING NESTED ZONES. All Supply Demand traders will love it. :) Important Information Revealed Maximiz
Trend Lines PRO
Roman Podpora
5 (1)
LINEE DI TENDENZA PRO       Aiuta a capire dove il mercato sta realmente cambiando direzione. L'indicatore mostra reali inversioni di tendenza e punti in cui i principali attori rientrano. Vedi  Linee BOS   Cambiamenti di tendenza e livelli chiave su timeframe più ampi, senza impostazioni complesse o rumore inutile. I segnali non vengono ridisegnati e rimangono sul grafico dopo la chiusura della barra. Cosa mostra l'indicatore: Cambiamenti reali       tendenza (linee BOS) Una volta che un segna
GOLD Impulse with Alert
Bernhard Schweigert
4.64 (11)
Questo indicatore è una super combinazione dei nostri 2 prodotti Advanced Currency IMPULSE with ALERT  +   Currency Strength Exotics . Funziona per tutti i time frame e mostra graficamente l'impulso di forza o debolezza per le 8 valute principali più un simbolo! Questo indicatore è specializzato nel mostrare l'accelerazione della forza delle valute per qualsiasi simbolo come oro, coppie esotiche, materie prime, indici o futures. Primo nel suo genere, qualsiasi simbolo può essere aggiunto all
Trend indicator AI
Ramil Minniakhmetov
4.95 (76)
Trend Ai indicator è un ottimo strumento che migliorerà l'analisi di mercato di un trader combinando l'identificazione della tendenza con punti di ingresso utilizzabili e avvisi di inversione. Questo indicatore consente agli utenti di navigare nelle complessità del mercato forex con fiducia e precisione Oltre ai segnali primari, l'indicatore Ai di tendenza identifica i punti di ingresso secondari che si presentano durante i pullback o i ritracciamenti, consentendo ai trader di capitalizzare le
Special Launch Offer: Available at a limited-time price to celebrate the new release. [Concept: Cutting Through the Noise] In a market filled with chaotic movements and lagging indicators, clarity is the ultimate weapon. KATANA Scalper is engineered with a singular philosophy: to cut through market noise like a precision blade. By filtering out non-essential fluctuations, it reveals the pure "Momentum Structure" hidden within the price action, allowing you to execute with surgical precision. 5
Presentazione       Quantum Trend Sniper Indicator   , l'innovativo indicatore MQL5 che sta trasformando il modo in cui identifichi e scambi le inversioni di tendenza! Sviluppato da un team di trader esperti con un'esperienza di trading di oltre 13 anni,       Indicatore Quantum Trend Sniper       è progettato per spingere il tuo viaggio di trading verso nuove vette con il suo modo innovativo di identificare le inversioni di tendenza con una precisione estremamente elevata. *** Acquista Quantum
Quantum Breakout Indicator PRO
Bogdan Ion Puscasu
4.96 (26)
Presentazione       Quantum Breakout PRO   , l'innovativo indicatore MQL5 che sta trasformando il modo in cui scambi le zone di breakout! Sviluppato da un team di trader esperti con un'esperienza di trading di oltre 13 anni,   Quantum Breakout PRO   è progettato per spingere il tuo viaggio di trading a nuovi livelli con la sua strategia innovativa e dinamica della zona di breakout. Quantum Breakout Indicator ti fornirà frecce di segnalazione sulle zone di breakout con 5 zone target di profitt
SMC Easy Signal
Mohamed Hassan
4.73 (15)
3 copies left at $65, next price is $120 SMC Easy Signal was built to remove the confusion around the smart money concept by turning structural shifts like BOS (Break of Structure) and CHoCH (Change of Character) into simple buy and sell trading signals. It simplifies market structure trading by automatically identifying breakouts and reversals as they happen, allowing traders to focus on execution rather than analysis. Whether the market is continuing its trend or preparing to reverse, the i
Meravith
Ivan Stefanov
5 (1)
L'indicatore analizza il volume da ogni punto e calcola i livelli di esaurimento del mercato per quel volume. È composto da tre linee: Linea di esaurimento del volume rialzista Linea di esaurimento del volume ribassista Una linea che indica la tendenza del mercato. Questa linea cambia colore per riflettere se il mercato è rialzista o ribassista. Puoi analizzare il mercato da qualsiasi punto di partenza tu scelga. Una volta che una linea di esaurimento del volume è raggiunta, identifica un nuovo
Currency Strength Exotics
Bernhard Schweigert
4.88 (33)
ATTUALMENTE SCONTATO DEL 20%! La soluzione migliore per qualsiasi principiante o trader esperto! Questo indicatore è specializzato nel mostrare la forza della valuta per qualsiasi simbolo come coppie esotiche, materie prime, indici o futures. È il primo nel suo genere, qualsiasi simbolo può essere aggiunto alla nona riga per mostrare la vera forza della valuta di Oro, Argento, Petrolio, DAX, US30, MXN, TRY, CNH ecc. Si tratta di uno strumento di trading unico, di alta qualità e conveniente pe
Apollo SR Master è un indicatore di Supporto/Resistenza con caratteristiche speciali che rendono il trading con le zone di Supporto/Resistenza più semplice e affidabile. L'indicatore calcola le zone di Supporto/Resistenza in tempo reale senza alcun ritardo, rilevando i massimi e i minimi dei prezzi locali. Quindi, per confermare la nuova area SR formata, l'indicatore mostra un segnale speciale che segnala che la zona SR può essere presa in considerazione e utilizzata come un vero e proprio segna
Day Trader Master è un sistema di trading completo per i day trader. Le systeme se compose de due indicatori. Un indicar est un signal fléché pour acheter et vendre. C'est l'indicateur de fleche que vous obtenez. Je vous fournirai le deuxième indicaur gratuitement. Le deuxième indicaur è un indicaur de tendance spécialement conçu pour être utilisé conjointement avec ces flèches. GLI INDICATORI NON SI RIPETONO E NON RITARDANO! Usare questo sistema è molto semplice. Devi solo seguire i segnali del
Smetti di indovinare. Inizia a fare trading con un vantaggio statistico. Gli indici azionari non si negoziano come il forex. Hanno sessioni definite, gap notturni e seguono pattern statistici prevedibili. Questo indicatore ti fornisce i dati di probabilità di cui hai bisogno per fare trading su indici come DAX, S&P 500 e Dow Jones con fiducia. Cosa lo rende diverso La maggior parte degli indicatori ti mostra cosa è successo. Questo ti mostra cosa probabilmente succederà dopo. Ogni giorno di trad
PZ Divergence Trading
PZ TRADING SLU
5 (2)
Unlock hidden profits: accurate divergence trading for all markets Tricky to find and scarce in frequency, divergences are one of the most reliable trading scenarios. This indicator finds and scans for regular and hidden divergences automatically using your favourite oscillator. [ Installation Guide | Update Guide | Troubleshooting | FAQ | All Products ] Easy to trade Finds regular and hidden divergences Supports many well known oscillators Implements trading signals based on breakouts Display
FX Power MT4 NG
Daniel Stein
4.95 (20)
FX Power: Analizza la Forza delle Valute per Decisioni di Trading Più Intelligenti Panoramica FX Power è lo strumento essenziale per comprendere la reale forza delle principali valute e dell'oro in qualsiasi condizione di mercato. Identificando le valute forti da comprare e quelle deboli da vendere, FX Power semplifica le decisioni di trading e rivela opportunità ad alta probabilità. Che tu segua le tendenze o anticipi inversioni utilizzando valori estremi di Delta, questo strumento si adatta
Hidden Cycles
Lev Vladimirovic Marushkin
5 (1)
Christmas Sale! – The Only 100% Universal Tool Grab Hidden Cycles for only $129 (regular price $179). Stop trading against nature! This is your chance to secure the only indicator rooted in the absolute laws that govern the entire universe. Most tools guess—this one reveals the truth. Offer ends soon — Buy another toy or buy the truth. Your choice... Based on Universal Laws — NOT Some Guy’s Algorithm: Let the market adjust to the Hidden Cycles Geometry — not the other way around. Most indicat
FX Volume
Daniel Stein
4.62 (37)
FX Volume: Scopri il Vero Sentimento di Mercato dalla Prospettiva di un Broker Panoramica Rapida Vuoi portare la tua strategia di trading a un livello superiore? FX Volume ti offre informazioni in tempo reale su come i trader retail e i broker sono posizionati—molto prima che compaiano report in ritardo come il COT. Che tu miri a guadagni costanti o desideri semplicemente un vantaggio più solido sui mercati, FX Volume ti aiuta a individuare grandi squilibri, confermare i breakout e perfezionar
Gli indicatori di tendenza sono uno degli ambiti dell'analisi tecnica utilizzati nel trading sui mercati finanziari. Indicatore Angular Trend Lines : determina in modo completo la direzione del trend e genera segnali di ingresso. Oltre a levigare la direzione media delle candele Utilizza anche l'angolo di inclinazione delle linee di tendenza. Il principio di costruzione degli angoli di Gann è stato preso come base per l'angolo di inclinazione. L'indicatore di analisi tecnica combina l'andamento
M1 Arrow
Oleg Rodin
5 (19)
Una strategia intraday basata su due principi fondamentali del mercato. L'algoritmo si basa sull'analisi dei volumi e delle onde di prezzo utilizzando filtri aggiuntivi. L'algoritmo intelligente dell'indicatore fornisce un segnale solo quando due fattori di mercato si combinano in uno solo. L'indicatore calcola le onde di un certo intervallo sul grafico M1 utilizzando i dati dell'intervallo di tempo più alto. E per confermare l'onda, l'indicatore utilizza l'analisi per volume. Questo indicatore
Questo indicatore è un indicatore per l'analisi automatica delle onde perfetto per il trading pratico! Caso... Nota:   non sono abituato a usare nomi occidentali per la classificazione delle onde a causa dell'influenza della convenzione di denominazione di Tang Lun (Tang Zhong Shuo Zen), ho chiamato l'onda base come   penna   e la banda dell'onda secondaria come   segmento   At allo stesso tempo, il segmento ha la direzione del trend. La denominazione   è principalmente segmento di trend   (que
Altri dall’autore
Trend Whale
Mohamed yehia Osman
Smart EA based on Trend and Support Resistance Levels with SL results given on EURUSD  H1 for last 10 months IF AUTOLOT enabled: **if LotRisk =1- 3 ---- Profit up to 50%  DD up to 17% **if LotRisk > 5 /10 /20 --- HIGH RISK --- HIGH Profit up to 1600 % or More but High DD up to 40% tested also on other symbols GBPUSD with positive results *** used parameters on H1 timeframe  bars 25  shift 4 ma index 0.85 for lower time frames Inputs will me doubled or tripled ...  for higher time frames inputs
Price Predictor
Mohamed yehia Osman
Price Predictor is an indicator that shows precise price reversals taking into account a higher time frame and a lower time frame candle patterns calculations it is great for scalping and swing trading  . Buy and sell arrows are shown on the chart as for entry signals.  BIG Arrows indicates the trend - SMALL Arrows signal a trade (BUY/SELL)   - A Green BIG UP Arrow with a support green line indicates a Bull Market : wait for buy signal       - A Green SMALL Up Arrow after a BIG green arrow is
Automatic redrawing of Trend Supports and resistances levels and Possible Wedge pattern formation to indicate price breaking of Rising Wedge (signal SELL) or price breaking of falling Wedge (signal BUY) Very simple and smart indicator  ALERTS AND MOBILE NOTIFICATIONS availavle !!! you can edit the calculation bars of the bars count for formation of the trend lines and the initial shift from current price  Smaller values for bars /shift inputs when using Higher Time frames (D1-H4) and the reverse
:::: It is programmed to work on any M5 Chat windows !! Used to determine the Strongest currency pairs and the Weakest pairs also detect the peak of deviation of currencies strength  IT CAN BE USED FOR INDICES AND STOCKS TOO !! Strategy one : It can be used in to BUY Strongest pair and SELL Weakest one Strategy two: It can be used on Daily basis to Hedge BUY Strongest pair with high % (ex: +1%) and BUY Weakest one with % lower(ex: -0.7%) the same with SELL  Strategy three: on 3days  or above ca
Auto redrawn Pivot support resistance horizontal lines  with signal of Buy/Sell possibilities with SL level and with trend support resistance lines too used for all symbols and time frames  you can adjust inputs parameters (only 2) and test it on various symbols and time frames input number of bars for calculation and moving average for signal accuracy example : use it on M30 time frame with input 200 for bars count and 100 for MA
A simple Approach to Elliot waves patterns Signal generated on trend continuation when breaking the "5" level or on corrective direction after 1-5 waves detected 1-5 labeled points arrows used for signal UP/DOWN direction Chaotic patterns in Blue are drawn all times until  a 1-5 Elliot wave pattern detected  1-5 Red pattern in Bull Market : UP arrow in BULL trend continuation OR DOWN arrow  as a reversal DOWN direction as pattern correction 1-5 Green pattern in Bear Market :DOWN arrow in BEAR tr
YOU DON'T HAVE TO SHIFT ON ALL TIME FRAMES FOR EACH CURRENCY PAIR TO CONCLUDE ITS TREND AND ITS POWER YOU HAVE IT ALL IN ONE TABLE , 20 CURRENCY PAIR WITH 5 TIME FRAMES ALSO , COMPARE BETWEEN CURRENCIES STRENGTH AND ALERTS THE STRONGER /WEAKER PAIR BASED ON 5 TIMEFRAMES CALCULATIONS The Power meter currencies table is a very helpful tool to indicate the TREND strength of up to 20 currencies pairs  using 5 time frames M5 M30 H1 H4 and D1 ( latest version You SELECT you own 5 timeframes from M1 t
HEDGING  MASTER line indicator    It compares the power/strength lines of two user input symbols and create a SMOOTHED line that indicates the degree of deviation of the 2 symbols Strategy#1- FOLLOW THE INDICATOR THICK LINE when CROSSING O LEVEL DOWN --- TRADE ON INDICATOR THICK LINE (TREND FRIENDLY) !! Strategy#2- TRADE INDICATOR PEAKS (Follow indicator Reversal PEAKS Levels)!! you input - the index of calculation ( 10/20/30....)                 - the indicator Drawing start point (indicator hi
Auto redrawn Pivot support resistance horizontal lines  with signal of Buy/Sell possibilities with SL level and with trend support resistance lines too used for all symbols and time frames  you can adjust inputs parameters (only 2) and test it on various symbols and time frames input number of bars for calculation and moving average for signal accuracy example : use it on M30 time frame with input 200 for bars count and 100 for MA
Smart and simple Indicator based on wolves waves reversal pattern also near to falling and rising wedge and butterfly patterns with Stoploss and entry signal preferred time frame M30 : with parameters bars count used for calculation = 200 and moving average for accuracy = 100; you can try it for other higher or lower parameters and try your own set of inputs higher timeframe = lower input !!! important note ::: Indicator don't back draw when first installed on Chart  once installed wait for new
Trend Lines Signal
Mohamed yehia Osman
This Indicator provides Buy/Sell Signal based on calculations on Higher frame (Trend) and Lower frame(Entry signals) * You should select the higher and lower frame for indicator calculations * You select the Trend line colors as you prefer * Enable or disable Alerts! Trend lines UP/Down are drawn when a trend is detected Wait for small arrows for entry : *Normally an UP arrow in an UP Trend is a BUY signal : ---you Close the BUY position IF a Reverse DOWN Trend signal appears Or when Up trend li
Moving Trend Lines
Mohamed yehia Osman
Simple moving trend lines with support and resistance moving levels  used on any time frame on any symbols input: # of bars for trend lines (10-20- 50-100-200----) as per your time frame and your strategy  and     moving period ( 10-20 -50-100-200----) as per your time frame and your strategy Direction Arrows : UP and DOWN are drawn when breaking the trend lines ALerts available at Arrows appearance...  
Buy Sell Zones
Mohamed yehia Osman
Simple indicator for BUY / Sell Zones moving Buy and Sell zones : Closest zone is wide and clear : Red for Sell zone , Green for Buy zone >>> old far zones are in bold lines :::BUY Zones (GREEN) appear only in UP Trend and disappear in DOWN Trend :::SELL Zones (RED) appear only in DOWN Trend and disappear in UP Trend input parameters ::: index bars : bars range for zone calculation levels : number of zones  Up move/Down move arrows mail and message Alerts !! used on any symbol used on any timefr
Crazy Dancing moving RES/SUP Levels Automatic redrawing of moving Supports and resistances levels  to indicate price breaking supports (signal SELL)  or breaking resistance levels (signal BUY) Very simple appearing indicator but very clever and smart too !!!! Main Inputs: # of bars for the support and resistances levels + the initial shift from start + moving average for filter signaling Smaller values for bars /shift inputs when using Higher Time frames (D1-H4) and the reverse higher values for
Select from up to 6 Strategies solo or Combine different strategies for signal generation  (Combining more than 2 strategies may LIMIT a lot the number of signals)! ALL From Chart !!! Also Inputs editing from Chart !!! Push your strategy bottom (one strategy) OR Combine signal from as may strategies (up to 6) : Selected and enabled strategies will be in GREEN !!! 1- BUY SELL areas 2- Support resistance break signal 3- Elliot wave continuation /reversal signal 4- Advanced Moving averages 5- Tren
SMOOTH DEVIATION line indicator for 2 symbols   It compares the power/strength lines of two user input symbols and create a SMOOTHED line that indicates the degree of deviation of the 2 symbols Strategy#1- FOLLOW THE INDICATOR THICK LINE when CROSSING O LEVEL DOWN --- TRADE ON INDICATOR THICK LINE (TREND FRIENDLY) !! Strategy#2- TRADE INDICATOR PEAKS (Follow indicator Reversal PEAKS Levels)!! you input - the index of calculation ( 10/20/30....)                 - the indicator Drawing start point
Simple 3 Moving  supports and resistance levels (Your Review /comment and feedback is important  !! Thanks) Signal UP and Down possibilities created on crossing the multi supports/resistance levels supports all time frames Adjusted inputs for area covered for generating the levels and the shifts needed to cover 3 areas supports /resistances levels for example you may use main parameters in M30 time frames: extern int ShiftFromStart=20;  extern int barsCount=20; extern int sequenceShifts=50;  in
SMOOTH STRENGTH METER INDICATOR (SMOOTH LINE) it draws Currencies TREND Volatility Power / Strength lines : -       Detects the 2 highly TRENDED Volatile pairs  ( will be the Bold Lines ) - A very Helpful Indicator - It draws smooth lines for up to 20 currencies pairs representing Volatility  strength and power - First it indicates the most powerful trended direction pairs : Strongest / Weaker -       MAIN FUNCTION  :it gives indication of the       UP trend most Volatile Line  and the      DOWN
PowerMeter Currencies Table1
Mohamed yehia Osman
5 (1)
SYMBOL POWER based on inputted 5 time frames and Compared to 20 Other Symbols !! Great Indicator YOU DON'T HAVE TO SHIFT ON ALL TIME FRAMES FOR EACH CURRENCY PAIR TO CONCLUDE ITS TREND AND ITS POWER YOU HAVE IT ALL IN ONE TABLE , 20 CURRENCY PAIR WITH 5 TIME FRAMES ALSO , COMPARE BETWEEN CURRENCIES STRENGTH AND ALERTS THE STRONGER /WEAKER PAIR BASED ON 5 TIMEFRAMES CALCULATIONS ALEERTS enable /disable using 5 time frames M5 M30 H1 H4 and D1   ( latest version You SELECT you own 5 timeframes from
Automatic redrawing of Trend Supports and resistances levels and Possible Wedge pattern formation to indicate price breaking of Rising Wedge (signal SELL) or price breaking of falling Wedge (signal BUY) Very simple and smart indicator  ALERTS AND MOBILE NOTIFICATIONS availavle !!! you can edit the calculation bars of the bars count for formation of the trend lines and the initial shift from current price  Smaller values for bars /shift inputs when using Higher Time frames (D1-H4) and the reverse
Multi Strategies Single Combined   Select from up to 6 Strategies solo or Combine different strategies for signal generation  (Combining more than 2 strategies may LIMIT a lot the number of signals)! ALL inputs and Strategies selection From Chart !!! Also Inputs editing from Chart !!! Push your strategy bottom (one strategy) OR Combine signal from as may strategies (up to 6) : Selected and enabled strategies will be in GREEN !!! 1- BUY SELL areas 2- Support resistance break signal 3- Elliot wave
Buy Sell Zones1
Mohamed yehia Osman
Buy Sell Zones   Simple indicator for BUY / Sell Zones moving Buy and Sell zones : Closest zone is wide and clear : Red for Sell zone , Green for Buy zone >>> old far zones are in bold lines :::BUY Zones (GREEN) appear only in UP Trend and disappear in DOWN Trend :::SELL Zones (RED) appear only in DOWN Trend and disappear in UP Trend input parameters ::: index bars : bars range for zone calculation levels : number of zones  Up move/Down move arrows mail and message Alerts !! used on any symbol u
Trend Lines Signal   This Indicator provides Buy/Sell Signal based on calculations on Higher frame (Trend) and Lower frame(Entry signals) * You should select the higher and lower frame for indicator calculations * You select the Trend line colors as you prefer * Enable or disable Alerts! Trend lines UP/Down are drawn when a trend is detected Wait for small arrows for entry : *Normally an UP arrow in an UP Trend is a BUY signal : ---you Close the BUY position IF a Reverse DOWN Trend signal appear
Multi Strategies Combined Signal All in One   Multi Strategies Single Combined   Select from up to 6 Strategies solo or Combine different strategies for signal generation  (Combining more than 2 strategies may LIMIT a lot the number of signals)! ALL inputs and Strategies selection From Chart !!! Also Inputs editing from Chart !!! Push your strategy bottom (one strategy) OR Combine signal from as may strategies (up to 6) : Selected and enabled strategies will be in GREEN !!! 1- BUY SELL areas 2-
SYMBOL POWER based on inputted 5 time frames and Compared to 20 Other Symbols !! Great Indicator YOU DON'T HAVE TO SHIFT ON ALL TIME FRAMES FOR EACH CURRENCY PAIR TO CONCLUDE ITS TREND AND ITS POWER YOU HAVE IT ALL IN ONE TABLE , 20 CURRENCY PAIR WITH 5 TIME FRAMES ALSO , COMPARE BETWEEN CURRENCIES STRENGTH AND ALERTS THE STRONGER /WEAKER PAIR BASED ON 5 TIMEFRAMES CALCULATIONS ALEERTS enable /disable using 5 time frames M5 M30 H1 H4 and D1     ( latest version You SELECT you own 5 timeframes fr
TWO SYMBOLS CORRELATION  line indicator    It compares the power/strength lines of two user input symbols and create a SMOOTHED line that indicates the degree of deviation of the 2 symbols Strategy#1- FOLLOW THE INDICATOR THICK LINE when CROSSING O LEVEL DOWN --- TRADE ON INDICATOR THICK LINE (TREND FRIENDLY) !! Strategy#2- TRADE INDICATOR PEAKS (Follow indicator Reversal PEAKS Levels)!! you input - the index of calculation ( 10/20/30....)                 - the indicator Drawing start point (ind
Symbols Strength meter Graph  :::: It is programmed to work on any M5 Chat windows !! Used to determine the Strongest currency pairs and the Weakest pairs also detect the peak of deviation of currencies strength  IT CAN BE USED FOR INDICES AND STOCKS TOO !! Strategy one : It can be used in to BUY Strongest pair and SELL Weakest one Strategy two: It can be used on Daily basis to Hedge BUY Strongest pair with high % (ex: +1%) and BUY Weakest one with % lower(ex: -0.7%) the same with SELL  Strateg
Trend and Reversal V1
Mohamed yehia Osman
Trend Follower and Reversal Trend handler * EA opens X Lot position (calculated according to Lot risk value) with trend with indicated TP if Trend reversal occurs * EA opens 5 X Lot (if input " Reversal Lot scaling" = 5     ) position with reversal trend with indicated TP and same SL for old trend position * Increasing LOT risk value + Increasing Reversal Lot scaling value = High Risk and High Profit and High DD * Decreasing LOT risk value + Decreasing Reversal Lot scaling = Low Risk and Low Pr
the Advanced MOVING AVERAGE indicator This is a formula of moving average based on support and resistance levels Two Colors indicator : UP trend --> Green                                 Down trend -->Red Arrows UP/Down are shown for trend reversal indication  ALERTS and mobile Push NOTIFICATIONS  Simple Strategy :  BUY on price over new green line Sell on price under new red line Works on any TIMEFRAME MAin  Input for calculation :  index  = 20.. 50..100..500 ... 1000 (Lower time frame -> Hig
Filtro:
FOREXFORYOU1973 Norbert Chrulski
62
FOREXFORYOU1973 Norbert Chrulski 2022.01.27 23:14 
 

L'utente non ha lasciato alcun commento sulla valutazione.

rizkyxrick
369
rizkyxrick 2022.01.14 04:34 
 

L'utente non ha lasciato alcun commento sulla valutazione.

Rispondi alla recensione