Pivot Support Resistance Crossing Signal
- Indicatori
- Versione: 1.20
- Aggiornato: 24 agosto 2019
- Attivazioni: 5

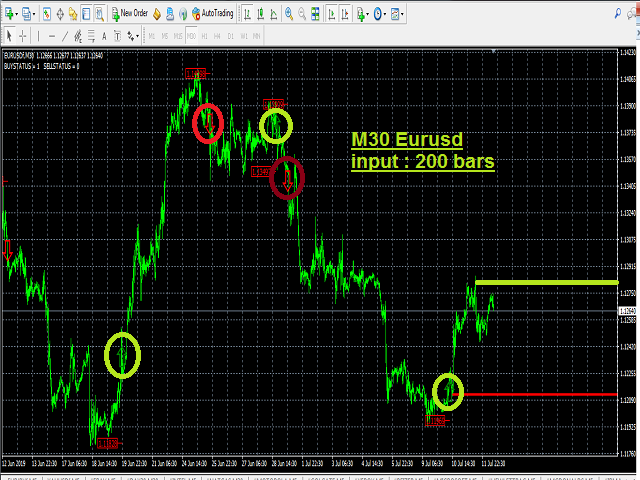
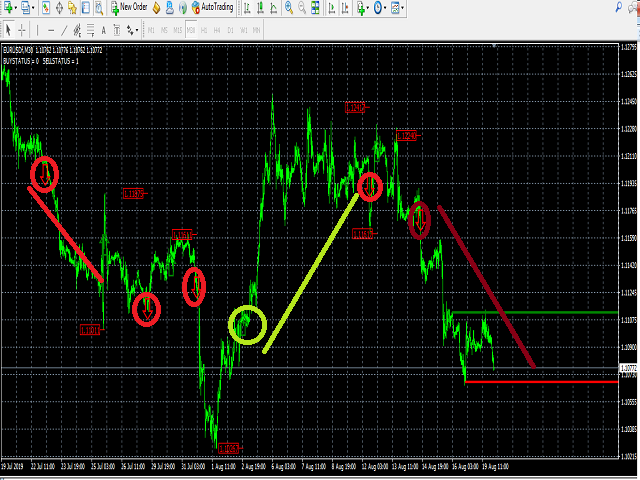
Auto redrawn Pivot support resistance horizontal lines
with signal of Buy/Sell possibilities with SL level
and with trend support resistance lines too
used for all symbols and time frames
you can adjust inputs parameters (only 2) and test it on various symbols and time frames
input number of bars for calculation and moving average for signal accuracy
example : use it on M30 time frame with input 200 for bars count and 100 for MA