Nomen Magic Candle

🎯 Nomen Magic Candle – Basta con il caos sui grafici! Indicatore MT4 No Repaint

L'attesa è finalmente finita.

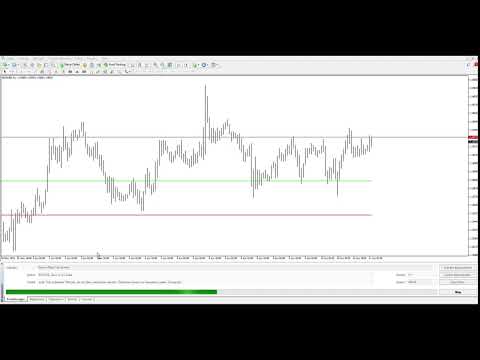
È arrivato il momento di una rivoluzione sul tuo schermo. Benvenuto sul "Magic Chart".

Utilizza queste linee tracciate in modo pulito come una strategia di trading ad alta precisione, supportata da un'analisi di mercato algoritmica e moderna che decifra esattamente le zone di liquidità nascoste, offrendoti quel vantaggio decisivo e invisibile rispetto alla massa.

Ti senti anche tu sopraffatto?

Da analisi infinite, grafici sovraccarichi e indicatori che si contraddicono continuamente?

Molti trader passano ore a cercare l'ingresso perfetto. Il risultato? La paralisi da trading. Alla fine, nonostante dieci linee e oscillatori diversi sul grafico, non si sa ancora verso quale direzione il prezzo romperà.

🔮 La filosofia: Chiarezza radicale al posto della confusione

Nomen Magic Candle elimina completamente il rumore visivo dai tuoi grafici. Trasforma l'intera estetica del grafico in un design pulito e chiaro, concentrandosi sull'unica cosa che conta davvero: la pura Price Action e le zone chiave istituzionali.

Nessuna formula matematica complessa che rincorre il mercato. Nessuna combinazione infinita di indicatori. Solo tu e il mercato – in assoluto equilibrio.

🚦 Le regole: Tanto geniali quanto semplici

L'indicatore elimina ogni dubbio e divide il mercato in due zone ben distinte:

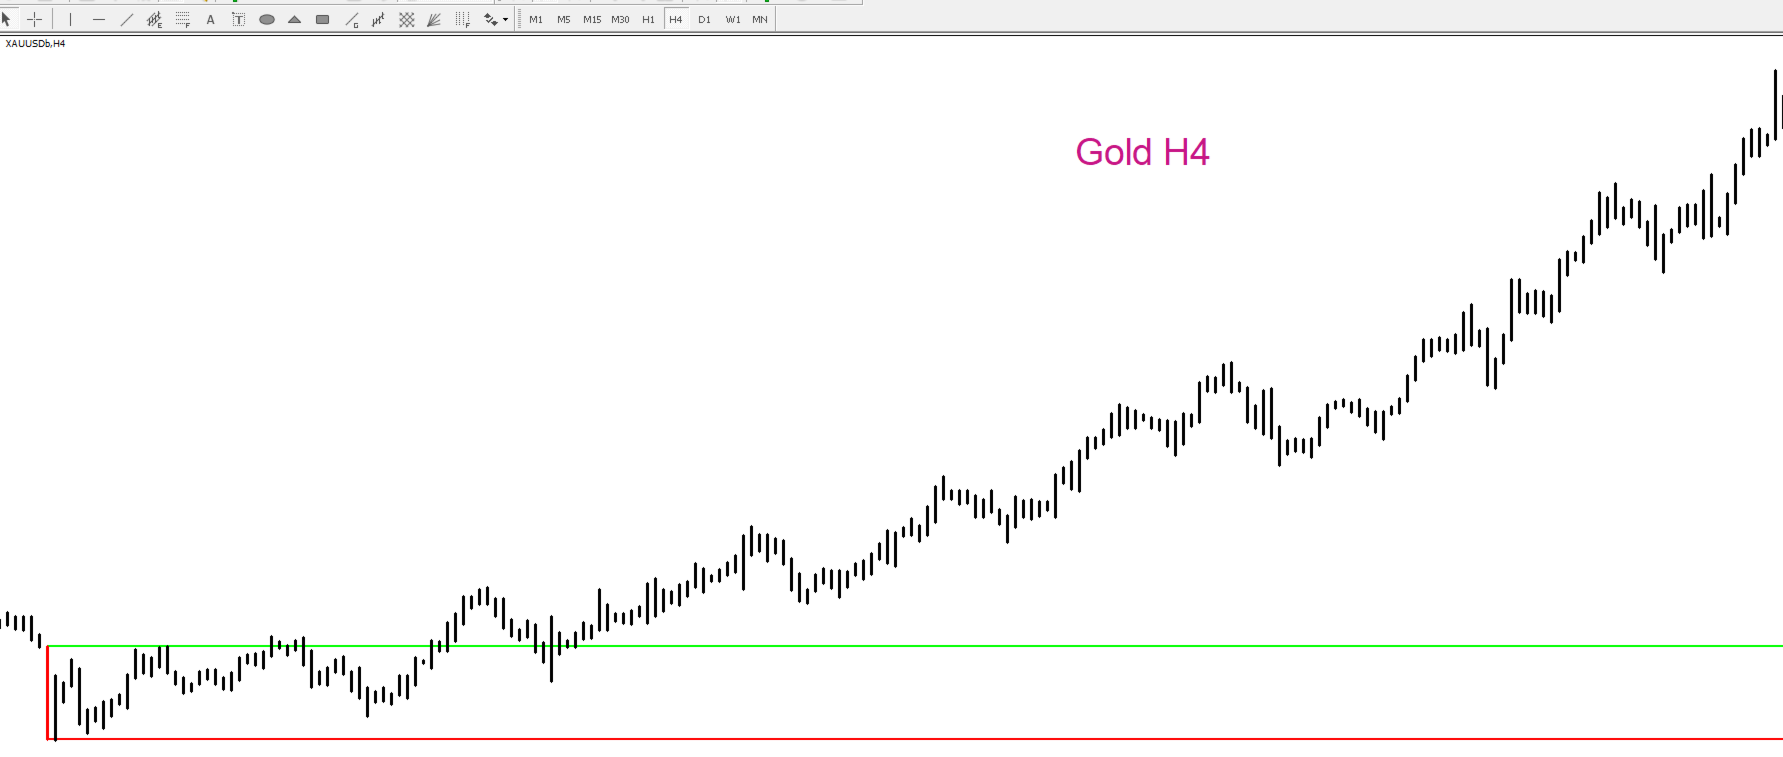
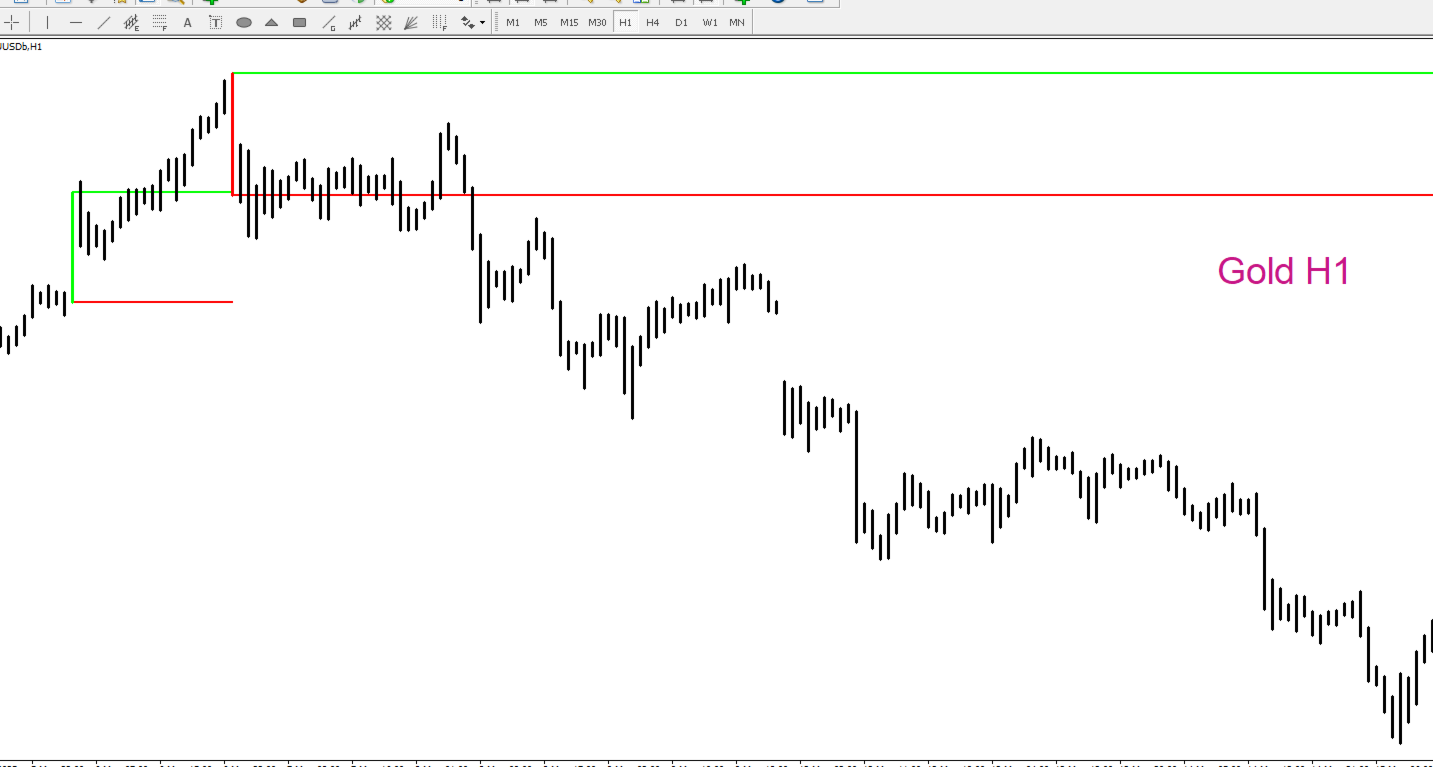
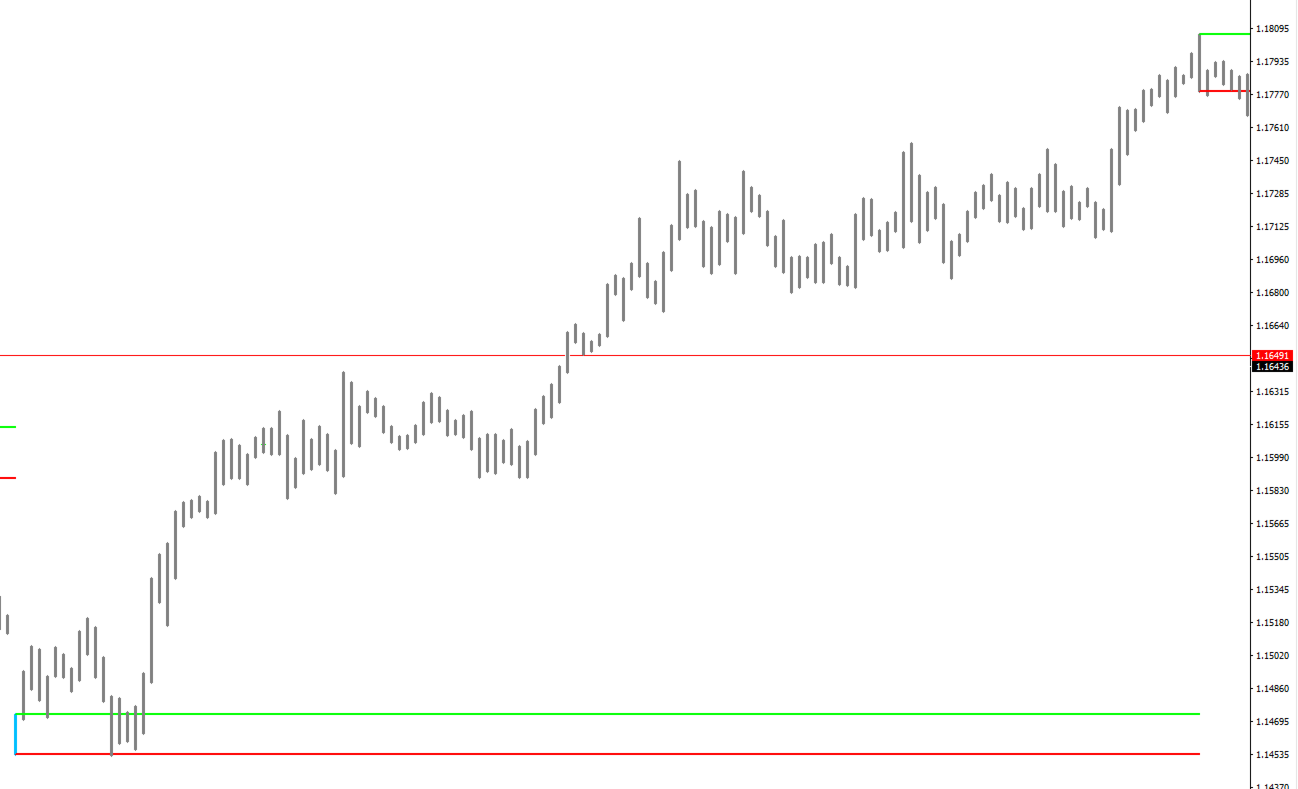
  • 🟢 Sopra la linea verde: Qui domina l'assoluta potenza dei compratori (Bulls). Il tuo unico focus sono gli ingressi Long (acquisto).

  • 🔴 Sotto la linea rossa: Qui dominano i venditori (Bears). Il tuo unico focus è la vendita (Short).

Cosa significa per te: Massima concentrazione, nessun'esitazione e un filtro direzionale cristallino per ogni singolo trade.

🚀 Per chi è adatto il Nomen Magic Candle?

Questo indicatore è un vero e proprio strumento tuttofare e si adatta a qualsiasi stile di trading:

  • Scalper & Day Trader: Trova zone intraday precise alla velocità della luce sui timeframe più piccoli (da M1 a M30).

  • 🌊 Swing Trader: Cavalca i grandi trend su H1, H4 o Daily, senza lasciarti confondere dal rumore di mercato a breve termine.

  • 🔰 Principianti: Impara fin dal primo giorno a fare trading nella giusta direzione del mercato, senza cadere nella tipica trappola degli indicatori.

  • 🏆 Trader avanzati: Utilizza queste linee pulite come una strategia di trading ad alta precisione, basata su un'analisi di mercato moderna che opera nell'ombra per rendere visibili le tracce del denaro istituzionale.

🔑 La chiave del successo: Gestione del rischio (Risk Management)

Nota importante: Il Nomen Magic Candle è uno strumento potente che ti indica la direzione. Tuttavia, il Santo Graal del trading risiede nella tua disciplina. In combinazione con una solida gestione del capitale e del rischio, questo "Magic Chart" può essere la soluzione tanto attesa per portare i tuoi risultati al livello successivo e dare finalmente costanza al tuo trading.

💻 Caratteristiche & Contenuto:

  • Design unico del grafico: Imposta automaticamente il tuo grafico in una modalità "White Mode" pulita e professionale (la griglia e le candele standard vengono minimizzate per la massima chiarezza visiva).

  • Candele di segnale automatiche: Evidenzia le candele di breakout e di inversione di tendenza rilevanti con un colore di segnale ben distinto.

  • Linee di zona dinamiche: Traccia le bande chiave verdi e rosse in modo completamente automatico fino al successivo evento di mercato rilevante.

  • Completamente ottimizzato: Nessun parametro nascosto nella finestra delle impostazioni – l'indicatore è subito pronto all'uso ("Plug & Play").

Libera i tuoi grafici e fai trading finalmente con leggerezza. Ottieni il Nomen Magic Candle oggi stesso!


Prodotti consigliati
I concetti alla base di questo indicatore, che gli conferiscono un vantaggio unico e incisivo, si fondano sulla "TEORIA" dei FAIR VALUE GAPS, ideata e sviluppata da Arjo, uno dei migliori mentori del settore. Io stesso ho contribuito allo sviluppo dei concetti spiegati. La serie di video includerà link originali a YouTube per spiegazioni complete e approfondite, oltre a screenshot del sistema MT4/MT5 in esecuzione. Tutti i sistemi pubblicati saranno disponibili separatamente per MT4 e MT5, per a
Alpha Trend sign has been a very popular trading tool in our company for a long time. It can verify our trading system and clearly indicate trading signals, and the signals will not drift. Main functions: Based on the market display of active areas, indicators can be used to intuitively determine whether the current market trend belongs to a trend market or a volatile market. And enter the market according to the indicator arrows, with green arrows indicating buy and red arrows indicating se
BinaryScalping
Andrey Spiridonov
BinaryScalping is a professional indicator for trading binary options and scalping. The algorithm of the indicator is based on the calculation of pivot points for each time period separately, the location of the price of the trading instrument relative to the pivot points is analyzed and the probability of a trading operation is calculated. The indicator has a built-in filter of trading signals based on the global trend. The indicator is installed in the usual way and works with any trading inst
This is an arrow indicator without a future function,developed based on the most advanced profit trading algorithms.It has the most innovative and advanced dual trend analysis module, as well as the latest and highly effective market trend prediction algorithm.Trends are your friends, and following larger trends can earn the maximum profit in foreign exchange. This indicator helps traders identify current trends and track them. Someone once made a profit of 10 times in a week by relying on it.No
Trend Flasher Trend is your friend is the age old saying quote in trading arena, there are though many ways to gauge the trend and its direction, more scientific measure and logically meaningful will be an ATR break outs to identify and spot the trend and its acceleration, so we created this easy to use trend identification panel and optimized super trend based multi time frame panel entry system to aid and help the traders to make their trading decision. Unique Features of Trend Flasher 1. H
Msht Price Pattern MT4
Ngoc Hoai Thuong Doan
Instantly spot simple candlestick patterns with MSHT Price Pattern MSHT PRICE PATTERN can automatically detect more than 200 different candlestick patterns, including multi-candle patterns. This makes it easy for you to see if what you care about is present on a chart or not at a glance, and reduces the amount of time you have to stare at charts to check off items on your investment checklist. Candlestick Pattern Recognition is supported on charts, alerts, in scanners and smart checklists. All
DMAX pro
Danny Teoh Kok Keong
DMAX SIGNAL IS VERY POWERFUL TOOL TO HELP YOU ENTRY,ITS CAN DETECT OVERSOLD AND OVERBOUGHT IN FOREX MARKET. ITS CAN TRADE 24 FOREX PAIR IN MARKET, 80% ACCURATE RESULT. MANY TRADER FAIL BECAUSE OF ENTRY POINT AND EXIT POINT , SIGNAL OF DMAX WILL GIVE VERY GOOD SIGNAL TO LET YOU KNOW WHERE TO ENTRY AND EXIT.  RISK MANAGEMENT IS VERY IMPORTANT IN TRADING FOREX, PLEASE DONT RISK OVER 5% PER TRADE IS FORE MARKET
Gold Trader Pro Indicator
Massimiliano Tuzzolino
4.4 (5)
Gold Trader Pro is an advanced analytical tool specifically engineered for professional trading on XAUUSD (Gold). It provides an immediate comprehensive overview of market structure across 7 different timeframes, allowing traders to identify flow direction and signal strength through a modern, draggable, and interactive interface. Key Features Multi-Timeframe Analysis: Real-time monitoring of M1, M5, M15, M30, H1, H4, and D1. Two Operational Modes: MODE_SCALPING: Optimized for fast-paced analys
FREE
RaysFX Supertrend Bar RaysFX Supertrend Bar è un indicatore personalizzato per MetaTrader 4. Utilizza l'indice di canale delle materie prime (CCI) per generare segnali di trading. L'indicatore mostra dei puntini in una finestra separata sotto il grafico principale per indicare i segnali di trading. Caratteristiche principali: Calcola il CCI per diversi periodi temporali. Visualizza puntini per indicare i segnali di trading. Permette all'utente di modificare i periodi temporali e la distanza tra
This is the complete REX package. It consists of the lite, pro and ULTRA version.  Perfect for beginners and intermediates. REX complete is 100% non repaint. The strategy is based on a mix of different strategies, statistics, including pivot points, oscillators and patterns.  As the trading idea consists of a variety of some classic indicators like Momentum, Williams Percent Range, CCI, Force Index, WPR, DeMarker, CCI, RSI and Stochastic, it is clear that the fundamental indicators have being u
PipStartex is an indicator for scalping. It draws overbought/oversold price zones on the chart in the form of a channel. It also draws yellow dots on the chart when the price goes beyond the channel. When the price goes beyond this channel, it always tries to return back. Knowing this pattern, every trader can use it for trading. When the price in the oversold zone goes beyond the channel below the red zone, we open a buy deal. When the price in the overbought zone goes beyond the channel above
BinaryUniversal
Andrey Spiridonov
BinaryUniversal is a signal indicator for binary options and Forex. In its work, the indicator uses a complex algorithm for generating signals. Before forming a signal, the indicator analyzes volatility, candlestick patterns, important support and resistance levels. The indicator has the ability to adjust the accuracy of the signals, which makes it possible to apply this indicator for both aggressive and conservative trading. The indicator is set in the usual way, it works on any time period and
Sharp Scalper
Mazin Salim Said Ba Abbad
The “Sharp Scalper” indicator is high-frequency trading tool designed for quick, short term trades in the forex market. It focus on identifying rapid price movement and generating signals for best entry. This indicator is known for its ability to capture small profit opportunities multiple times throughout the day making it ideal for scalpers looking to capitalize on market volatility. The” sharp scalper” indicator employs advance algorithms to detect market trends and fluctuation, helping trade
Towers
Yvan Musatov
Towers - Trend indicator, shows signals, can be used with optimal risk ratio. It uses reliable algorithms in its calculations. Shows favorable moments for entering the market with arrows, that is, using the indicator is quite simple. It combines several filters to display market entry arrows on the chart. Given this circumstance, a speculator can study the history of the instrument's signals and evaluate its effectiveness. As you can see, trading with such an indicator is easy. I waited for an a
Arbitrage Indicators is a professional and easy-to-use Forex trading indicator that uses the best trading principles of the latest AI arbitrage models. This indicator provides accurate buy and sell signals. Applies to currency pairs only. It has six different metrics options, MACD, KDJ, RSI, CCI, RVI, DEMARK. It can be freely switched by users, and intuitively shows the direction and reversal signal of the currency pair. When the two lines cross colors, the currency has a high probability of rev
The indicator detects and displays М. Gartley's Butterfly pattern. The pattern is plotted by the extreme values of the ZigZag indicator (included in the resources, no need to install). After detecting the pattern, the indicator notifies of that by the pop-up window, a mobile notification and an email. The pattern and wave parameters are displayed on the screenshots. The default parameters are used for demonstration purposes only in order to increase the amount of detected patterns. Parameters z
Rira Renko
Vitor Palmeira Abbehusen
RENKO on Time Chart This indicator is an enhanced Renko, so you can watch the Renko bricks on the chart to understand price movement more clearly the other improvement is automated box size according to ATR (Average True Range) period you can set the ATR number as you want and the box size of Renko changes automatically based on price movement Inputs Mode: Box size is the input to specify the size of the Renko box you want to print on the chart. This input lets you choose the fixed box siz
El indicador "MR BEAST ALERTAS DE LIQUIDEZ" es una herramienta avanzada diseñada para proporcionar señales y alertas sobre la liquidez del mercado basándose en una serie de indicadores técnicos y análisis de tendencias. Ideal para traders que buscan oportunidades de trading en función de la dinámica de precios y los niveles de volatilidad, este indicador ofrece una visualización clara y detallada en la ventana del gráfico de MetaTrader. Características Principales: Canal ATR Adaptativo: Calcula
WanaScalper MT4
Isaac Wanasolo
1 (1)
A scalping indicator based on mathematical patterns, which on average gives signals with relatively small SL, and also occasionally helps to catch big moves in the markets (more information in the video) This indicator has three main types of notifications: The first type warns of a possible/upcoming signal on the next bar The second type indicates the presence of a ready signal to enter the market/open a position The third type is for SL and TP levels - you will be notified every time price re
Overview Base Box Indicator automatically detects and draws institutional supply and demand base zones using the Rally-Base-Rally (RBR) and Drop-Base-Drop (DBD) price action methodology — one of the most reliable frameworks for identifying high-probability reversal and continuation areas. Unlike basic support/resistance tools, this indicator isolates the precise consolidation phase (the "Base") between two impulse moves and renders it as a structured 3-layer box that separates candle bodies from
Fxland Price Reversal Zones (MT4) FXLAND Smart Reversal Indicator is a professional technical analysis tool designed to help traders identify potential price reversal zones and key market turning points with clarity and precision. The best reversal indicator and price return by choosing only one ceiling or floor in each time frame A masterpiece of combining mathematics and Gann, fractal matrix, Fibonacci, movement angle and time. Completely intelligent Key Features Detects potential pr
FairyFibo
Syed Oarasul Islam
FairyFibo  can generate as many as 70 different BUY signals and 70 different SELL signals solely based on Price Action and Fibonacci levels. The idea is to catch as many as Swing High's and Swing Low's but with the consideration of the current trend mind. This indicator can be also used for Binary Options Trading as most of the time price tends to follow the signal direction immediately. Most of the strategies are already optimized for different time frames and different market conditions. While
Il sistema di trading tecnico delle frecce BB è stato sviluppato per prevedere punti inversi per prendere decisioni al dettaglio. L'attuale situazione di mercato è analizzata dall'indicatore e strutturata per diversi criteri: l'aspettativa di momenti di inversione, potenziali punti di svolta, segnali di acquisto e vendita. L'indicatore non contiene informazioni in eccesso, ha un'interfaccia comprensibile visiva, che consente ai trader di prendere decisioni ragionevoli. Tutte le frecce sembrano
OFFER! OFFER! NEXT Price Will be 650$ and the rental option will be removed after this. Don't miss the current price offer before it is too late. Dear Traders I am so glad to introduce my Super Powers Indicator.  The purpose of this trading tool is to help serious traders who want to make trading one of their main source of income.  I know trading is not an easy task but if you have the right tools, knowledge and motivation to trade then you are ready to go in this industry. My role is to help y
PZ Swing Trading
PZ TRADING SLU
5 (3)
Protect against whipsaws: revolutionize your swing trading approach Swing Trading is the first indicator designed to detect swings in the direction of the trend and possible reversal swings. It uses the baseline swing trading approach, widely described in trading literature. The indicator studies several price and time vectors to track the aggregate trend direction and detects situations in which the market is oversold or overbought and ready to correct. [ Installation Guide | Update Guide | Tro
È progettato per essere utilizzato da chiunque, anche il principiante assoluto nel trading può usarlo. NON ridipinge MAI. Le indicazioni sono date da vicino a vicino. Progettato per essere utilizzato da solo, non sono necessari altri indicatori. Ti dà la tendenza e il potenziale Take Profit all'inizio della giornata. Un grafico specifico mostra il potenziale profitto in base ai dati storici. Come funziona Breakout Pro Scalper Solution utilizza una strategia di breakout combinata con azione su
ReboltP
David Theodore Caro-greene
Rebalance Overlay Technology (Rebolt) enables the trader to visualize the flow of money from one chart to another chart. Rebolt Probability indicates the probability that money has flowed from one chart to another chart for a specified length of time over a number of intervals specified by the user. When Rebolt reads Cyan or Blue these are buying signs good for the length of time specified by the user or until a conflicting signal arises. When Rebolt reads Violet or Red there are selling signs g
Limitless MT4
Dmitriy Kashevich
Limitless MT4 is a universal indicator suitable for every beginner and experienced trader. works on all currency pairs, cryptocurrencies, raw stocks Limitless MT4 - already configured and does not require additional configuration And now the main thing Why Limitless MT4? 1 complete lack of redrawing 2 two years of testing by the best specialists in trading 3 the accuracy of correct signals exceeds 80% 4 performed well in trading during news releases Trading rules 1 buy signal - the ap
This indicator is designed for scalping on low timeframes (M1-M15) in volatile markets like major forex pairs (e.g., EURUSD, GBPUSD). It generates non-repainting buy (green up arrow) and sell (red down arrow) signals based on EMA crossover confirmed by RSI momentum and MACD crossovers, minimizing false signals in ranging markets. How to Use: Attach the indicator to your MT4 chart. Look for arrows on the chart: Buy on green up arrow, Sell on red down arrow. Signals appear at the open of the new
Gold Phoenix
Yaroslav Varankin
The perfect tool for Scalng in the Forex markets You can trade both from signal to signal and using take profit  The algorithm does not use Zigzag!  No redrawing!  This is a channel instrument that uses a moving average as a filter. Moving Average  There are 2 parameters for the settings Ma Period = 5 period Moving Average  Channel 1.0 distance of channel lines from the chart Price Signal Filter - calculation of signal opening and filter There is a complete set of Alert There is a multi-timefram
Gli utenti di questo prodotto hanno anche acquistato
Indicatore Miraculous – Strumento Forex e Binario 100% Non-Repaint Basato sul Quadrato di Nove di Gann Questo video presenta l' Indicatore Miraculous , uno strumento di trading altamente accurato e potente, sviluppato specificamente per i trader di Forex e Opzioni Binarie . Ciò che rende unico questo indicatore è la sua base sul leggendario Quadrato di Nove di Gann e sulla Legge della Vibrazione di Gann , rendendolo uno degli strumenti di previsione più precisi disponibili nel trading moderno. L
Precautions for subscribing to indicator This indicator only supports the computer version of MT4 Does not support MT5, mobile phones, tablets The indicator only shows the day's entry arrow The previous history arrow will not be displayed (Live broadcast is for demonstration) The indicator is a trading aid Is not a EA automatic trading No copy trading function The indicator only indicates the entry position No exit (target profit)  The entry stop loss point is set at 30-50 PIPS Or the front hi
Rtc ML Ai Predictor MT4
Muhammad Faisal Sagala
Rtc ML Ai | Predictor CORE MACHINE LEARNING ENGINE Adaptive ML Market Predictor – Multi-Bar Trend & Candle Forecast What This Indicator Does This indicator is a  real-time market prediction engine  designed to analyze price behavior and estimate  future market tendencies . Unlike conventional indicators, this system  does not rely on static parameters or historical curve-fitting , but adapts its internal state dynamically during live market operation. Instead of using static rules, the indic
FFx Engulfing Setup Alerter gives trade suggestions with Entry, Target 1, Target 2 and StopLoss. Below are the different options available: Entry suggestion - pips to be added over the break for the entry 3 different options to calculate the SL - by pips, by ATR multiplier or at the pattern High/Low 3 different options to calculate the 2 TPs - by pips, by ATR multiplier or at Risk/Reward Offset the dashboard - any place on the chart Remove the suggestion once the price reached the SL line Lines
FFx InsideBar Setup Alerter gives trade suggestions with Entry, Target 1, Target 2 and StopLoss. Below are the different options available: Entry suggestion - pips to be added over the break for the entry Minimum candle size - to avoid too close buy/sell entry suggestions 3 different options to calculate the SL - by pips, by ATR multiplier or at the pattern High/Low 3 different options to calculate the 2 TPs - by pips, by ATR multiplier or at Risk/Reward Offset the dashboard - any place on the c
FFx OutsideBar Setup Alerter gives trade suggestions with Entry, Target 1, Target 2 and StopLoss. Below are the different options available: Entry suggestion - pips to be added over the break for the entry. 3 different options to calculate the SL - by pips, by ATR multiplier or at the pattern High/Low. 3 different options to calculate the 2 TPs - by pips, by ATR multiplier or at Risk/Reward. Offset the dashboard - any place on the chart. Remove the suggestion once the price reached the SL line.
FFx PinBar Setup Alerter gives trade suggestions with Entry, Target 1, Target 2 and StopLoss. Below are the different options available: Entry suggestion - pips to be added over the break for the entry Minimum candle size - to avoid too small candles 3 different options to calculate the SL - by pips, by ATR multiplier or at the pattern High/Low 3 different options to calculate the 2 TPs - by pips, by ATR multiplier or at Risk/Reward Offset the dashboard - any place on the chart Remove the sugges
The purpose of this new version of the MT4 standard indicator provided in your platform is to display in a sub-window multiple timeframes of the same indicator with its divergences. See the example shown in the picture below. But the display isn't like a simple MTF indicator. This is the real display of the indicator on its timeframe. Here's the options available in the FFx divergences indicator: Select the timeframes to be displayed (M1 to Monthly) Define the width (number of bars) for each tim
The purpose of this new version of the MT4 standard indicator provided in your platform is to display in a sub-window multiple timeframes of the same indicator with its divergences. See the example shown in the picture below. But the display isn't like a simple MTF indicator. This is the real display of the indicator on its timeframe. Here's the options available in the FFx divergences indicator: Select the timeframes to be displayed (M1 to Monthly). Define the width (number of bars) for each ti
The FFx Dashboard MTF alerter will show you on a single chart all the timeframes (M1 to Monthly) with their own status for the indicator. 2 Alert Options: Single timeframe: each selected timeframe alert separately when a signal occurs Multi timeframes: all selected timeframes must agree for an alert to be triggered Both options have an input to select the timeframes to be used for the alert(s). How to Understand the Status: Green/Red square: histogram above/below 0 line Green square + Red bord
The FFx Dashboard MTF alerter will show you on a single chart all the timeframes (M1 to Monthly) with their own status for the indicator. 2 Alert Options: Single timeframe: each selected timeframe alert separately when a signal occurs Multi timeframes: all selected timeframes must agree for an alert to be triggered Both options have an input to select the timeframes to be used for the alert(s). How to understand the status: Green/Red square: RSI above/below 50 line Green square + Red border: R
The FFx Dashboard MTF alerter will show you on a single chart all the timeframes (M1 to Monthly) with their own status for the indicator. 2 Alert Options: Single timeframe: each selected timeframe alert separately when a signal occurs Multi timeframes: all selected timeframes must agree for an alert to be triggered Both options have an input to select the timeframes to be used for the alert(s). How to understand the status: Green/Red square: Stoch above/below 50 line Green square + Red border:
The FFx Dashboard MTF alerter will show you on a single chart all the timeframes (M1 to Monthly) with their own status for the indicator. 2 Alert Options: Single timeframe: each selected timeframe alert separately when a signal occurs Multi timeframes: all selected timeframes must agree for an alert to be triggered Both options have an input to select the timeframes to be used for the alert(s). How to understand the status: Green/Red square: Price above/below Cloud (Kumo) Green square + Red bo
The FFx Dashboard MTF alerter will show you on a single chart all the timeframes (M1 to Monthly) with their own status for the indicator. 2 Alert Options: Single timeframe: each selected timeframe alert separately when a signal occurs Multi timeframes: all selected timeframes must agree for an alert to be triggered Both options have an input to select the timeframes to be used for the alert(s). How to understand the status: Green/Red square: MA pointing Up/Down Green square + Red border: MA po
The FFx Dashboard MTF alerter will show you on a single chart all the timeframes (M1 to Monthly) with their own status for the indicator. 2 Alert Options: Single timeframe: each selected timeframe alert separately when a signal occurs. Multi timeframes: all selected timeframes must agree for an alert to be triggered. Both options have an input to select the timeframes to be used for the alert(s). How to understand the status: Green square: Price above PSAR Red square: Price below PSAR Options
The FFx Dashboard MTF alerter will show you on a single chart all the timeframes (M1 to Monthly) with their own status for the indicator. 2 Alert Options: Single timeframe: each selected timeframe alert separately when a signal occurs Multi timeframes: all selected timeframes must agree for an alert to be triggered Both options have an input to select the timeframes to be used for the alert(s). How to understand the status: Green/Red square: CCI above/below levels (ie. 100/-100) Grey square: C
The FFx Dashboard MTF alerter will show you on a single chart all the timeframes (M1 to Monthly) with their own status for the indicator. 2 Alert Options: Single timeframe: each selected timeframe alert separately when a signal occurs Multi timeframes: all selected timeframes must agree for an alert to be triggered Both options have an input to select the timeframes to be used for the alert(s). How to understand the status: Green/Red square: ADX above level Grey square: ADX below level Red bor
The FFx Dashboard MTF alerter will show you on a single chart all the timeframes (M1 to Monthly) with their own status. 2 Alert Options: Single timeframe: each selected timeframe alert separately when a signal occurs Multi timeframes: all selected timeframes must agree for an alert to be triggered Both options have an input to select the timeframes to be used for the alert(s). How to understand the status: Green/Red square: bullish/bearish candle Options available in the FFx Dashboard Alerter
The [GRAFF] III manual trading system is based on multiple MetaTrader (MT4) indicators. Together, the entire PACK of GRAFF III indicators makes an advanced trading tool. The system consists of over 20 different custom-built indicators which have been carefully selected and tested in the long term to produce strong and efficient trading signals. The particular indicators are based on different mathematical formulas, so the entire system is calibrated to remove false signals from its own indicator
FFx Universal Strength Meter PRO is more than a basic strength meter. Instead of limiting the calculation to price, it can be based on any of the 19 integrated strength modes + 9 timeframes. With the FFx USM, you are able to define any period for any combination of timeframes. For example, you can set the dashboard for the last 10 candles for M15-H1-H4… Full flexibility! Very easy to interpret... It gives a great idea about which currency is weak and which is strong, so you can find the best pai
Pan PrizMA CD Phase is an analogue of the МetaТrader 5 indicator , and is an option based on the Pan PrizMA indicator. Details . Averaging by a quadric-quartic polynomial increases the smoothness of lines, adds momentum and rhythm. Extrapolation by the sinusoid function near a constant allows adjusting the delay or lead of signals. The value of the phase - wave status parameter (which is close in meaning to the trigonometric phase or the angle of the radius-vector rotation in the trigonometric p
FFx Basket Scanner
Eric Venturi-Bloxs
MetaTrader 5 version available here : https://www.mql5.com/en/market/product/24882 FFx Basket Scanner is a global tool scanning all pairs and all timeframes over up to five indicators among the 16 available. You will clearly see which currencies to avoid trading and which ones to focus on. Once a currency goes into an extreme zone (e.g. 20/80%), you can trade the whole basket with great confidence. Another way to use it is to look at two currencies (weak vs strong) to find the best single pairs
NostradamusMT4
Andrey Spiridonov
1 (1)
NostradamusMT4 is a powerful indicator from the set of professional trader. The indicator is based on Andrei Spiridonov's original price calculation method (ESTIMATED PRICE) for the current candle price. Advantages The indicator does not redraw. It works on any timeframes. Works with any trading instruments. Perfectly suitable for scalping and trading binary options. Parameters Color - color of the ESTIMATED PRICE FUTURE line. How to work with the indicator The indicator forms the ESTIMATED P
MetaTrader 5 version available here: https://www.mql5.com/en/market/product/25794 FFx Pivot SR Suite PRO is a complete suite for support and resistance levels. Support and Resistance are the most used levels in all kinds of trading. Can be used to find reversal trend, to set targets and stop, etc. The indicator is fully flexible directly from the chart 4 periods to choose for the calculation: 4Hours, Daily, Weekly and Monthly 4 formulas to choose for the calculation: Classic, Camarilla, Fibonac
Sweet Waffle
Christophe Godart
The arrows are calculated with: -     2 Parabolic  parameters -     2 ADX parameters -     4 Stochastic parameters We recommend to combine it with Parabolic, ZigZag or Elliot waves indicator. Always trade the trend! If you make sure to draw your trend lines and support/resistance zones you will just have to wait for the signal to appear. Take the trade. For Binary Options it is advisable to set the expiry time to 5-15 min in M1 chart. THIS INDICATOR IS ZERO REPAINT Best assets to trade: - EUR
Let´s try to make some real money! Call me profit addicted. I thought why not try to make THE dream come reality. With discipline, a clear strategy and this indicator I focus on entering the perfect trades. This indicator is very easy to use as you will get perfect entry points for Put or Call trades. The arrows are calculated with: -     Momentum  parameters -     Candle stick patterns -     Fundamental Price action We recommend to combine it with Parabolic, ZigZag or Elliot waves indicator
Pisces TheProfitZone "Pisces TheProfitZone MT4 Indicator Powered byFxGangster" This indicator will calculate new support and resistant zone everyday, and that give us a trading zone such as thats telling us TP and SL, So it still telling us for where should the price will go reach? Fore Example. Uptrend : If Price can stay upper a Line and price close higher above a Line, then the price will continue go up to reach next Line. Downtrend : If Price can't pass to stay upper a Line and the price
Altri dall’autore
The Trader Pro
Noomen Ben Khadimallah Khadimallah
Hier ist die professionelle Übersetzung ins Englische, die den seriösen und methodischen Ton beibehält und gleichzeitig die Fachbegriffe präzise überträgt: ️ The Trader Pro: The Methodical Decision-Support Tool for Gold and Forex No Martingale | No Grid | No Repaint Successful trading is not based on luck, but on the consistent application of a proven methodology. The Trader Pro was developed to relieve traders of the tedious manual chart analysis and to translate complex market constellation
Eruption Gold Entry EA
Noomen Ben Khadimallah Khadimallah
️ The Eruption Gold Entry EA: Precision Meets Performance Stop searching for the needle in the haystack. We present the Eruption Gold Entry EA —a highly sophisticated trading algorithm specifically developed for the dynamics of the gold market ( XAU/USD ) on MetaTrader 4. No Grid, No Martingale. Turning losses back into profit—almost every time. What Makes This EA So Special? While conventional bots often fail due to gold's volatility, this EA utilizes a dual timeframe analysis (H1 & M15) . Thi
Trend Zone Trapper Pro
Noomen Ben Khadimallah Khadimallah
TREND Pulse Trapper Pro The Ultimate Trend Reversal Indicator for MetaTrader 5 Get the Trend Trapper now and transform market chaos into structure. SHORT DESCRIPTION Never miss a trend reversal again. Trend Pulse Trapper Pro detects in real-time when institutional capital shifts sides — and marks exactly that candle on your chart. No guessing. No noise. Just crystal-clear signals. FULL DESCRIPTION What makes this indicator different? Most indicators show you what has already happened. Tre
Nomen Power Candle
Noomen Ben Khadimallah Khadimallah
Nomen Power Candle The Revolution of Market Analysis: Your Personal No-Repaint Trading Algorithm Are you tired of spending hours in front of the screen, analyzing charts, only to miss the perfect entry? The era of tedious market study is over. Welcome to the future of trading. Nomen Power Candle is not just an indicator—it is a fully automated analytical system that translates the entire complexity of the financial markets into two simple lines. While other traders get lost in the chaos, this to
Filtro:
Nessuna recensione
Rispondi alla recensione