Guarda i video tutorial del Market su YouTube
Come acquistare un Robot di Trading o un indicatore
Esegui il tuo EA
hosting virtuale
hosting virtuale
Prova un indicatore/robot di trading prima di acquistarlo
Vuoi guadagnare nel Market?
Come presentare un prodotto per venderlo con successo
Indicatori tecnici per MetaTrader 4 - 148

Binary Chronos – Indicatore per Opzioni Binarie su MT4 Segnali buffer : Frecce sul grafico per ingressi rapidi e supporto agli EA. ️ Scadenza : Predefinita — 1 candela. Basato sul trend : Rileva la direzione e segnala il miglior punto di ingresso. Ingresso sulla candela corrente : Il segnale è per ingresso immediato. ️ Martingala : Se la prima operazione fallisce, applicare una sola martingala sulla candela successiva . LevelEn : Un valore più alto garantisce segnali più precisi e

The indicator is designed to display information about current trading. The current information and statistics panel displays data on the number of trading orders, their profit and the number of lots. The equity status as a percentage of the balance of funds and the total profit of all orders on this instrument are also displayed. In the statistics panel, you can see information on closed orders from the beginning of the specified date in the settings. The panels have flexible settings for size

Automated Trading Session Logging and Real-Time PnL Display Overview Trade Journal Plus is a MetaTrader 4 indicator designed to automatically document your trading sessions and display real-time performance statistics on the chart. It helps traders analyze and review sessions efficiently—without the need for manual logging. Key Features Automatic Session Logging
Automatically records trade entries and exits, trade duration, and session statistics as you trade. Real-Time PnL Display
Shows the
IMPULSE REACTOR – Fai scalping con intelligenza. Reagisci più velocemente.
Impulse Reactor è costruito su un framework di esecuzione in tempo reale che monitora la struttura del mercato tramite un motore di prezzo personalizzato e ponderato. Non si basa su oscillatori convenzionali o incroci di medie mobili: traccia invece il momentum direzionale derivato dalle fasi di accelerazione e decelerazione intrabarra. Il sistema valuta ogni candela singolarmente, ricalibrando il bias in base all’intens
Key Features: Instant BUY/SELL Signals with clear entry levels 3 Take Profit Levels (TP1, TP2, TP3) – customize your risk/reward Dynamic Stop Loss based on market structure Trendline Breakout Logic – detects breakout confirmation automatically Real-time Signal Notifications (alerts, emails, push notifications) Works on all timeframes (M5 to D1 recommended) Compatible with all Forex pairs, gold, indices, and crypto How it works: Wait for a BUY or SELL signal based on trendline break

The indicator pick out trending pairs in that present day as it shown in screanshorts. It designed to make the users job very easy. How the Indicator works It shows 5 trending pairs and your job is to pick ones that suit your strategy. The Indicator is suitable for day traders and it shows the action during that day. The indicator is more like Currency Strength at advanced level. The indicator shows trending pairs in pips telling you which pair is leading. The Indicator numbers is updated every
Segnale PIP STORM
PIP STORM è un sistema avanzato basato su frecce, progettato per un'esecuzione ultra-frequente durante le fasi di alta volatilità del mercato. Il suo obiettivo principale è mantenere un flusso costante di segnali di scalping utilizzabili, senza fare affidamento su indicatori ritardati o abusati. Non predice — reagisce con precisione alle zone di transizione del prezzo, catturando micro-rotture e squilibri di liquidità con un motore di conferma minimalista in tempo reale.
Rim

The TPX Dash Needle is everything you need to find the famous Didi Needles on several timeframes and in several pairs at the same time. These are the simultaneous meeting of the 3, 8 and 20 averages that, aligned with the ADX indicator, are synonymous with large and strong movements in the market. Now with the new Heiken Aish filter, the name of the pair shows the direction of the Heiken Aish you choose, it can be weekly or daily, all signals will appear on the screen, but now you can configure

This indicator is designed to help you locate trending pairs in forex market s
Time Frames available M5 M15 M30 H1 H4 DAILY ( Recommended for day trading ) Weekly Monthly
In these time frames the indicator tells how much the markets have moved from the last 5m, 15m, last 24 hours, last 7 days, last 30 days and many others times frames tells the same thing.
Daily time frame is recommended because it tell use which per is trend during that particular day, It recommended fro trend pull back str

Bulls vs Bears Oscillator Pro Bulls vs Bears Oscillator Pro is a powerful custom indicator designed to measure the real-time strength of buyers (bulls) versus sellers (bears) in any financial market. Using a normalized approach to price deviations from a dynamic EMA baseline, this tool provides high-precision signals with clear visual markers. Key Features: Oscillator-based logic : Fluctuates around zero, showing bull/bear dominance. Clear entry signals : Buy/sell arrows when extreme zon

To get a signal, the indicator uses the linear break formula, the signal is not redrawn, since no indicators based on the moving average are used to get the signal, only price values and chart candles
Indicator settings 1 Line for signal - number of lines for forming a signal breakthrough 2 Up arrow colore - color of the up arrow 3 Down arrow colore - color of the down arrow 4 MTF period in minutes - selection of the period for multi-timeframe display (in minutes) 5 UpArrowCode - code of t
CCI (Commodity Channel Index) Indicator – Technical Accuracy on Your Chart Description:
The CCI (Commodity Channel Index) is a professional technical indicator designed to identify overbought and oversold conditions, as well as potential market reversal points. This indicator calculates the deviation of the typical price from its moving average, making it a powerful tool for both scalping and medium- and long-term trading.
Key Features:
Smooth CCI line with standard ±100 levels for clear re
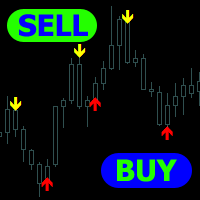
Scalper RS - è un indicatore di trading e analitico progettato per identificare i punti di inversione più probabili sul grafico dei prezzi.
L'algoritmo dell'indicatore che esegue la strutturazione dei prezzi consente di determinare combinazioni di inversione dei prezzi su vari strumenti di trading e intervalli di tempo.
Utilizzando il parametro variabile " Structuring " è possibile selezionare le impostazioni ottimali per il grafico di trading e l'intervallo di tempo desiderati.
Inizialment

Prime Strike Signal – Ingresso Chiaro. Nessun Repaint.
Prime Strike Signal No Repaint Never è uno strumento di segnale semplice e basato su regole, pensato per i trader che cercano chiarezza visiva e coerenza in condizioni di mercato volatili. Rileva i cambi di direzione con frecce immediate sul grafico, aiutandoti a restare allineata ai movimenti di prezzo a breve termine senza complicazioni inutili.
Rimani Aggiornata
Unisciti al canale ufficiale per restare informata su nuove versioni e agg
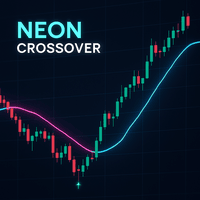
Neon Crossover – Indicatore dinamico di momentum e inversione Unisciti al canale per restare aggiornato: https://www.mql5.com/en/channels/forexnewadvisor
Neon Crossover è un indicatore multifunzionale progettato per rilevare con precisione inversioni di momentum e condizioni estreme. Analizza a fondo il comportamento dei prezzi utilizzando una logica complessa di pressione al rialzo/ribasso, combinata con un filtro dinamico e le Bande di Bollinger (BBs). È ottimizzato per scalping e strategie i

It is a technical indicator that combines three of the most popular oscillators in technical analysis: MACD, RSI, and Stochastic. The integrated advanced formula combines their signals to provide a single, clear and effective line, eliminating noise and helping you make quick, visual decisions.
What makes this indicator unique?
Integrates the difference between the MACD, RSI, and Stochastic into a single combined formula.
It displays the result in a separate window, like the ATR, making i

TrendMomentumLine is a powerful technical indicator that combines trend direction and market momentum strength into a single line. Its intelligent calculation integrates an Exponential Moving Average (EMA) and normalized momentum analysis, providing an accurate reading between 0 and 100 that allows you to identify optimal entry zones.
️ Detects high-probability zones by combining trend and strength. ️ Useful for scalping, intraday, and swing traders. ️ Perfect for confirming entries and exi

Pullback Scanner Line – Pullback Signal Indicator by Mr. Rami
Pullback Scanner Line is an advanced indicator that helps accurately identify trading opportunities based on reversals within the trend. It combines the strength of an exponential moving average (EMA) and Bollinger Bands to calculate a "pullback score," which reflects the probability of a favorable price reversal or continuation.
Key Features:
Uses a configurable EMA to detect trend direction.
Uses Bollinger Bands to measure vola
BTC Halving Objective Indicator
The BTC Halving Objective Indicator is a unique tool designed for traders and investors who follow Bitcoin halving cycles. This indicator adds vertical lines to the chart to mark previous and future halving events and displays in a sub-window whether the price is meeting historical post-halving growth targets.
What does this indicator do? It automatically draws key Bitcoin halving dates (previous and projected).
Calculates a target performance scenario based
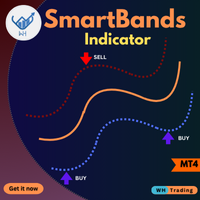
SmartBand is a powerful indicator designed to identify high-probability trade zones using a central reference line and dynamic upper and lower bands. When price reaches one of the bands,
and evaluates specific built-in conditions to trigger precise buy or sell signals — helping you spot potential reversals or breakouts with confidence. *Contact me after purchase for best guide* Key Features: Dynamic Band Structure : Central line with upper and lower bands adapting to price action. Smart
Binary Nas — Indicatore universale per opzioni binarie e Forex
Il tuo assistente affidabile per trading preciso in qualsiasi mercato! Caratteristiche principali: Multi-valuta e multi-timeframe
Funziona con tutte le coppie e timeframe: M1, M5, M15, M30, H1, H4, D1. Segnali in tempo reale
Frecce sul grafico: blu — acquisto, rossa — vendita. Frecce buffer
I dati sono memorizzati nei buffer, consentendo l’uso di EA per esecuzione automatica . Scadenza 1-3 candele (predefinito: 1
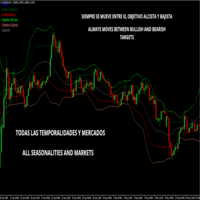
PRECISION BANDS: Precise Market Monitoring
Introduction Precision Bands is a strategy designed to provide a clear and accurate view of market dynamics, based on the statistical analysis of price movements. It uses standard deviations to define key support, resistance, and target zones, providing reliable levels for decision-making.
How it Works The system calculates a centerline based on the simple moving average of the closing price, accompanied by bands representing adjustable standard devi

Support and Resistance is the most basic science known to traders.
However, many people don't expect that the indicators used by big traders do not use indicators that have complex and complicated data, but rather return to using the most basic, namely Support and Resistance.
Here is the Support and Resistance Indicator that I made as simple as possible. Here you can determine the limits of strong Support and Resistance based on several provisions that you need.
In this indicator, you can fi

Draws a horizontal line at the previous day's highest price, with the line colored green. Draws a horizontal line at the previous day's lowest price, also in green. Draws a horizontal line at the high from two days ago, colored red. Draws a horizontal line at the low from two days ago, also in red. Currently, the indicator knows these, but it will be continuously developed, even by sending emails or push messages.
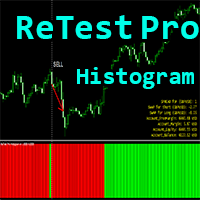
Indicatore Crypto_Forex "ReTest Pro Histogram" per MT4, senza ridisegno.
- L'indicatore ReTestPro_Histogram può essere utilizzato per la ricerca di segnali di ingresso nella direzione del trend principale dopo il nuovo test di un forte livello S/R. - L'istogramma ReTestPro può essere di 2 colori: rosso per un trend ribassista e verde per uno rialzista. - Quando si vedono colonne consecutive dell'istogramma stabili dello stesso colore, significa che si sta verificando un nuovo trend. - Il segna

Quant Impulse Signal – Nessun Repaint, Nessun Backpainting Quant Impulse Signal è uno strumento ad alta precisione progettato per evidenziare i punti di svolta del mercato confrontando le medie mobili esponenziali dei prezzi massimi e minimi. Reagisce in tempo reale all’azione del prezzo, fornendo segnali di ingresso chiari basati su movimenti confermati. Logica L’indicatore calcola una EMA a 8 periodi sui massimi e sui minimi di ogni candela su tutti i timeframe, quindi valuta il prezzo rispett

Shock Wave Signal – Nessun Repaint, Nessun Lag, Nessun Backpainting Shock Wave Signal sfrutta letture estreme del CCI per individuare inversioni di impulso marcate in qualsiasi timeframe. Genera segnali di ingresso precisi al close della candela quando il prezzo raggiunge livelli di ipercomprato o ipervenduto predefiniti. Logica L’indicatore calcola un Commodity Channel Index (CCI) a 5 periodi su ciascuna candela chiusa, analizzando fino a 600 candele di storico. Un segnale di acquisto compare q
Sfrutta la potenza dell'Estensione di Fibonacci per un trading più intelligente
Potenzia la tua strategia di trading con lo strumento di Estensione di Fibonacci, un'aggiunta formidabile al tuo arsenale di analisi tecnica. Questo indicatore, basato sulla rinomata sequenza di Fibonacci, consente di individuare con precisione i livelli chiave di supporto e resistenza. Estendendo i rapporti di Fibonacci del 23,6%, 38,2%, 50%, 61,8% e 100% da massimi o minimi significativi, offre informazioni chiare

Tiger Trend – Indicatore di inversione di tendenza basato su intervallo dinamico Unisciti al canale per restare aggiornato: https://www.mql5.com/en/channels/forexnewadvisor
Tiger Trend è un indicatore dinamico di tendenza progettato per rilevare potenziali inversioni di trend basandosi su livelli adattivi di supporto e resistenza calcolati a partire dagli intervalli di prezzo recenti. Aiuta i trader a identificare quando il momentum potrebbe cambiare, analizzando le chiusure dei prezzi rispetto
AO-Alert — Professional Signal Indicator Based on Awesome Oscillator AO-Alert is an auxiliary tool for MetaTrader 4 based on the analysis of the Awesome Oscillator (AO, by Bill Williams — a visual modification of the classic MACD, included in MT4 by default). The indicator is designed to identify key moments of trend emergence and development, making it ideal for scalping, intraday, and swing trading. AO-Alert helps you catch critical shifts in market dynamics and speeds up your decision-making
Signal Flash – Nessun Repaint, Nessun Lag, Nessun Backpainting Signal Flash individua con precisione i momenti di ingresso rilevando i crossover stocastici su barre già chiuse. Avvisa istantaneamente tramite marker sul grafico, notifiche sonore e via email, supportando tutti i simboli e i timeframe senza alterare i segnali storici. Logica L’indicatore calcola le linee %K e %D in base ai periodi scelti ( KPeriod , DPeriod , Slowing ) e al metodo di MA sul prezzo tipico o close/close. Appare una f

Questo SuperTrend migliorato è un indicatore tecnico avanzato progettato per MetaTrader 4. Combina diversi approcci analitici per rilevare inversioni di tendenza con un certo anticipo. Si basa su SuperTrend, candele Heikin-Ashi, l'indicatore ZigZag e una media mobile adattiva chiamata ZLEMA. L'indicatore genera segnali di acquisto o vendita quando viene rilevata un'inversione rigorosa secondo diverse condizioni: un cambiamento di colore delle Heikin-Ashi confermato dal RSI, un incrocio del prezz
SwingTracer – Indicatore dinamico di inversione di tendenza basato sulla gamma Unisciti al canale per restare aggiornato: https://www.mql5.com/en/channels/forexnewadvisor
SwingTracer è un indicatore dinamico progettato per rilevare potenziali inversioni di tendenza basate su livelli di supporto e resistenza adattivi calcolati dalle recenti gamme di prezzo. Aiuta i trader a identificare quando il momentum potrebbe cambiare, analizzando i prezzi di chiusura rispetto a queste soglie dinamiche.
Co

NSTALLAZIONE & SUPPORTO
Download immediato dopo l'acquisto Guida installazione semplice inclusa Documentazione completa con esempi Supporto clienti via MQL5
Smart Money Concepts | Indicatore SMC | Order Blocks | Fair Value Gaps | Struttura di mercato | Trading istituzionale | Strumento professionale | Swing trading | Scalping | Forex | Segnali | Zone di ingresso | Dashboard | Indicatore MT4
ACQUISTA ORA PRIMA CHE AUMENTI!
trasforma il tuo trading con l'analisi delle istituz
Buy 1 get 1 free
how each of these input fields is used and what happens on your chart when you adjust their values: Custom text for comment : How to use : Type any text you want into the "Value" field. Result : The text you type will appear in the top-left corner of the chart window (known as the Chart Comment). You might use this for the indicator's name, version, or your own short notes. Lookback period for regression calculation : How to use : Enter an integer (e.g., 100, 200, 300). Result

BinaryProfitFilter analizza l'efficacia storica dei segnali di trading e visualizza solo i segnali che soddisfano il livello di redditività specificato. Adatto per opzioni binarie, Forex e azioni. Parametri principali Parametro Valore predefinito Descrizione IndicatorName "Il Tuo Indicatore" Nome indicatore esterno BuyBuffer 0 Indice buffer acquisto SellBuffer 1 Indice buffer vendita SignalCount 3 Numero segnali analizzati per redditività TargetProfit 60.0 Percentuale redditività target ShowPr
Zone Hunter – Indicatore di segnale di rottura e di rientro nella fascia Unisciti al canale per rimanere aggiornato: https://www.mql5.com/en/channels/forexnewadvisor
Zone Hunter è un indicatore smart basato sull’azione del prezzo che identifica segnali di rottura e potenziali opportunità di rientro basate su zone di prezzo adattive. Aiuta i trader a individuare i momenti in cui il prezzo supera livelli dinamici di supporto o resistenza per poi ritornare offrendo ulteriori possibilità di ingress

Golden Panther è un indicatore di tendenza che mostra l'inizio e la fine di una tendenza. L'indicatore è progettato specificamente per il trading di oro e argento, ma funziona anche con altri strumenti finanziari. Quando inizia un trend, l'indicatore disegna una freccia nella direzione del trend e colora le candele fino alla fine del trend. L'indicatore non rallenta né si ridisegna. Consiglio di utilizzare il periodo di tempo M30, H1.
Signal Zero – Oscillatore di Momentum Multi-Dimensionale Unisciti al canale per rimanere aggiornato: https://www.mql5.com/en/channels/forexnewadvisor
Signal Zero è un oscillatore basato sul momentum progettato per aiutare i trader a identificare i cambiamenti nel sentiment di mercato attraverso un'analisi multilivello delle medie mobili, dei crossover di segnale e delle transizioni del momentum intorno alla linea zero. L'indicatore è altamente reattivo, adatto a tutti i timeframe e strumenti, d
Индикатор Стрелочник для Скальпинговой работы Философия и логика работы индикатора Этот индикатор создан для фильтрации рыночного шума и поиска мощных, подтвержденных трендовых движений. Его основная идея — входить в рынок только тогда, когда несколько независимых друг от друга математических моделей подтверждают наличие сильного тренда. Три алгоритма подтверждения: Чтобы определить направление и силу тренда, индикатор использует три совершенно разных подхода: Алгоритм 1: Моментум на основе С

Enhanced QPI Dashboard Indicator Professional Multi-Signal Trading System with Premium GUI Interface Overview The Enhanced QPI Dashboard is a sophisticated technical analysis indicator designed for MetaTrader 4 that combines multiple proven trading signals into one comprehensive system. This professional-grade indicator features a real-time dashboard interface that monitors market conditions and generates high-probability trading opportunities through advanced multi-timeframe analysis. Key

BBMA Oma Ally is a trading strategy that combines Bollinger Bands (BB) and Moving Average (MA) indicators developed by Oma Ally. This strategy is known for its high entry accuracy, low floating time, and the ability to make multiple entries.
Elaboration: BBMA Oma Ally: This strategy was developed by Oma Ally, a trader from Malaysia. The name "BBMA" comes from the Bollinger Bands and Moving Average indicators used.
BB and MA Indicators: Bollinger Bands are used to identify volatility and trend
Descrizione Generale
L'indicatore Binary Adaptive Trend Cross identifica con precisione i punti di ingresso nel mercato basandosi sull'incrocio di medie mobili con un ulteriore filtro di tendenza. Mostra segnali sotto forma di frecce ( blu per gli acquisti, rosse per le vendite) e supporta notifiche. Caratteristiche Principali
Ottimizzazione automatica in base alle condizioni di mercato
Filtro di tendenza per ridurre i falsi segnali
Impostazioni flessibili per la gener
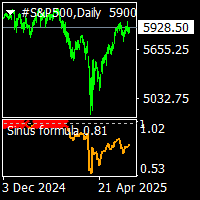
demo mode d value setled for gold. Sinus formula indicator non repaint trend indicator. it uses moving averages and sinus.. suitable for experienced trader and beginner. easy to use indicator. there is calibration constant d default d value setled for goldusd in demo backtest use only gold. d value can change acording to pairs. procedure is increase or lower d value acording to prices. when price top location increase or lover up to see red sign on level 1 when price bottom set d value blue sig
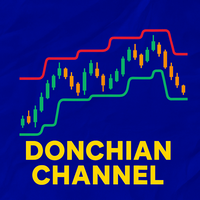
Donchian Channel – Customizable Indicator for MT4 This indicator draws the Donchian Channels cleanly and effectively, perfect for identifying breakouts, trends, and ranges.
Fully customizable – easily adjust colors, period, and line styles from the input settings.
Designed for both manual trading and as a base for automated strategies (EAs) .
Ideal for traders seeking a powerful, flexible visual tool to enhance their decision-making.

MFI Pulse Pro – Indicatore di Momentum Basato sul Money Flow Index Unisciti al canale per rimanere aggiornato: https://www.mql5.com/en/channels/forexnewadvisor
MFI Pulse Pro è un indicatore di momentum basato sul Money Flow Index (MFI), progettato per individuare visivamente le zone di ipercomprato e ipervenduto e rilevare potenziali punti di inversione. È compatibile con tutti gli strumenti finanziari ed è ottimizzato per timeframe da M1 a M30 .
Principali caratteristiche: Periodo MFI persona
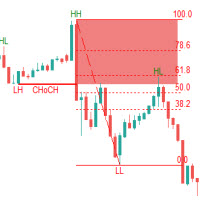
The Fibonacci Confluence Toolkit is a powerful indicator designed to highlights areas of interest where significant price action or reactions are anticipated, automatically applies Fibonacci retracement levels to outline potential pullback zones, and detects engulfing candle patterns.. This tool automates the detection and visualization of key market structures and potential reversal zones. Key Features: CHoCH Detection (Change of Character):
Automatically identifies structural shifts in marke
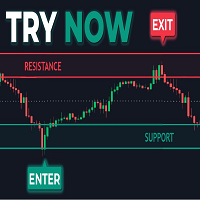
The Predictive Ranges indicator aims to efficiently predict future trading ranges in real-time, providing multiple effective support & resistance levels as well as indications of the current trend direction.
Predictive Ranges was a premium feature originally released by LuxAlgo in 2020.
The feature was discontinued & made legacy, however, due to its popularity and reproduction attempts, we deemed it necessary to release it open source to the community.
USAGE Figure 1 The primary purpo

Magic Price Action – Advanced Candlestick Pattern Recognition by Mr Green76
Elevate your price action trading with Magic Price Action , an advanced MetaTrader 4 indicator that streamlines candlestick analysis through automated detection, deep customization, and an intuitive on-chart control panel. Stop manually scanning charts—let Magic Price Action do the heavy lifting with precise, real-time identification of key candlestick patterns based on your personal strategy. Key Features Intellig
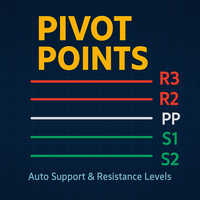
Pivot Points MT4 – Supporti e Resistenze Automatici con Precisione Professionale Scopri la potenza dell’analisi tecnica strutturata con Pivot Points MT4 , l’indicatore che traccia automaticamente i livelli chiave di resistenza (R1, R2, R3) e supporto (S1, S2, S3) , basandosi sui dati di prezzo del giorno precedente. Ideale per trader che cercano chiarezza, disciplina e un vantaggio tattico. Cosa fa questo indicatore? Calcola e disegna automaticamente i Pivot Point giornalieri . Mostra chiaram
Pivot SR Indicator - Powerful Technical Analysis Tool
Pivot SR is a professional indicator designed to identify key support and resistance levels in the market with high precision. This indicator offers:
Key Features : - 5 Pivot Point Calculation Methods (Classic, Camarilla, Demark, Fibonacci, Woodie) - Automatic calculation of support and resistance levels - Clean and easy-to-read visuals - Full customization of colors, styles, and appearance
️ Flexible Settings : - Choi
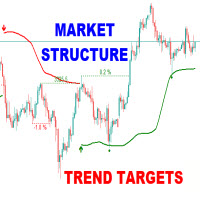
The Market Structure Trend Targets is a powerful trading indicator designed to give traders a clear, structured, and data-driven view of market momentum, breakouts, and key price reaction zones. Built on the principles of smart market structure analysis , it helps identify not only trend direction, but also precise breakout levels , trend exhaustion , and potential reversal zones — all with visual clarity and trader-friendly metrics. Key Features Breakout Points with Numbered Markers
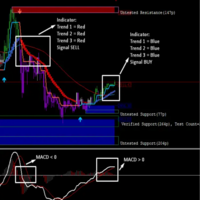
Scalping Road is a bundle of trading indicators and easy to use. There are 4 main indicator that give you a best signal to open position. You can do scalp or swing depend on timeframe you use.
After purchase you will be able to instantly download the Scalping Road indicator. Moreover I provide the extra indicator shown in the screenshots below to all users of the Scalping Road for free as a bundle! The combo of these indicators can help you make your trading with any timeframe easier and more

Historical Pivot Zones Indicator This is a sophisticated support and resistance indicator that automatically identifies and displays multiple price levels based on historical data. Here's what makes it valuable: Core Functionality The Historical Pivot Zones indicator analyzes previous time periods (2 days, 2 weeks, 2 months, or 2 years ago) to establish support and resistance zones that are projected onto your current chart. It creates a comprehensive framework of potential price reaction zones

This is an indicator that has been updated from the previous VRC indicator, which has both buy and sell arrows now, and it is optimised from the previous one. You can try it out, the version is upgraded and might suit your trading style. You can also use this indicator as a confluence, or you can use it as a main signal provider; it can be used along with your strategy or top-down approach analysis. Past performance does not guarantee future performance; kindly do a top-down analysis and keep yo

Smart Trendlines – No.1 Trendlines Indicator Smart Trendlines is a precision tool that automatically draws trendlines based on every valid pivot point, helping traders identify key support and resistance zones. It continuously adjusts as new market pivots form, providing a live and accurate reflection of price structure. Whether you’re tracking trends, preparing for reversals, or anticipating breakouts — this indicator keeps you one step ahead. It works seamlessly across all assets including For

The indicator identifies ordered trend structures. Each structure consists of at least three waves: the formation of the primary movement, a rollback, and a breakout of the primary movement.
One wave in the structure is considered to be the market movement between opposite price extremes, which corresponded to different positions of the points of the classic Parabolic Support And Reverse (PSAR) indicator relative to the closing prices of the candles: a point below the price - searching for a m

Supernova Trading Indicator – See the Market Like Never Before Supernova isn’t just an indicator — it’s your secret weapon. Powered by advanced algorithms and real-time analysis, Supernova cuts through the noise and reveals high-probability entry and exit points with stunning clarity. No more guesswork. No more hesitation. Whether you're trading forex, crypto, or stocks, Supernova adapts to any strategy and any timeframe — delivering clean, confident signals that help you trade faster, smarter,

Momentum Shark Pro is an advanced arrow-based trading system that provides high-accuracy signals for both new and experienced traders. With an adaptive algorithm, it displays clear buy and sell arrows, simplifying trading decisions. Optimized for key currency pairs and major sessions, Momentum Shark Pro helps users confidently capture high-probability entries and exits.
Features of Momentum Shark Pro Indicator Arrow-Based Signal System Displays buy and sell arrows directly on the chart for e

Fractal L.S Breakout Alert (v1.07)
Un indicatore non repaint che rileva fractal confermati e avvisa quando il prezzo li supera. Arricchisce ogni strategia con conferma oggettiva del breakout e filtraggio del rumore. Funzionalità Fractal non repaint – vengono segnati solo massimi/minimi confermati Linee di breakout – tracciate alla chiusura della candela oltre il fractal Modalità touch – rileva breakout al tocco o alla chiusura Etichette pip – opzionali, mostrano la distanza del breakout Avvisi

Solenox Boost — arrow-based price direction indicator. Solenox Boost is a visual arrow indicator that displays potential market entry points directly on the chart. It generates buy and sell signals based on the analysis of local highs and lows smoothed by moving averages, while also factoring in market volatility through the ATR indicator. Signals appear as clearly visible “BUY” and “SELL” text labels at precise price levels and times. It is strongly recommended to enter trades only after the cu

Atomic Market Session and Kill Zone Indicator v1.20 TRADING AUTOMATION EXPERTS - MT4 tools designed to enhance trader performance. ______________________________________________________________________________________________________________________________________________________________________________________
Master the Smart Money Strategy with Precision The Atomic Session and Kill Zone Indicator is designed for traders who follow the Smart Money Concept (SMC) . It allows you to define a

Indicatore Ticks - Il tuo strumento definitivo per il market timing Sblocca la potenza del trading di precisione con l'indicatore Ticks! Questo potente strumento per MetaTrader 4 ti aiuta a identificare opportunità di trading ad alta probabilità analizzando orari e giorni specifici in cui il mercato mostra pattern costanti.
Vantaggi principali dell'indicatore Ticks 1. Analisi intelligente basata sul tempo Indica orari di mercato specifici (ad esempio, "11:00") e visualizza immediatamente il co

Forecast Session Deviation - Product Description & User Guide Product Overview Forecast Session Deviation is a sophisticated trading indicator that identifies key market session zones and projects future price behavior based on historical patterns. By analyzing specific session anchors (like the Tokyo session), it creates visual zones that help traders anticipate where price is likely to move, complete with multi-level deviation bands for risk management. Key Features: Automatic session det
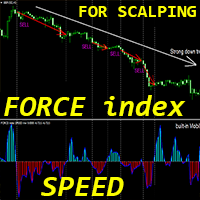
Indicatore Crypto_Forex "Force Index Speed" per MT4, senza ridisegno.
- Il calcolo di questo indicatore si basa su equazioni fisiche. Il Force Index Speed è la derivata prima del Force Index stesso. - Il Force Index è uno dei principali indicatori che combina i dati di prezzo e volume in un unico valore. - Il Force Index Speed è ottimo per scalping per entrare nella direzione del trend principale: usatelo in combinazione con qualsiasi indicatore di trend adatto. - L'indicatore Force Index
The *Account Growth Target* is a smart analytical tool for MT4 that predicts when your trading account will reach a specified profit target based on your current trading performance. By analyzing historical trade data and calculating profitability rates, it provides actionable insights to help you refine your strategy and stay motivated.
### *Key Features:* - *Target Balance Forecast* – Projects the exact date/time your account will hit your desired profit goal. - *Working Hours Fil
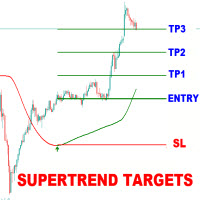
Supertrend Targets Signal is a powerful trend-following and breakout confirmation indicator designed to help traders identify high-probability entry points , visualize dynamic target zones , and receive clean, reliable signals across various market conditions. The core trend logic is built on a custom Supertrend that uses an ATR-based band structure with long smoothing chains—first through a WMA, then an EMA—allowing the trend line to respond to major shifts while ignoring noise. A key
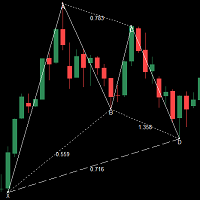
XABCD (Harmonic Pattern) Ratio Labeler – Simple, Visual Pattern Validation Tool This tool was designed for traders who work with harmonic or XABCD patterns and want a fast, flexible way to manually validate them on their chart. How It Works: Click a button to place 5 editable labels (X, A, B, C, D) directly on your chart. Drag them to your desired swing points. The tool automatically draws the connecting legs (XA, AB, BC, CD, etc.) and calculates key Fibonacci ratios: AB / XA BC / AB AD / XA

## Candle High Low Marker with Breakout Colored Candles Indicator
The **Candle High Low Marker with Breakout Colored Candles** is a powerful MetaTrader 4 (MT4) indicator designed to enhance technical analysis by marking high and low price levels of a specific candle within a user-defined time range and visually highlighting breakout candles with distinct colors. Ideal for traders seeking to identify key support and resistance levels and track price breakouts, this indicator provides clear visu
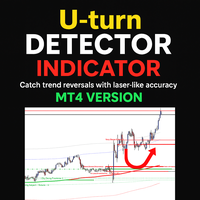
Turn Every Market Reversal Into a Money-Making Opportunity With the U-turn Detector Indicator! Imagine having a tool that visually reveals the exact moment price is about to flip — before the crowd catches on. The U-turn Detector isn’t just another indicator... it's your edge in spotting clean, confident entries and exits in forex. If you've ever been frustrated by fake breakouts, late signals, or messy charts — you're about to fall in love with this tool. URGENT REMINDER: PRICE MAY DOUBLE
Il MetaTrader Market è l'unico negozio online dove è possibile scaricare la versione demo gratuita di un robot di trading che consente di effettuare test e ottimizzazioni utilizzando dati statistici.
Leggi la descrizione dell'applicazione e le recensioni di altri clienti, scaricala direttamente sul tuo terminale e prova un robot di trading prima di acquistarlo. Solo sul MetaTrader Market è possibile testare un'applicazione in modo assolutamente gratuito.
Ti stai perdendo delle opportunità di trading:
- App di trading gratuite
- Oltre 8.000 segnali per il copy trading
- Notizie economiche per esplorare i mercati finanziari
Registrazione
Accedi
Se non hai un account, registrati
Consenti l'uso dei cookie per accedere al sito MQL5.com.
Abilita le impostazioni necessarie nel browser, altrimenti non sarà possibile accedere.