#define GRAPH_WIDTH 750
#define GRAPH_HEIGHT 350
#include <Graphics\Graphic.mqh>
CGraphic ExtGraph;
//+------------------------------------------------------------------+
//| Script program start function |
//+------------------------------------------------------------------+
void OnStart()
{
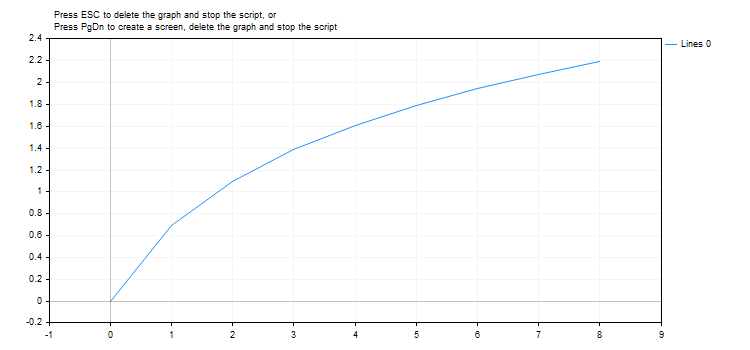
//--- ottenere 9 valori da 0 a 8 con il passo 1
vector X(9,VectorArange);
Print("vector X = \n",X);
//--- per ogni valore vettoriale, calcolare il logaritmo per l'espressione (1 + X valore vettoriale)
X=MathLog1p(X);
Print("MathLog1p(X) = \n",X);
//--- trasferire i valori calcolati dal vettore all'array
double y_array[];
X.Swap(y_array);
//--- traccia un grafico dei valori vettoriali calcolati
CurvePlot(y_array,clrDodgerBlue);
//--- attendere di aver premuto i tasti Escape o PgDn per eliminare il grafico (prendere uno screenshot) ed uscire
while(!IsStopped())
{
if(StopKeyPressed())
break;
Sleep(16);
}
//--- pulire
ExtGraph.Destroy();
/*
risultato:
vector X =
[0,1,2,3,4,5,6,7,8]
MathLog1p(X) =
[0,0.6931471805599453,1.09861228866811,1.386294361119891,1.6094379124341,1.791759469228055,1.945910149055313,2.079441541679836,2.19722457733622]
*/
}
//+-------------------------------------------------------------------------------+
//| Riempire un vettore con 'valori' con incremento di 'passo' |
//+-------------------------------------------------------------------------------+
template<typename T>
void VectorArange(vector<T> &vec,T value=0.0,T step=1.0)
{
for(ulong i=0; i<vec.Size(); i++,value+=step)
vec[i]=value;
}
//+-----------------------------------------------------------------------------------------------------------+
//| Quando si preme ESC, restituire 'true' |
//| Quando si preme PgDn, prendere uno screenshot del grafico e restituire 'true' |
//| Altrimenti restituire 'false' |
//+-----------------------------------------------------------------------------------------------------------+
bool StopKeyPressed()
{
//--- se viene premuto ESC, restituisce 'true'
if(TerminalInfoInteger(TERMINAL_KEYSTATE_ESCAPE)!=0)
return(true);
//--- se PgDn viene premuto e uno screenshot del grafico viene preso correttamente, restituisce 'true'
if(TerminalInfoInteger(TERMINAL_KEYSTATE_PAGEDOWN)!=0 && MakeAndSaveScreenshot(MQLInfoString(MQL_PROGRAM_NAME)+"_Screenshot"))
return(true);
//--- restituisce 'false'
return(false);
}
//+------------------------------------------------------------------+
//| Crea un oggetto grafico e disegna una curva |
//+------------------------------------------------------------------+
void CurvePlot(double &x_array[], double &y_array[], const color colour)
{
ExtGraph.Create(ChartID(), "Graphic", 0, 0, 0, GRAPH_WIDTH, GRAPH_HEIGHT);
ExtGraph.CurveAdd(x_array, y_array, ColorToARGB(colour), CURVE_LINES);
ExtGraph.IndentUp(30);
ExtGraph.CurvePlotAll();
string text1="Press ESC to delete the graph and stop the script, or";
string text2="Press PgDn to create a screen, delete the graph and stop the script";
ExtGraph.TextAdd(54, 9, text1, ColorToARGB(clrBlack));
ExtGraph.TextAdd(54,21, text2, ColorToARGB(clrBlack));
ExtGraph.Update();
}
//+------------------------------------------------------------------+
//| Fa uno screenshot e salva l'immagine in un file |
//+------------------------------------------------------------------+
bool MakeAndSaveScreenshot(const string file_name)
{
string file_names[];
ResetLastError();
int selected=FileSelectDialog("Save Picture", NULL, "All files (*.*)|*.*", FSD_WRITE_FILE, file_names, file_name+".png");
if(selected<1)
{
if(selected<0)
PrintFormat("%s: FileSelectDialog() function returned error %d", __FUNCTION__, GetLastError());
return false;
}
bool res=false;
if(ChartSetInteger(0,CHART_SHOW,false))
res=ChartScreenShot(0, file_names[0], GRAPH_WIDTH, GRAPH_HEIGHT);
ChartSetInteger(0,CHART_SHOW,true);
return(res);
}
|