Unisciti alla nostra fan page
- Visualizzazioni:
- 10019
- Valutazioni:
- Pubblicato:
- Aggiornato:
-
Hai bisogno di un robot o indicatore basato su questo codice? Ordinalo su Freelance Vai a Freelance
STRATEGY REPORT INTO CHART
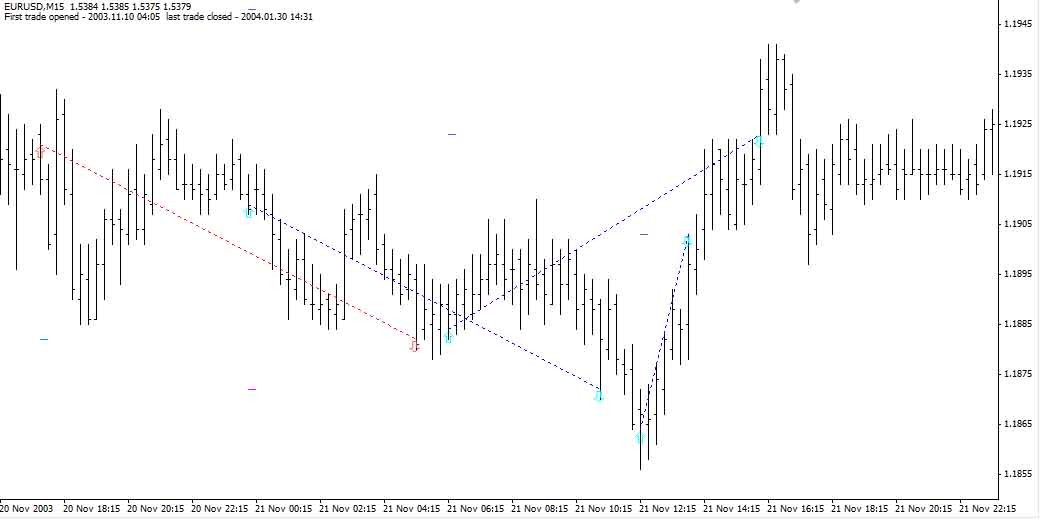
Drawing all results from a strategy tester report file into a chart.
Usually I use my script for backtesting of my strategy and checking within the chart.
How to use it ?
1) Load a file "StrategyTester.htm" into experts/files directory.
2) Run this script on a appropriate chart.
If all arrows are displayed in a wrong place with time shift, modify a variable Hour_shift. You can also change colors according to your background color.
A result of this script can look like that :

example
 Stochastic_Cross_Alert_SigOverlayM_cw
The indicator displays signals to buy/sell.
 XPoints
Indicator that predicts possible reversal points.
 OutQuotings
Unloading quotes from the selected period into an external file.
 i4 GoldenLionTrend v3
The indicator shows the trend. A code example for candlesticks colored in four different colors according to the trend strength.