
A New Approach to Interpreting Classic and Hidden Divergence. Part II

Introduction
In the first article, we considered a non-standard approach to the interpretation of divergence. We analyzed graphical constructions associated with it and briefly touched on the divergence itself, on divergence recognition quality and its classification. Moreover, the article did not cover filtering of deals traded based on the pattern. However, what we are used to taking for granted is not always that clear. Is the classic divergence form still efficient? The market might have changed so much that this approach is no longer relevant. In this part, we take a deeper look into the classic version and its non-standard interpretation. We will try to return a verdict for this strategy. If the result is positive, we will try to increase its effectiveness.
Terms and Definitions
Before proceeding to the main part, I would like to mention a bit of pre-history which served as the basis for this research, as well as to explain its "non-standard" nature. I worked as a technical analyst in a team of like-minded people who were trying to create a trading robot based on divergence principles. My task was to collect the maximum of related data, to analyze existing technical analysis tools and to determine the most suitable variant.
I also had to consider possible developments of events after the signal formation. All my research and analysis were a waste of time and effort. The desired result could be obtained by thinking rather than wasting CPU and human resources. However, there were positive results of my research. An indicator different from the existing one was created, some concepts that complicated technical analysis were changed or excluded. Divergence as a pattern became younger and was simplified: whether it exists or not, while classes like A, B, C were eliminated.
Divergence as a signal received a new life. In the process of this work, it became clear that any form of averaging, smoothing or recalculation have nothing to do with the market behavior. This is an attempt to fit a fact into our perception. We do not aim to create a huge research paper. The primary goal is to check whether this pattern is suitable for trading. We will return to this later. Related data search gave no result. It seemed that the authors were using the same sources for receiving basic information.
The most detailed description of the strategy based on this principle was provided by Alexander Elder in his book "The Strongest Signal in Technical Analysis", which described divergence and trend reversals. After reading this book, I had even more questions. The author set an obligatory condition: the indicator must cross the zero line, however, in the chapter "missing the right shoulder" divergences he describes the moments when this is an optional condition.
At that moment the MetaStock terminal did not have that linear MACD. Instead, two MAs were drawn in the terminal subwindow without any zero binding. As a result, it cannot be used the way described by the author. Elder uses a version of MACD, which is entitled OsMA in the MetaTrader 4/5 terminals, however it is called MACD throughout the book. There is no description of convergence (reverse divergence). Here the term convergence still describes divergence between the price action and the indicator. Furthermore, Elder rejects the analysis using other indicators which do not have the balance line (zero crossing). In particular, Stochastic is mentioned.
For a deeper analysis, other authors added division of the main pattern into three subgroups, A, B and C. The idea is that the greater the divergence, the greater the signal, so convergence should not be considered at all. Is this idea really valid? I showed the relevant distribution as an example in the previous material. The explanation of why I did not agree with this gradation was beyond the scope of the first part, so it was decided to leave everything as it is.
Most of these terms will not be used, while some of them will only be used for describing the general picture of what is happening. After reading this material, you may have the idea that divergence exists as a fact, while the divergence-convergence distribution is only considered in the context of additional graphical constructions described in the previous article. The divergence itself is conditionally divided into "stopping" and "reversal". Why is the division conditional? The signal is essentially a stopping one. Then the confirmation signal can show whether the market will reverse or not.
Let us consider a few examples.
Class A Divergence
Considered the strongest.
Bearish — the new price high is higher than the previous high, while the new indicator high is lower than its previous high.
Bullish — the new price low is lower than the previous low, while the new indicator low is higher than its previous low.
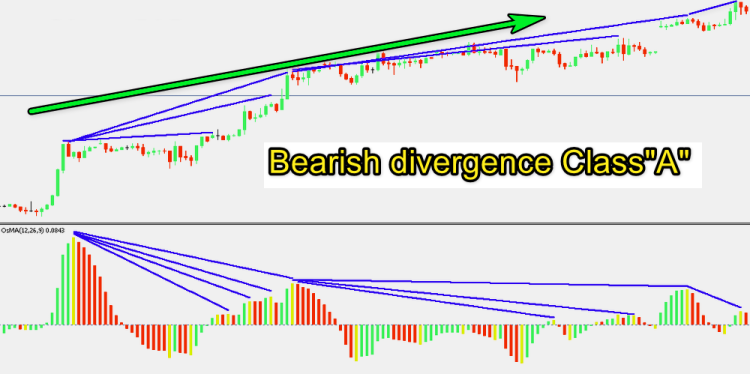
Fig.1
Such divergence is observed after a strong price movement (momentum). Most often, such a momentum is a signal for the emergence of a new trend, which means that the A class divergence cancels this rule by its "strength", as well as it cancels the inertia of market behavior and, in general, the entire wave theory. The right half of the upper figure can cause doubts about whether the pattern is detected correctly. The figures below seem to cause no doubts.
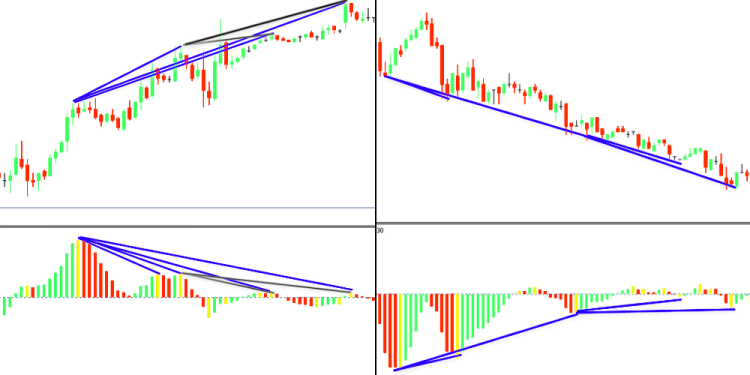
Fig. 2
Such a beginning can cause two, three or more divergences. The stronger the momentum, the longer the trend can last. This contradicts the idea that the greater the divergence, the stronger the signal.
Class B Divergence
A less significant market signal.
Bearish — chart highs are at the same level, while the right oscillator high is lower than the left one.
Bullish — price highs are at the same level, while the right indicator leg is higher than the left one.
Does this remind you of anything? These are the classic candlestick patterns Double Top and Double Bottom. In the source, it is described as a "Strong market reversal pattern". Thus, it is a reversal pattern, not a stopping one, which is among the main five patterns.
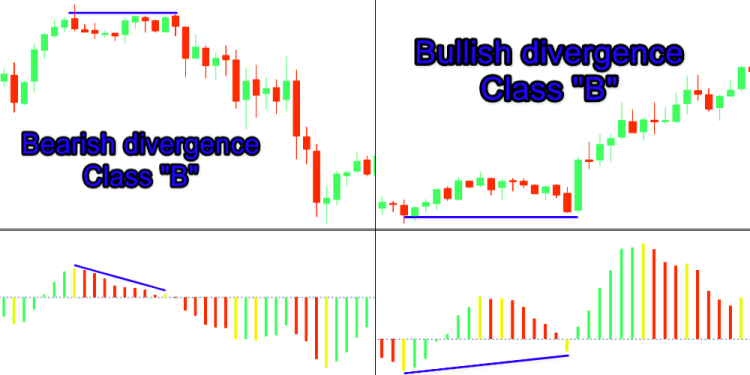
Fig. 3
The last subtype.
Class C Divergence
It is considered the weakest. There is an opinion that this pattern should be ignored.
Bearish — a new high is formed on the price chart, while the indicator highs are at the same level.
Bullish — the price forms a new low, oscillator lows are equal.
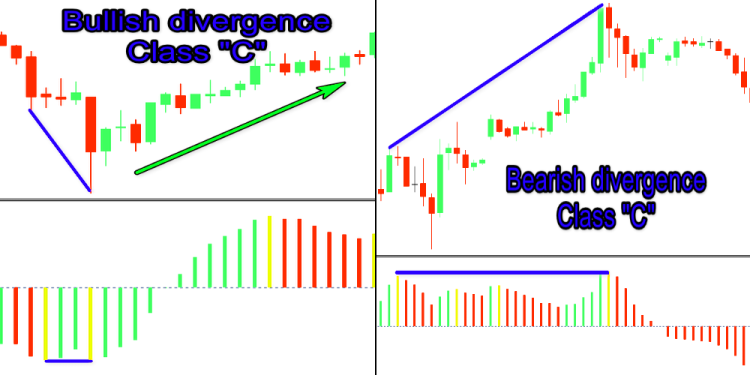
Fig. 4
Such price behavior is usually observed at strong resistance and support levels, during the so-called "false breakdown" or active actions of market makers. It is associated with the sluggishness of the indicator. Although the signal cannot be treated as an unambiguous entry point, still it should not be ignored.
There are many other disagreements and inconsistencies, due to which I decided to study this divergences in more detail. We will not change terms and concepts globally in order not to mislead those who are familiar with them and those who will continue studying related materials.
Let's analyze our indicators.
MACD
The MACD indicator was created by Gerald Appel for stock price analysis. The indicator is very popular among traders. This popularity is due to the fact that its effectiveness has been tested for years and, as a result, there are a lot of related materials available. The name "Moving Average Convergence/Divergence" suggests that it is as if specifically designed for this purpose. There are two type of the indicator: Linear MACD and MACD Histogram.
Linear MACD:
- MACD=EMAsn-EMAln
- Signal=EMAmacd
- MACD Histogram:
- MACDn=Signal-MACD
where:
P is the price, usually equal to the Close price of the period, though other options are also available (Open, High, Low, Close, Median Price, Typical Price, etc.)
The following MACD settings are used by default:
- ЕМАs — (short) with a period of 12 days (two weeks).
- ЕМАl — (long) with a period of 26 days (one month).
- EМАa — (smoothing the difference) with a period of 9 values.
Both versions are presented in MetaTrader 5, but they have different names: MACD and OsMA. It must be remembered that MACD in the terminal is the linear MACD, while the MACD histogram is represented by OsMA.
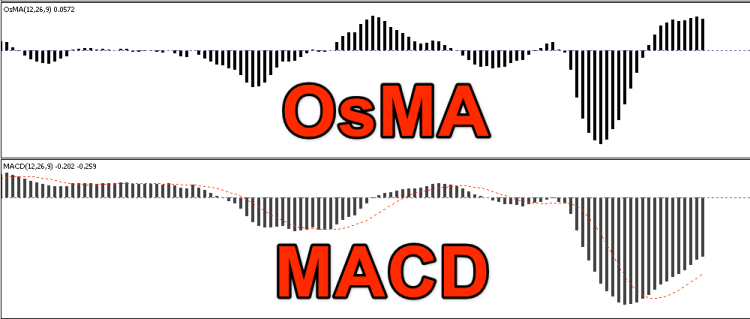
Fig. 5
Let us will consider both types.
MetaTrader 5 MACD is presented as a trend indicator, therefore it is expected that the classic diversion must accurately reflect the trend end. However, it's not that simple. This stems not only from different indicator interpreting rules, but also from the variety of types of the pattern. In the first part, I stated that the zero intersection was a clear sign of the general trend end. This is not quite true. There is another opinion of that a slight zero exit gives a stronger signal for a reversal.
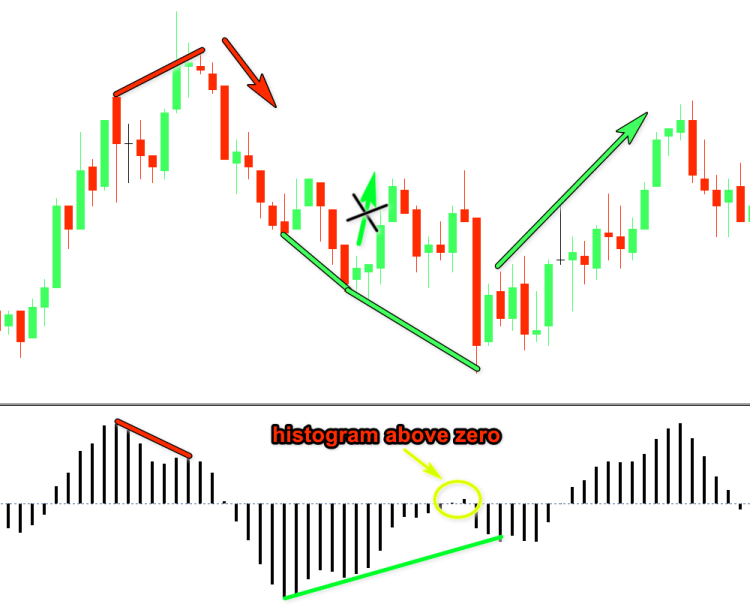
Fig. 6
In this case, 0 crossover is a mandatory condition. In particular, this opinion is shared by Alexander Elder. And this is not the most global of disagreements. Both rules can be used, while application of each of them should be considered within a framework if a specific market situation.
However, the main issue occurs with the definition of the pattern. Our oscillator is based on candlestick close prices, then why do we search for new highs and lows?
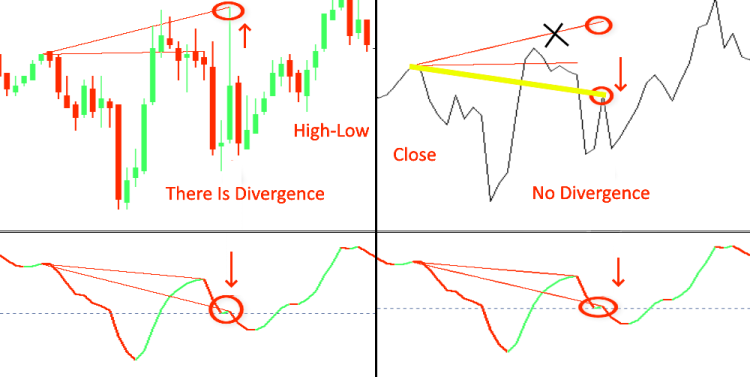
Fig. 7
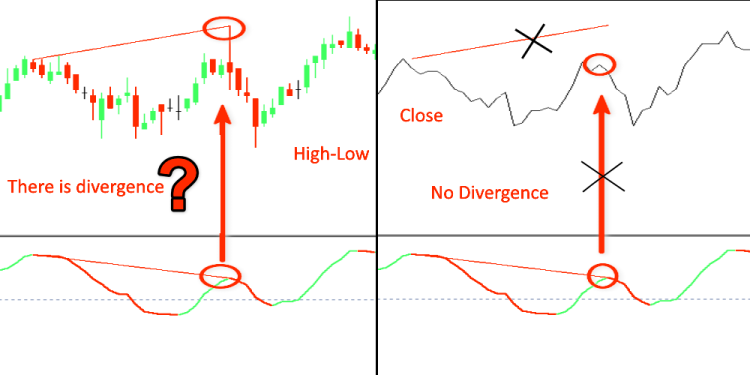
Fig. 8
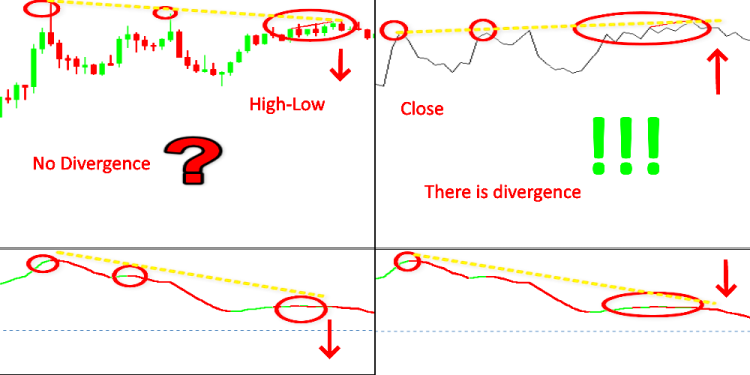
Fig. 9
Which is the right method? Which is more important, the price or the indicator value? Another disadvantage of the indicator is the long calculation period, 26-12, which makes it inappropriate for insignificant price movements. According to the classic divergence meaning, a pair of fractals should be found in indicator values and they should be compared with a price movement. However, the fractal does not form in minor price movements. For clarity, let us improve the standard version. We'll paint the bars in different colors, depending on the movement direction. This is not difficult. Let us modify the standard code. The line
#property indicator_buffers 4
4 to 5
#property indicator_buffers 5
line
#property indicator_type1 DRAW_HISTOGRAM
changes to
#property indicator_type1 DRAW_COLOR_HISTOGRAM
and
#property indicator_color1 Silver
changes to
#property indicator_color1 Green,Red,Gold
Another buffer is added to the variables
double Color_buff[];
and the initialization block now looks as follows
   SetIndexBuffer(0,ExtMacdBuffer,INDICATOR_DATA);
   SetIndexBuffer(1,Color_buff,INDICATOR_COLOR_INDEX);
   SetIndexBuffer(2,ExtSignalBuffer,INDICATOR_DATA);
   SetIndexBuffer(3,ExtFastMaBuffer,INDICATOR_CALCULATIONS);
   SetIndexBuffer(4,ExtSlowMaBuffer,INDICATOR_CALCULATIONS);
Here
SetIndexBuffer(1,Color_buff,INDICATOR_COLOR_INDEX);
cannot be added at the end, since it must have the index 1, otherwise this will not work.
Now, to identify the fractal, we need at least 3 candlesticks, therefore let us make appropriate amendments to the block related to the number of calculation bars.
if(prev_calculated==0)
      limit=2;
   else limit=prev_calculated-1;
Add a couple of lines in the main block
//--- calculate MACD
   for(i=limit;i<rates_total && !IsStopped();i++)
     {
      ExtMacdBuffer[i]=ExtFastMaBuffer[i]-ExtSlowMaBuffer[i];
      //--- calculate Color Macd
      if(ExtMacdBuffer[i]>ExtMacdBuffer[i-1])
         Color_buff[i]=0.0; // set color Green
      else
         Color_buff[i]=1.0; // set color Red
     }
//---
Finally, let us add a block in which the MACD extremum will be determined. To avoid redrawing, this will be done after current bar close. To do this, the calculation will be shifted by one bar.
for(i=limit;i<rates_total-1 && !IsStopped();i++)
     {
      if((ExtMacdBuffer[i-1]<0 && ExtMacdBuffer[i]>ExtMacdBuffer[i-1] && ExtMacdBuffer[i-1]<ExtMacdBuffer[i-2]) ||
         (ExtMacdBuffer[i-1]>0 && ExtMacdBuffer[i]<ExtMacdBuffer[i-1] && ExtMacdBuffer[i-1]>ExtMacdBuffer[i-2]))
         Color_buff[i-1]=2.0; // set color Gold
     }
This variant implies that when the MACD line is above zero, we identify only UP fractals; and when MACD is below zero, only DNs are detected. This is wrong. Further we will use the variant, in which the fractal type (UP or DN) does not depend on how the main indicator line is positioned relative to zero.
The automation of some of the moments in pattern existence is hard-to-impossible, and thus only visual observation can give a positive result.
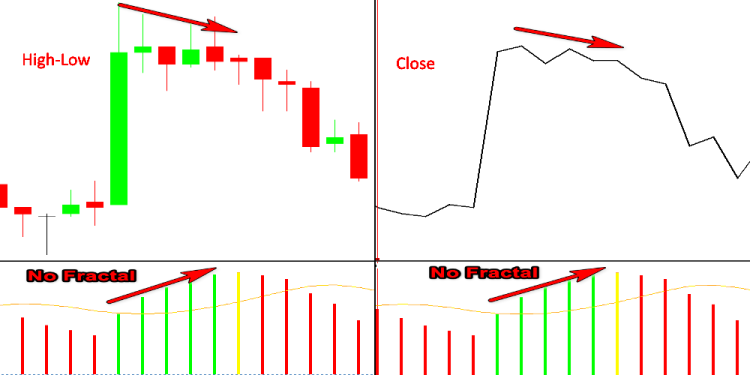
Fig. 10
An attempt to compensate for this shortcoming was performed in the Expert/Signal/SignalMACD class. The documentation contains the following:
- Divergence is when the first analyzed trough of the oscillator is shallower than the previous one, and the corresponding price trough is deeper than the previous one.
- Double divergence is when the oscillator formed three consequent troughs, each of which is shallower than the previous one; and the price formed three corresponding troughs, and each of them is deeper than the previous one.
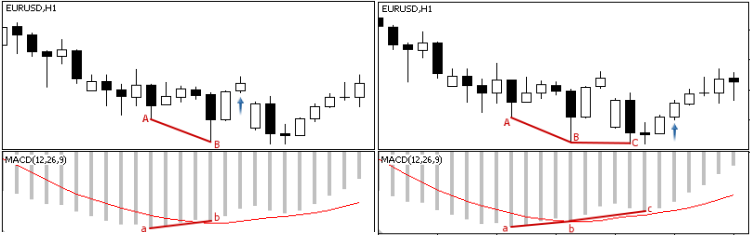
Fig. 11
Again, the description that "the first analyzed trough of the oscillator is shallower than the previous one, and the corresponding price trough is deeper than the previous one" brings us back to the chicken-or-egg question. What comes first, the price action or the indicator value? How can the indicator values which are formed based on the price values can be more important than the price series? Moreover, the description does not provide any specific information. How many bars should be used in calculation: three, five or the entire history? This method can be attributed to non-standard ones, but its implementation in the classic version has more disadvantages than advantages. However, one should not completely reject it. In some specific cases only this indicator is applicable.
As one of the automation variants, we can consider the simultaneous use of MACD+OsMA. The OsMA indicator has been improved similarly to MACD.
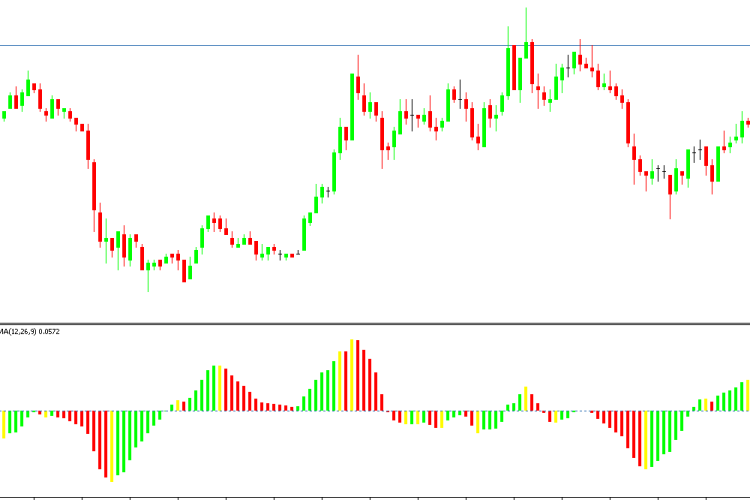
Fig. 12
As we know, OsMA is the same MACD, but it is displayed a histogram of difference between the signal and the main MACD line. OsMA is more sensitive than MACD, though it is not always enough and thus the indicator can miss signals. Sometimes however it is too sensitive and thus it needs an additional confirmation.
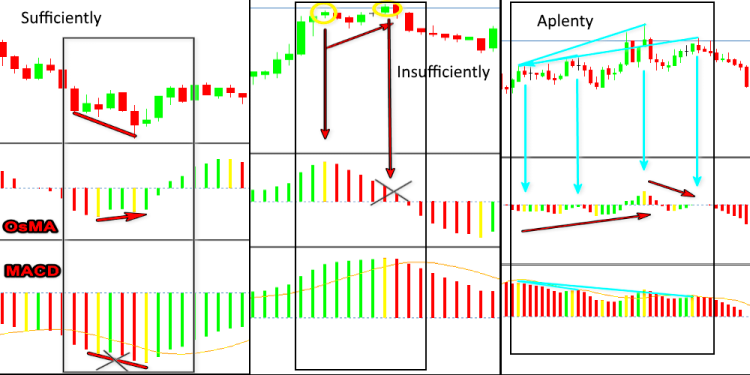
Fig. 13
When two indicators are used, one needs to determine which of them should be considered leading, which is a supplementary one, i.e. the divergence of which of the indicators should be considered mandatory, while the other one is optional.
Also, I think another disadvantage is connected with the ability to select indicator parameters. If the RSI calculation period only affects the line amplitude, in MACD, OsMA, Stochastic it changes the appearance. One may say that " market conditions are changing and this possibility is necessary, while the indicator is created for the stock market and its parameters were chosen for the one-hour period". But I would say that this possibility in not an adaptation, but it is related to the fitting.
Of course, a set of parameters for the specific symbol and chart period can be necessary at an initial state, but if the indicator later becomes inefficient, you'd better stop using it all together. But this is purely my personal opinion. The lack of the possibility of "overfitting" became one of the reason for using the AC (Accelerator/Decelerator) indicator in the first part of the material. This is not the only possible indicator. All indicators have their specific advantages. All the rules that were earlier described for AC are true for all other indicators. We analyzed the above in the context of classic divergence, but it is also applicable to the reverse/hidden divergence rules. As you can see, not all classical ideas are unambiguous. So, can this tool in its traditional form be used as a high-quality signal?
Before answering this question, let us have a look at other indicators, which are traditionally used for solving the above mentioned task.
Stochastic
Stoсhastiс Oscillator is a technical indicator that measures the price momentum as a percentage. "The term stochastic refers to the divergence between the current period close price in relation to its price range over a period of time." The indicator was created by George Lane in March 2007.
It consists of two lines:
- %K Period — fast Stochastic (solid line). The number of bars at which the low-high values should be searched.
- %D Period — slow Stochastic (dashed line). SMA period applied to %K.
- Slowing — this parameter is related to %K. It sets smoothing.
- %K=((CLOSEn-LOWn)/(HIGHn-LOWn))*100
where:
- CLOSEn — previous period close price:
- LOWn — the lowest price over the last n periods
- HIGHn — the highest price over the last n periods
- %D — moving average of %K. Different averaging methods can be used for the line: simple MA, exponential MA, smoothed or linear weighted averaging. It is also possible to change the price series High/Low or Close/Close.
The definition contains the word "divergence". If the idea is clear with MACD, it is a bit more difficult to understand with normalized oscillators. The very concept of "normalized oscillator" can be defined as the one that change its values in a rigid framework. In our case the framework is from 0 to 100. The feature sets specific conditions. Three zones are highlighted on the value scale. These are the overbought zone (80%), the oversold zone (20%) and the main movement. The calculation specifics create conditions under which the indicator line does not leave the extreme zones for a long time and does not enter them.
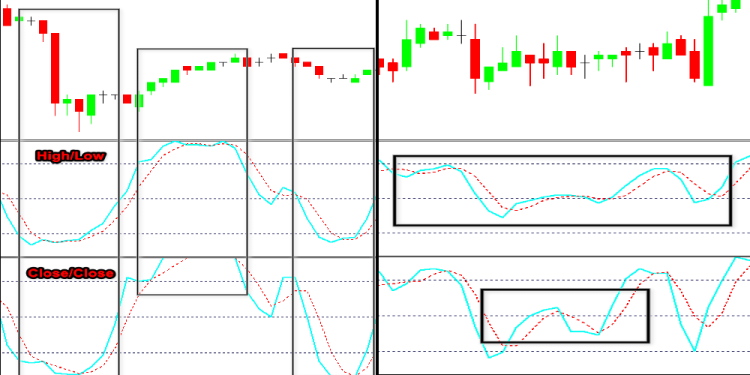
Fig. 14
It might seem that the ability to use two different price ranges solves the MACD question about which one to use. Another issue occurs here. It can be seen from figure 14, that the Close-based Stochastic takes the extreme positions "100 - 0" more often than the one based on High/Low. This is connected with the indicator calculation formula. We also observe a lot of peaks and troughs.
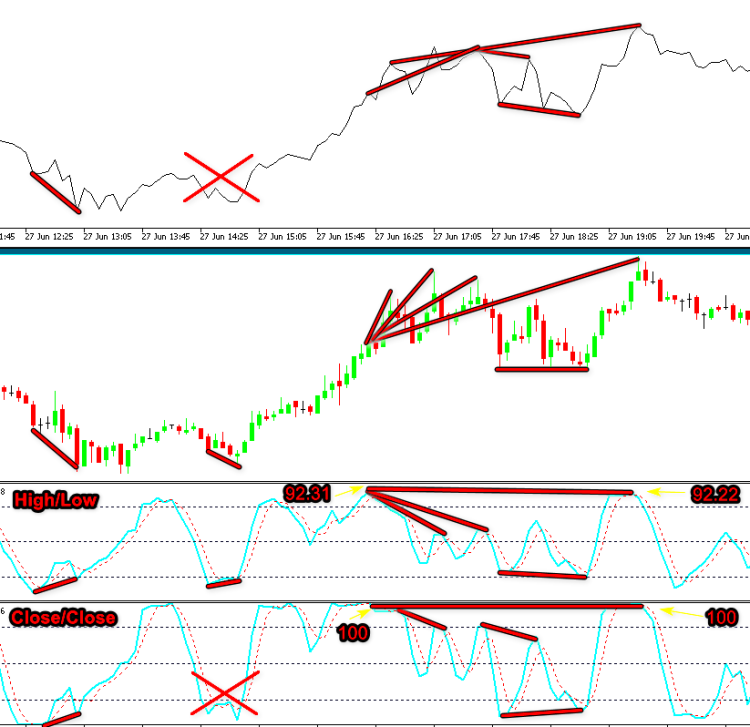
Fig. 15
There is no clear rule for these cases. As a result, divergences between points 100-100 and 92,31-92, 22, are hard to automate. In the typical version of the calculation, two nearest fractals are used. In our case these are anything but closest fractals. However, "there is an exception to every rule". Thus, we can turn the disadvantage into an advantage. By changing the settings according to the calculation period, we can reflect M15 chart changes on the M5 chart.
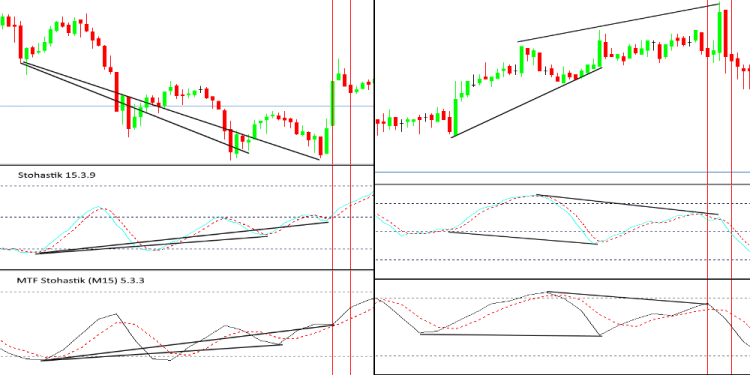
Fig. 16
The advantage of this option is that we can easily automate divergence detection in global (extended) market segments and receive an early entry signal without a delay, associated with the need to wait for the closing of the higher TF candlestick. These segments are shown in figures 16-17 using red lines. In some cases, this can be crucial.
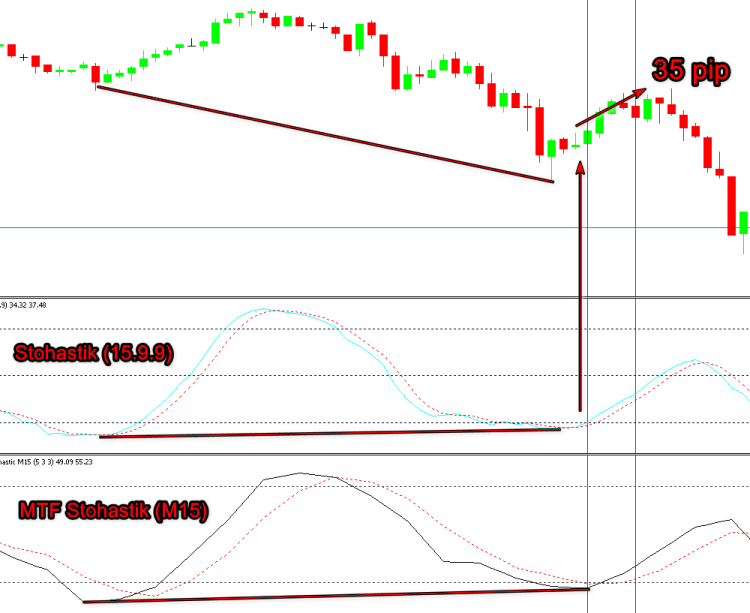
Fig. 17
From the above figure we can clearly see that if we entered based on MTF signals, our deal would have become losing, while the alternative enabled us to earn money. A similar approach is valid for MACD.
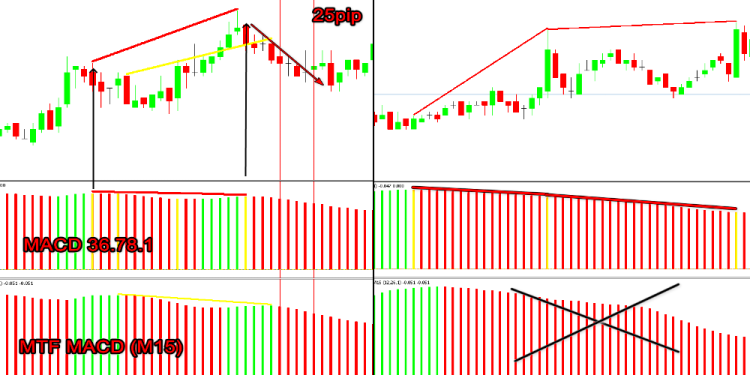
Fig. 18
Apart from an apparent reduction of the number of signals, this solution allows to significantly increase the probability of a profitable deal and thus increases the overall profitability. We have viewed an example of М5-М15. What if we use M5-H1?
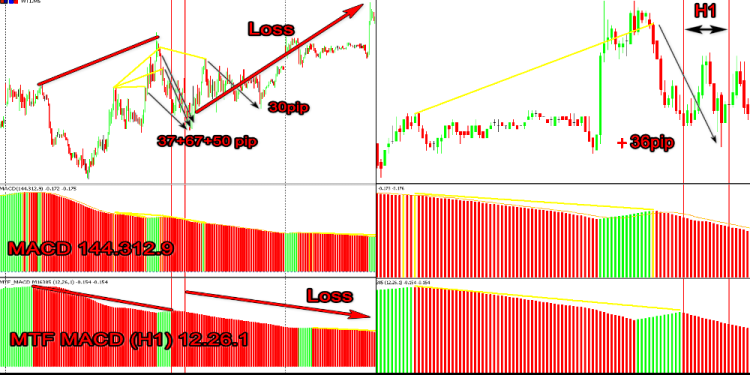
Fig. 19
The use of the fast and slow stochastic solves only part of the problems. When creating Expert Advisors based on such principles, we have the same issues, as when using fast and slow MACD (MACD + OsMA). How to prioritize? This does not solve the main problem of how to filter the abundance of Stochastic line breaks when creating the divergence indicator. We cannot afford checking every line break. This would create too much noise, and thus we are forced to limit this to two, rarely three, sequences.
We will get back to the signal filtering issue later. Now let us focus on the rules which should be observed when searching for divergences. Later an explanation will be provided why we do not set a clear NO.
1) Logically, we understand that before getting a divergence (convergence), the price must reach a critical value. Accordingly, the indicator line also needs to reach a critical level. In our case, the indicator must enter the overbought/oversold zone. Having a new High/Low reached by the market is an optional condition in this case. In our case, the second point (to the left) from the current bar must be located in this zone when searching for a classical divergence. For a hidden (reverse) divergence, on the contrary, the first point should be at a critical level.
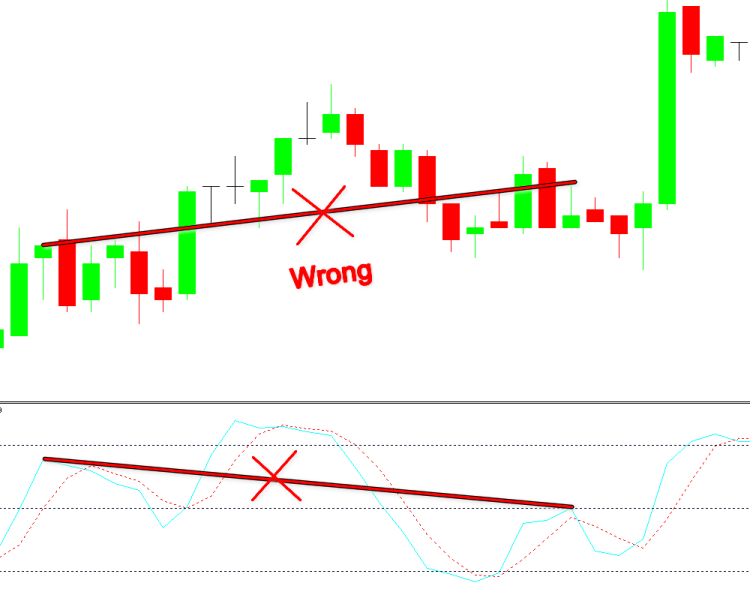
Fig. 20
2) When searching for a signal (manually or through an algorithm), search for it at the nearest extremes
using the sequences excluding cases from figure 20. The maximum number of such sequences is three.
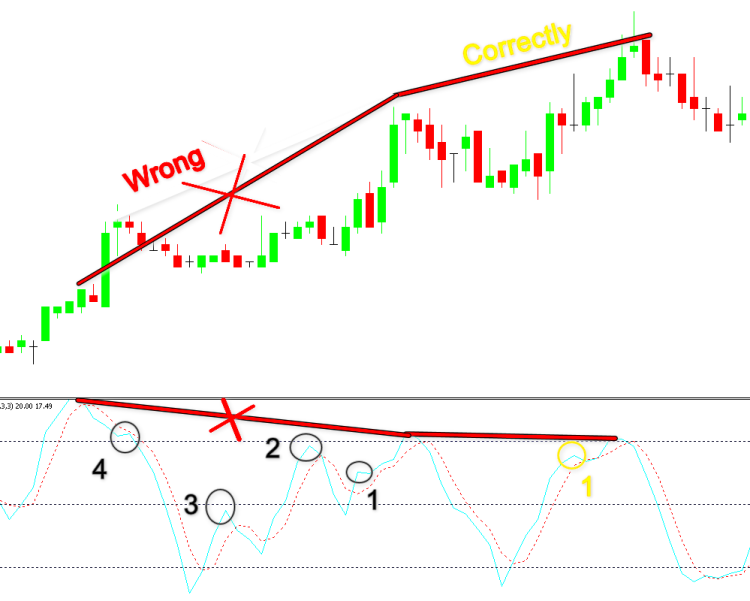
Fig. 21
Even though it seems that figure 15 corresponds to rule 1, in which the left pick is in the overbought zone, the presence of more than three indicator points cancels the signal.
RSI
It is another indicator which can be used within our research. As you might have noticed, the task becomes more difficult with every step.
RSI (Relative Strength Index) is the indicator introduced by J. Welles Wilder in June 1978.
RSI=100-100/(1+U/D)
where:
- U is the average price change value in the positive range (CLOSEn>CLOSEn-1 )
- D is the average price change value in the negative range (CLOSEn<CLOSEn-1 )
- RSI=(SMMAn)ofU(SMMAn)ofD
- n - SMMA calculation period.
It is also normalized in the range of 0-100. But unlike Stochastic, it does not contain line smoothing options. This complicates the analysis. The excessive sensitivity produces a lot of line breaks. As can be seen in the below figure that the indicator maintains a direct linear movement only in sequential unidirectional price movement. In other cases, it is a saw-like line.
Fig. 22
As a result, the need to filter indicator values is even more crucial in this case. Now let us view one of the problem solution options.
We have already mentioned the question about which of the two is primary: the price series or the indicator values. In this case we must find an answer. There are not many tools which can help in analyzing price behavior. These include different types of MAs, Fractals and ZigZag.
Fractals (by Bill Williams)
The standard variant incorporates a five-fractal variant. However, this fractal does not solve the filtering problem. On the contrary, sometimes it adds more noise due to signal discrepancies with the main indicator.
Fig. 23
Similar to RSI, it gives a lot of signals in flat areas, which need to be filtered. Another drawback is the delay in the formation of a structure of five bars. The delay is equal to at least one candlestick, which is completely undesirable.
MA is an excellent smoothing instrument. But it has a lot of variations. MAs differ in smoothing options: SMA (simple averaging), EMA (exponential averaging), SMMA (smoothed averaging), LWMA (linear weighted averaging); in the used price: Close, Open, High, low, Median ((high+low)/2), Typical ((high+low+close)/3), Weighted ((high+low+close+close)/4); and in the calculation period, which can vary from 1 to ∞. This concerns the classical MA (Moving Average). In addition, there is a Double Exponential Moving Average. Even more types exist outside the standard MetaTrader 5 package. We do not set the task of "analyzing all possible options for all divergence search algorithms in order to find an optimal version".
ZigZag is an "indicator for determining extreme prices in price fluctuations, with an amplitude and period set in accordance with the filter deviation".
Based on the definition this is what we need. The same issue occurs here. RSI is based on Close, while ZigZag uses High/Low.
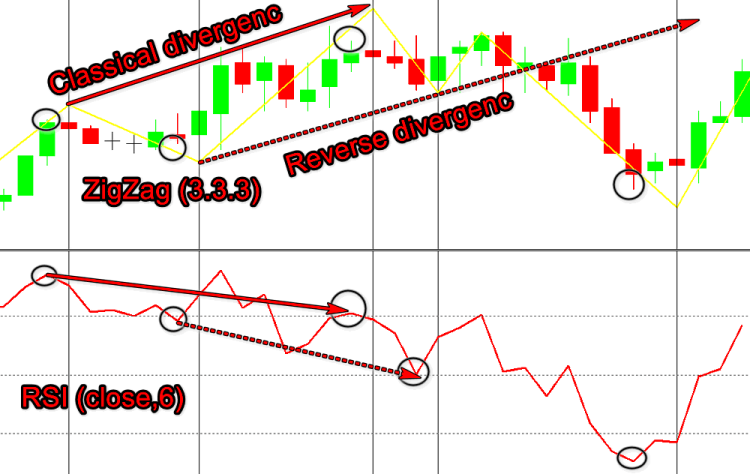
Fig. 24
This disadvantages can be partially overcome by creating an RSI based on the Median price ((high+low)/2).
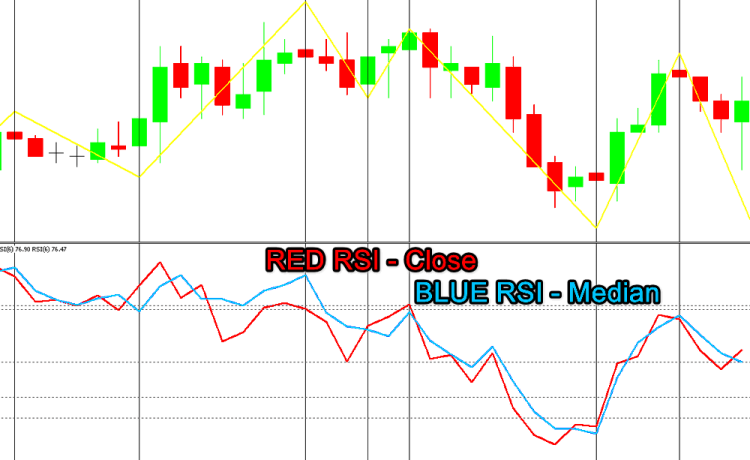
Fig. 25
As can be seen from figure 24, the deviation in the position of indicator fractals and price fractals does not exceed two bars and thus it can be easily compensated by software means. Please note that in our case we are interested only in the form of the signal and not in its values. That is, the basic indicator is used only to detect divergence and is not used for individual trading signals.
Therefore, we can "play" with the settings for our divergence specific use. Knowing that the RSI calculation period does not affect the signal form and only affects the amplitude, while ZigZag settings do not change the position of extremums, we can achieve a striking result.
According to the rule applied to Stochastic: "prior to the formation of the divergence pattern, the indicator values must reach critical overbought/oversold values". In our case these are zones below 30 and above 70. Here, by changing ZZ parameters we can obtain both short-term signals and their global values. These parameters can compensate for each other, and thus the combination of 2+1 (two filters + one basic) allow tracking the whole picture. The number of filters is not limited to two and can be equal to three or more. Further, when we consider target levels, we will see that by breaking signals into groups, we will be able to catch most of the market movement by trading specific signals.
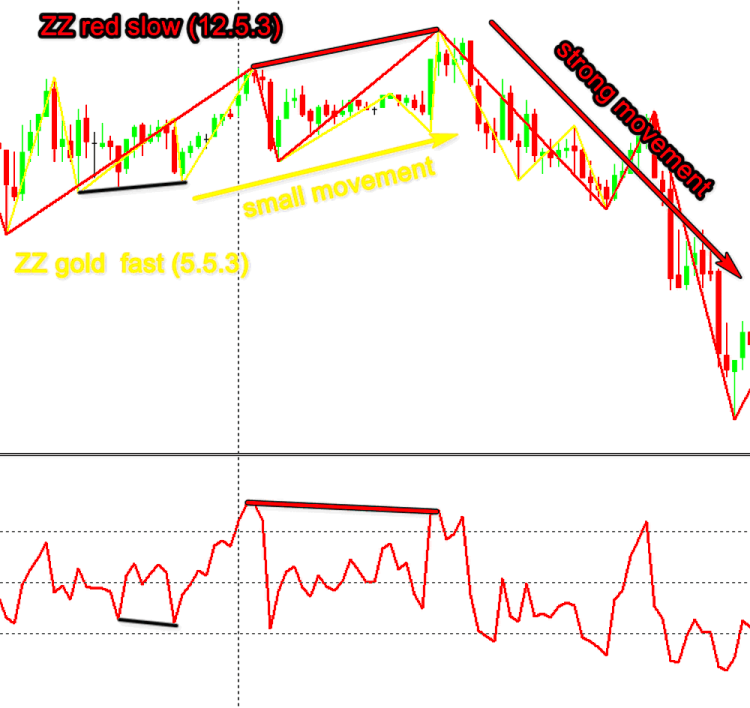
Fig. 26
In figure 26, RSI in the first signal did not enter the oversold zone. We can simple change the calculation period and thereby increase the amplitude — in this case the RSI will appear in the appropriate zone.
CCI
Commodity Channel Index belongs to the oscillator type. It was developed in 1980 by Donald Lambert.
CCIn=(1/0.015)*((TypicalPrice-SMA)/MedianDeviation)
One of the advantages of this indicator is its momentum character. Thus, it allows determining not only the overbought/oversold market state, but also the initial market momentum. In our case, this advantage can be considered a disadvantage. Despite the fact that its classical version is calculated using to Typical Price, it still has a sawtooth line shape, similar to that of RSI. So RSI application specifics also apply to this CCI. The price series needs to be filtered not only by type (High, Low, Close, etc.) but also by price extremum detection.
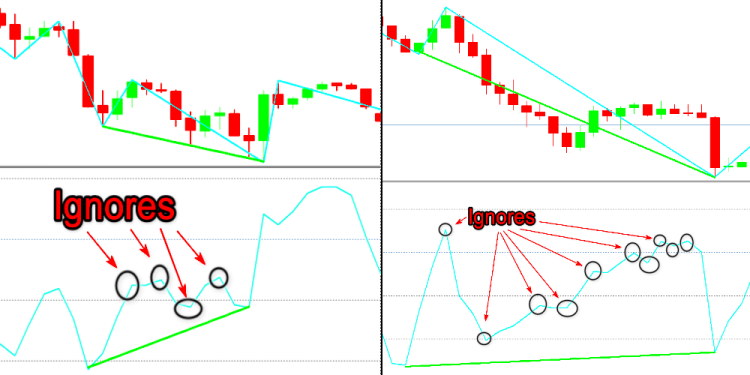
Fig. 27
Due to this behavior, we need to change the algorithm in case of using multiple line breaks when searching for divergences.
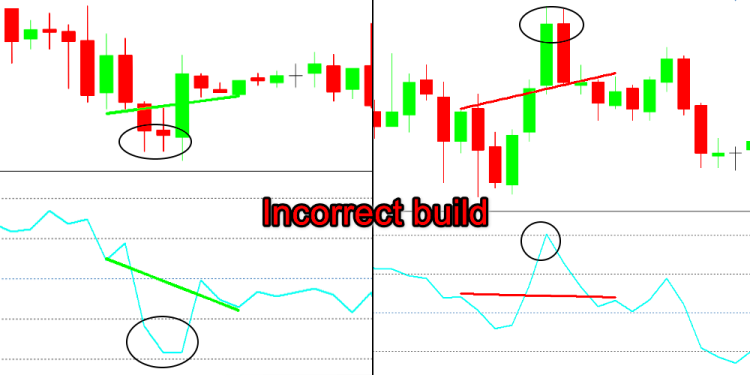
Fig. 28
A similar situation rarely occurs with other indicators, but with CCI it is quite often.
Due to the specific behavior, the indicator is considered one of the best tools for operations based on the principle described in the first article. The principle is as follows: "Lines extended from the last reverse divergences (last Bullish and Bearish) and drawn on the price chart, serve as the price support/resistance lines (Fig. 29) or support/resistance for the indicator line in case of classical indicators which are drawn in an oscillator window (Fig. 30)”.
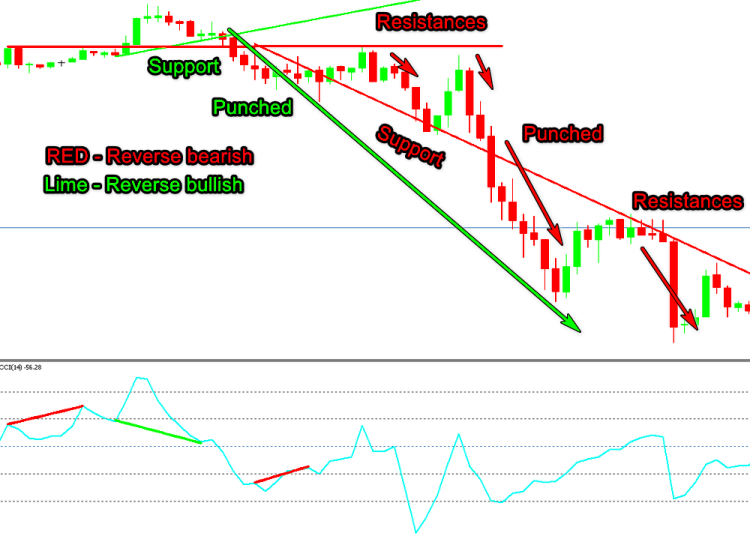
Fig. 29
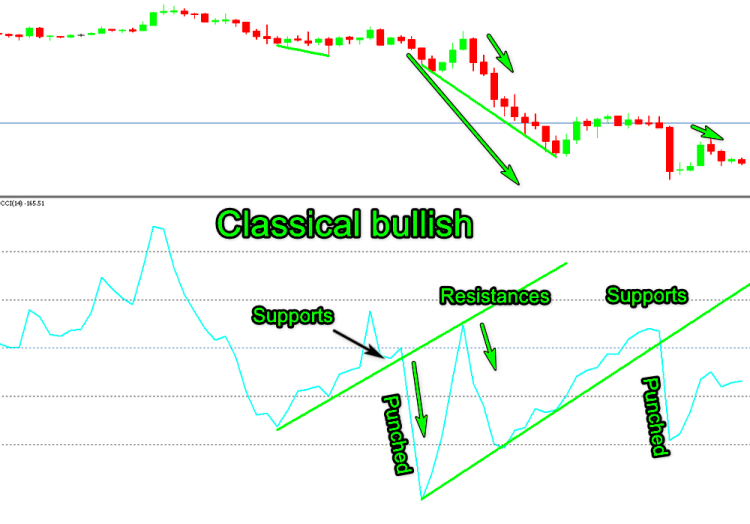
Fig. 30
Momentum
Momentum reflects the price rate of change. Another name for the indicator is RoC (Rate of Change). The difference between them is the following: the balance line in RoC is 0, while that in Momentum is 100. The indicator was described by John Murphy in his book "Technical Analysis of Futures Markets".
Momentum=Pn-Pn-1
where Momentum is the momentum over n periods as at the time t (current period)
This variant is not very convenient, as it provides data from the asset price. Therefore, the formula was supplemented.
- Pt — current price
- Pt-n — price n periods ago
- RoCtn=(Momentum/Pt-n)*100
The standard Momentum is actually RoC, while RoC is common Momentum-100. The indicator calculation principle consists in the assessment of momentum movements. Therefore, it has the same issues, as CCI and RSI: a sawtooth line. Here this movement produces even more signals.
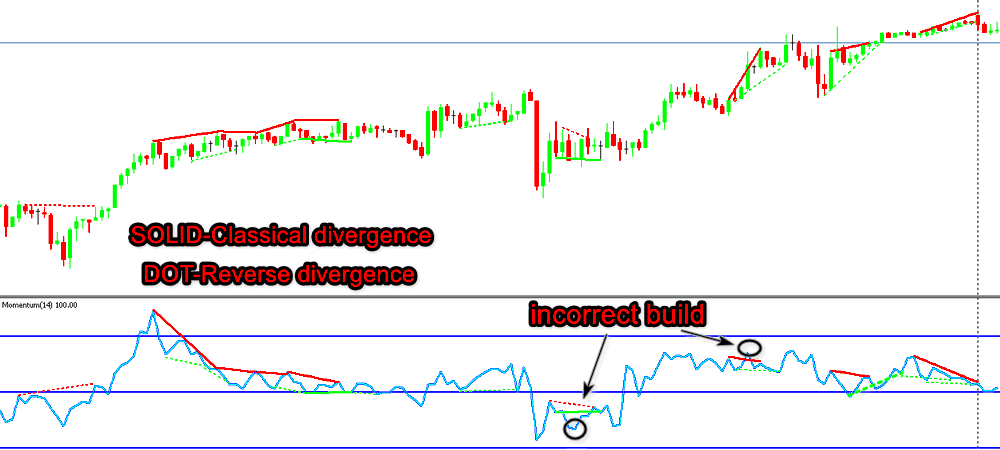
Fig. 31
It is not clear what to do with such an abundance of signals. Also the automated version can work incorrectly, which is shown in figure 31. According to the available information concerning this indicator, it was not used in relation to the identification of divergence. There is an opinion that depending on the calculation period it can meet the requirements of short-term trading (period 6-14), while with a period above 20 it serves as a trend indicator, using which the trend end can be clearly identified. If we assume that the idea that a trend consists of three consecutive momentums is true (Wave Market Theory), then the Momentum principles can really help in identifying the trend end. Perhaps a more global analysis of the indicator operation is needed.
ADX
The idea of Directional Movement Index (DMI) was proposed by Wells Wilder in 1978, in his book "New Concepts in Technical Trading Systems". This was the idea behind the development of this instrument.
ADX is calculated based on two other indexes with a positive direction (+DI) and a negative direction (− DI), taking into account the Average True Range (ATR).
ADX=(MAn(+DI--DI)/(+DI+-DI))*100
where:
- +DI — positive direction index
- -DI — negative direction index
- MA — SMA (moving average)
- n — MA calculation period
The formula is presented in a simplified form. A detail description is available here.
The indicator has a lot of lines, while the main ADX line does not indicate the trend direction. Therefore, it may seem that the indicator is not suitable for us.
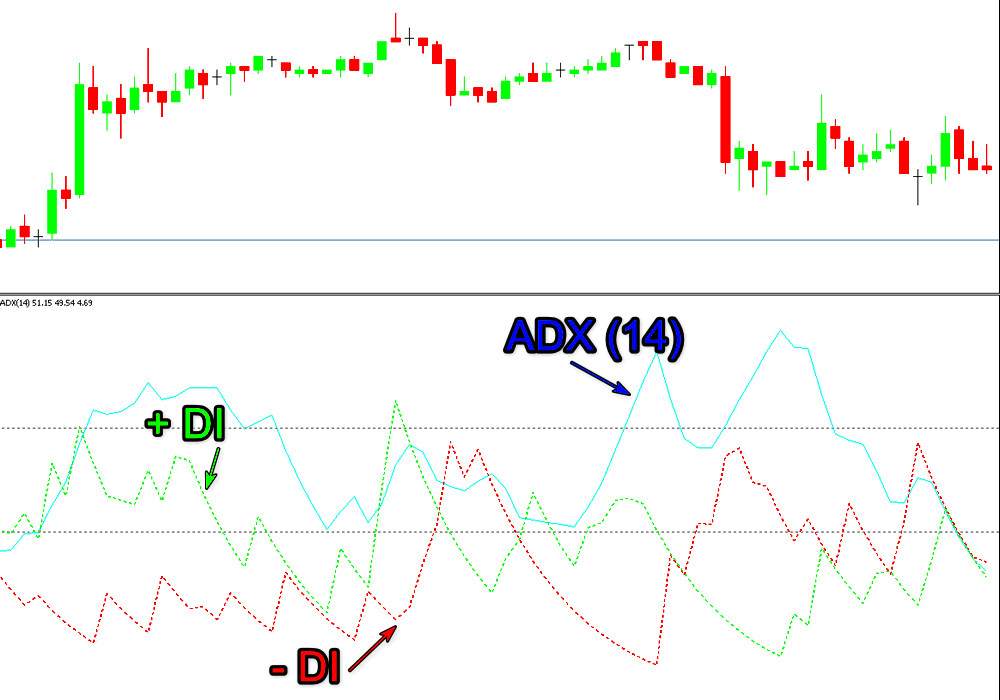
Fig. 32
This is a wrong assumption. The indicator can be used in several ways. The first one: defining the divergence between the price direction and the market activity. Thus, if the price continues to decline while ADX declines, this indicates a divergence.
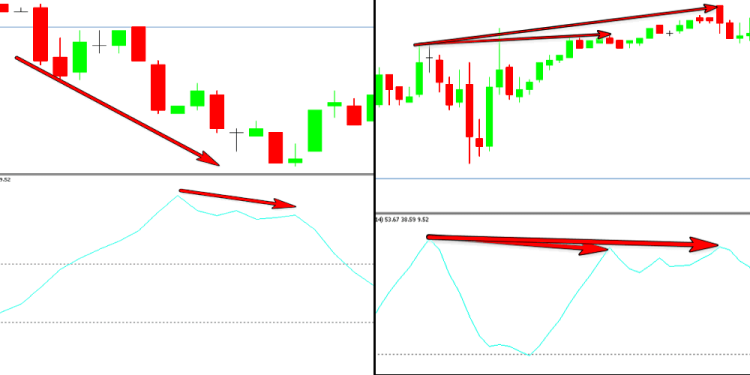
Fig. 33
This method could be added to our collection. The complexity of this method is connected with direction determining. One of the solutions implies initial evaluation of the price series movement. I.e. we analyze the sequence of descending troughs or of rising peaks. An issue may occur if the nearest peak is below the previous one while the nearest trough is above the previous one or vice versa, i.e. the so called Internal and External bars (terms related to Price Action).
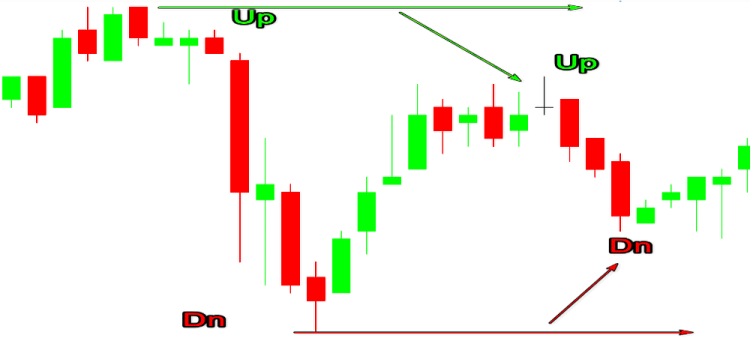
Fig. 34
The second way is to use the +DI and -DI lines. Do not forget that –DI peak always corresponds to a trough in price chart. In an uptrend (+DI is above -DI), we use the +DI line to examine peaks to find classic bearish divergences, or -DI peaks in order to find hidden bullish divergences. In a downtrend (+DI is below -DI) analyze -DI peaks to find bullish classic divergences and +DI peaks to find bearish hidden divergences.
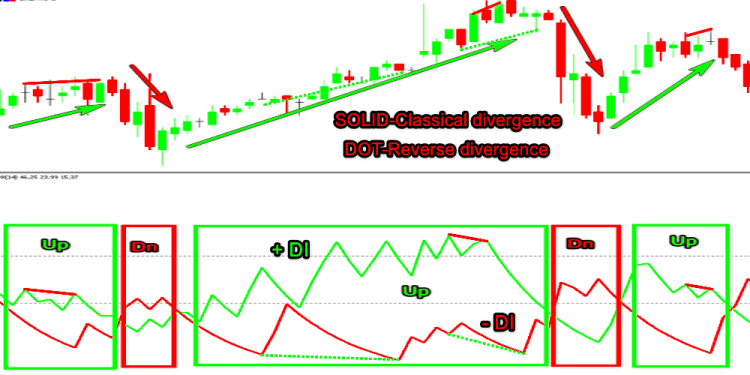
Fig. 35
The third method, which in my opinion is the most effective one, is to apply both methods mentioned above. This option solves a lot of problems. It allows finding divergence on the ADX line without a delay connected with waiting for a reversal. Signals should be filtered by type depending on the general trend without using additional instruments.
Here I would like to finish the part concerning classic oscillators. Why haven't we considered AO, AC, TRIX, WPR and other similar indicators?
Indicators with original calculation formula were selected for analysis.
WPR(10) is the same Stochastic(10.1.1 (Low/High)) with an inverted scale. Stochastic works in a range 0-100, while the WPR's range is 100-0.
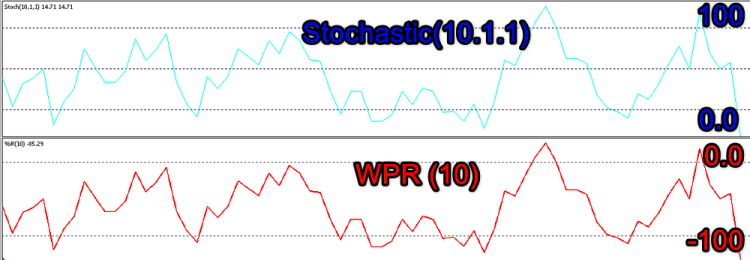
Fig. 36
Awesome Oscillator (AO) is similar to MACD(5.35.1 Median). The only difference is that AO is smoothed using SMA (simple averaging), while EMA (exponential averaging) is used in MACD, which is thus a bit faster. As can be seen from the below figure, this does not provide significant changes in the signal form.
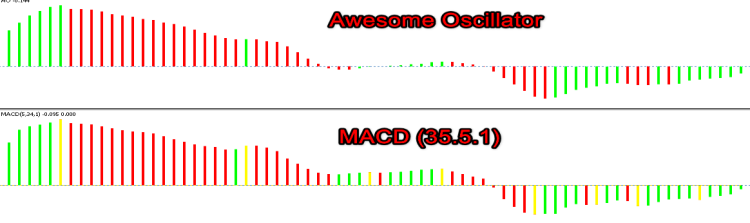
Fig. 37
Accelerator is similar to OsMA (5.34.5 Median) with the same difference as with MACD and AO.
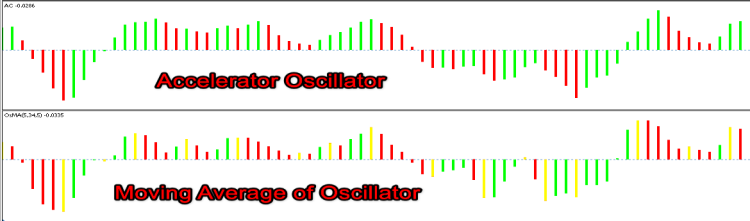
Fig. 38
TRIX is based on Moving Averages and the same result can be achieved by selecting MACD parameters.
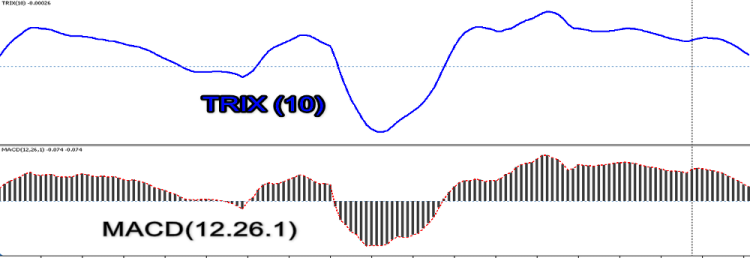
Fig. 39
Volumes
There is a huge variety of strategies using technical analysis. A separate group contains strategies using volumes. It is a small group. In my opinion volumes in the Forex market are not used as much as they sould be. Even though there are no real volumes in the Forex market (only tick volumes). There will be a separate material concerning volumes. Now let us consider them in the context of divergence.
There are very few indicators that use volume in their algorithm and are available in the MetaTrader 5 terminal standard package. These include Accumulation/Distribution (Mark Chaikin), Money Flow Index (it can be called Volume RSI because the formulas are similar), On Balance Volume (Joseph Granville), Market Facilitation Index (Bill Williams) and Volume. Forex Index by Alexander Elder also belongs to this group, although it is included in the Oscillators section. There are very few instruments of this type, therefore we often come across the following picture when analyzing volume divergences:
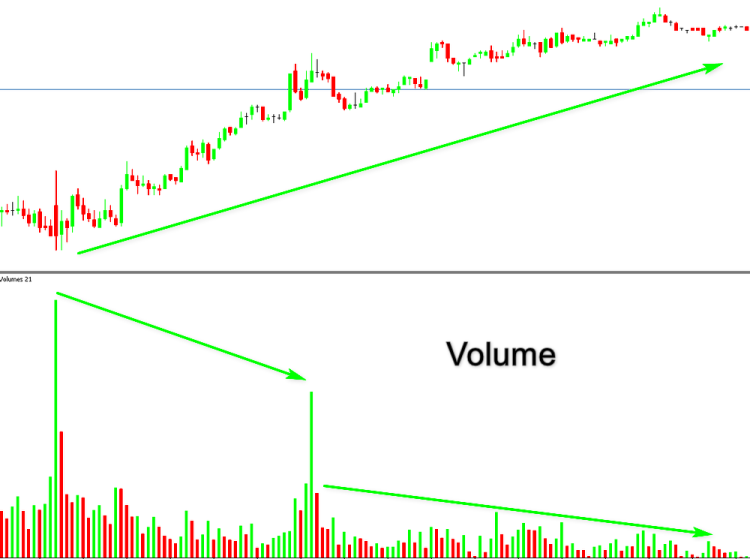
Fig. 40
As can be seen from the above figure, this method works well when analyzing the market using historical data, but creation of automated tools is difficult. This method has a lot of disadvantages. This includes the difference in volumes traded during different sessions and related distortions. We know that Asian session volumes are less than those during the European and American sessions. Spikes occur at the trend beginning as well as when traders close their deals. Volume in the latter case can be even greater.
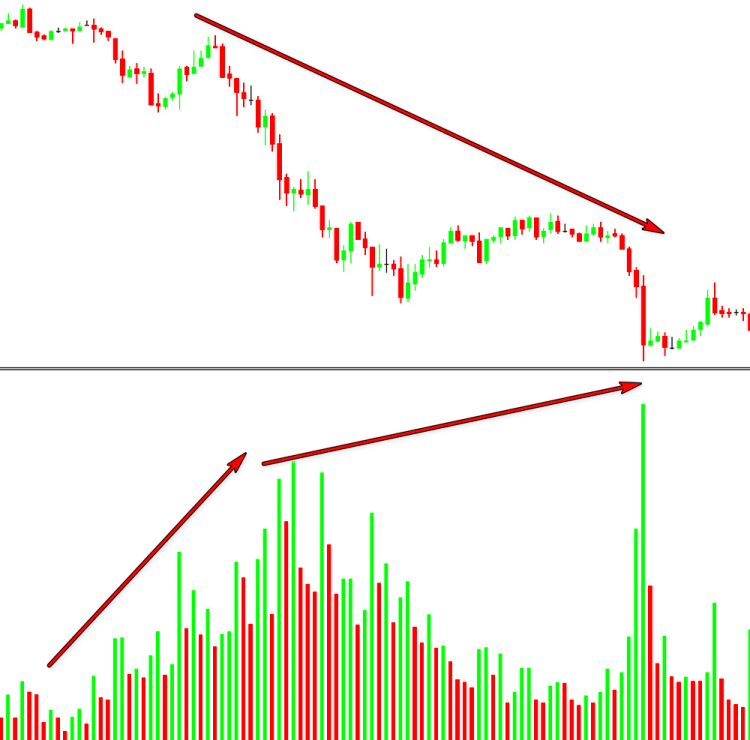
Fig. 41
Volume spikes can accompany news releases.
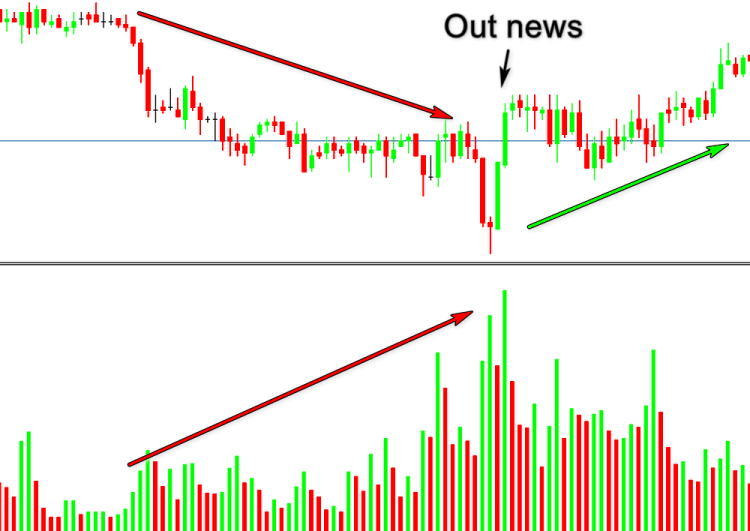
Fig. 42
This task can be partially solved by using any other indicator with a balance line instead of Volumes. This can be SMA of volumes over a certain period. This allows you to filter out minor values. One of such indicators is BetterVolume.
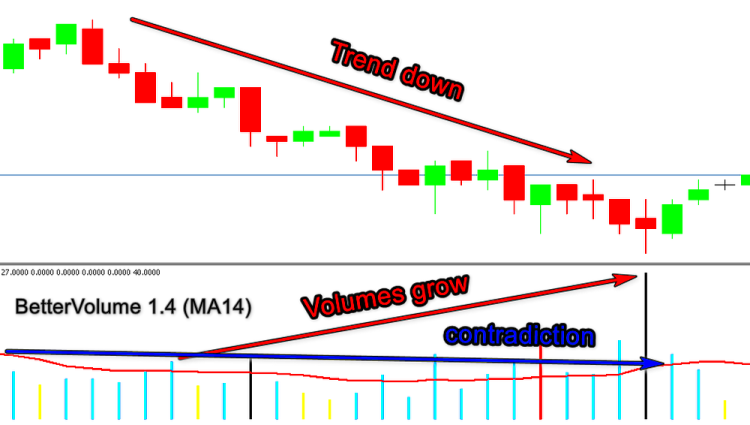
Fig. 43
Another way to solve the problem is to combine the price range and the Volume indicator. Let us define the volume on candlesticks which formed a new High (Low) and compare the volumes. Let us edit the classical variant in accordance with our algorithm.
The histogram will have five colors instead of two.
#property indicator_type1   DRAW_COLOR_HISTOGRAM
#property indicator_color1  Green,Red,Blue,Magenta,Gray
- Green - of low[i]>low[i-1] and high[i]>high[i-1].
- Red - if low[i]<low[i-1] and high[i]<high[i-1].
- Blue - an outside up bar
- Magenta - an outside dn bar
- Gray - nothing of the above
The main calculation block does not differ from the standard Volumes indicator. Additionally, the CalculateVolume function contains coloring of histogram bars
void CalculateVolume(const int nPosition,
                     const int nRatesCount,
                     const long &SrcBuffer[],
                     const double &h[],
                     const double &l[],
                     const double &o[],
                     const double &c[])
  {
   ExtVolumesBuffer[0]=(double)SrcBuffer[0];
   ExtColorsBuffer[0]=0.0;
//---
   for(int i=nPosition;i<nRatesCount && !IsStopped();i++)
     {
      //--- calculate indicator color
      ExtVolumesBuffer[i]=(double)SrcBuffer[i];
      ExtColorsBuffer[i]=4.0;
      //--- uptrend, UP bar ----
      if(h[i]>h[i-1] && l[i]>l[i-1]&& o[i]<c[i])ExtColorsBuffer[i]=0.0;
      //--- uptrend, DN bar ----
      if(h[i]>h[i-1] && l[i]>l[i-1]&& o[i]>c[i])ExtColorsBuffer[i]=3.0;
      //--- downtrend, DN bar ----
      if(h[i]<h[i-1] && l[i]<l[i-1]&& o[i]>c[i])ExtColorsBuffer[i]=1.0;
      //--- downtrend, UP bar ----
      if(h[i]<h[i-1] && l[i]<l[i-1]&& o[i]<c[i])ExtColorsBuffer[i]=2.0;
      //--- outside UP bar ----
      if(h[i]>h[i-1] && l[i]<l[i-1] && o[i]<c[i])ExtColorsBuffer[i]=2.0;
      //--- outside DN bar ----
      if(h[i]>h[i-1] && l[i]<l[i-1] && o[i]>c[i])ExtColorsBuffer[i]=3.0;
      //--- inside bar ----
      if(h[i]<h[i-1] && l[i]>l[i-1])ExtColorsBuffer[i]=4.0;
     }
//---
  }
//+------------------------------------------------------------------+
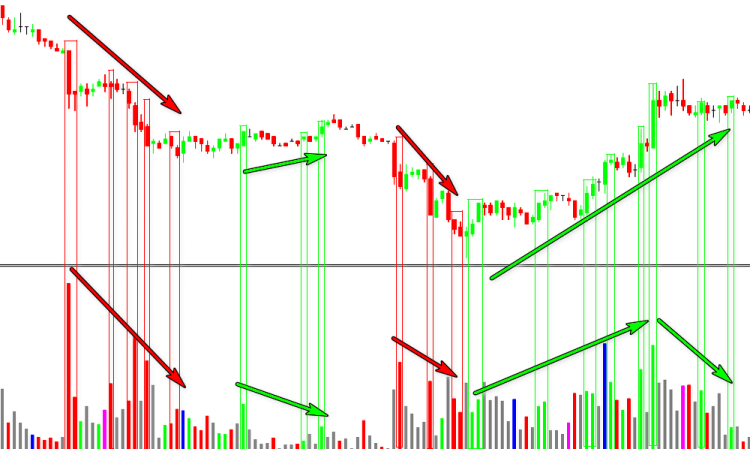
Fig. 44
This variant simplifies analysis, though it is not perfect. A few more options can be offered, up to the global change of the calculation principle. But don't forget that sometimes the old ways are the best ways. If earlier ideas have not become widespread, then we will not consider them. And doubt anything can help us in automating divergence detection using this indicator. Let us focus on popular ideas instead.
As already mentioned earlier, the calculation formula is similar to RSI.
Price=(high+low+close)/3
MF=Price*Volume
MR=positiveMF/negativeMF
MFI=100-100/(1+MR)
In my opinion, it is more suitable for identifying overbought/oversold zones, than RSI, because the very idea of oversold/overbought state does not mean the size of price change over the calculation period, but the number of players who participated in this process. This is exactly what MFI does. As a result, it reflects a causal relationship better. However, it also has the same disadvantages.
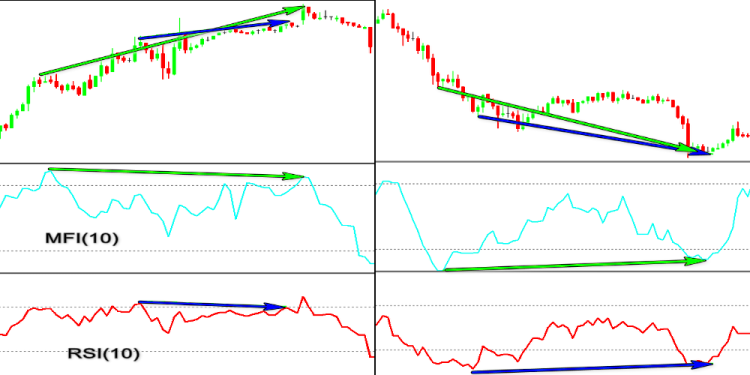
Fig. 45
(Joseph Granville)
If the current close price is higher than the previous one:
OBVn=OBVn-1-Volumen
If the current close price is lower than the previous one:
OBVn=OBVn-1-Volumen
If the current close price is equal to the previous one:
OBVn=OBVn-1
Where:
- OBVn — On Balance Volume indicator value in the current period;
- OBVn-1 — On Balance Volume indicator value in the previous period;
- Volumen — current bar volume.
References provide very little information about this indicator. However, they provide the key idea: OBV changes precede price changes. Thus, we can use the divergence between the price movement and the volumes.
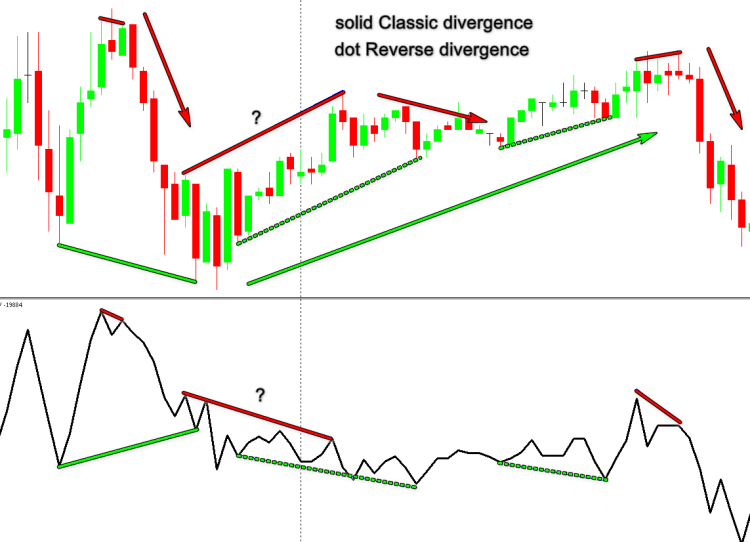
Fig. 46
One of the divergences in the above figure is marked with a question mark. The market movement was insignificant and the main factor is the transition to a new day, while no significant volatility can be expected in the Asian market. Later, target levels will show that this volatility was effective.
(Alexander Elder).
Force Index=Volume*(CLOSEn-CLOSEn-1)
The formula of the original is different from that implemented in the terminal.
Force Index=Volume*(MAn-MAn-1)
The underlying reason is not quite clear to me, but it does not provide a significant change in the signal shape, which is quite acceptable for our purposes.
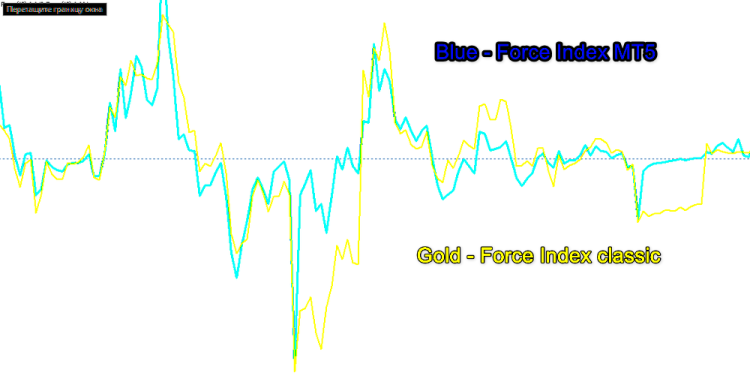
Fig. 47
Aspects of other signals generated by this indicator and their differences are beyond the scope of this article.
As already mentioned, this indicator was assigned to the class of oscillators, although Alexander Elder writes in his book: "I consider it the best instrument for measuring volume in the markets".
In addition, Elder uses this tool to search for divergences.
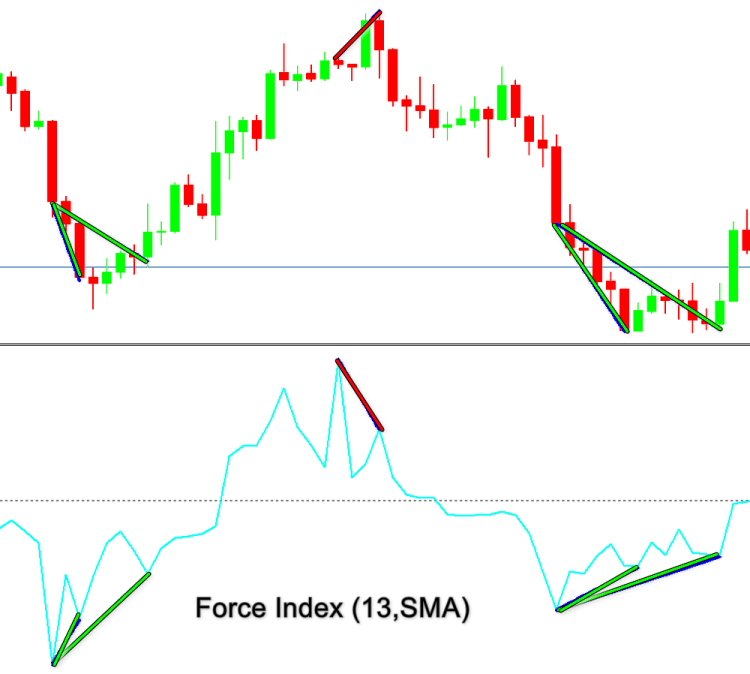
Fig. 48
Entry and Targets
The classic entry rule is as follows:
After the discrepancy has been identified, place a Buy Stop order at the high of the candlestick, which was the last one in pattern formation for the Bullish divergence; set a Sell Stop order at the low of the last candlestick for the Bearish divergence.
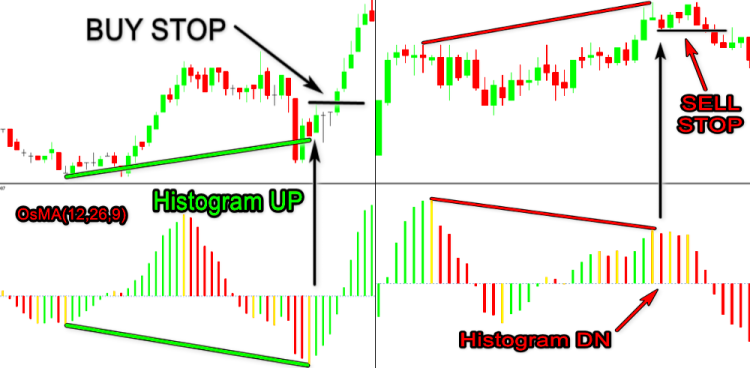
Fig. 49
This option can be considered optimal in terms of the taking the maximum possible profit. Within this method, a deal can be entered at the upper border of "Envelopes (26)" (the deviation is selected in accordance with market volatility).
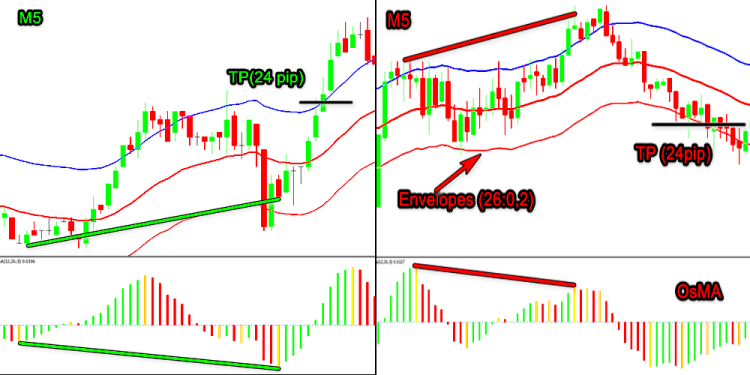
Fig. 50
Optionally, enter at the border of an equidistant channel built based on divergence forming points, in which the third point is the High (Low) between the first and the second points.
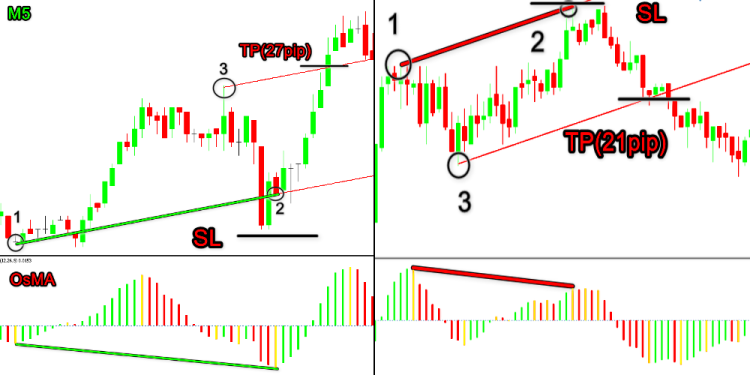
Fig. 51
Stop Loss is set below the Low for Buy or above the High for Sell. However, this "ideal" approach is suitable only for an ideal pattern, which meets all rules and additional confirmation requirements. It is also suitable for large timeframes, in which it is possible to additionally analyze the market state and exit on good time.
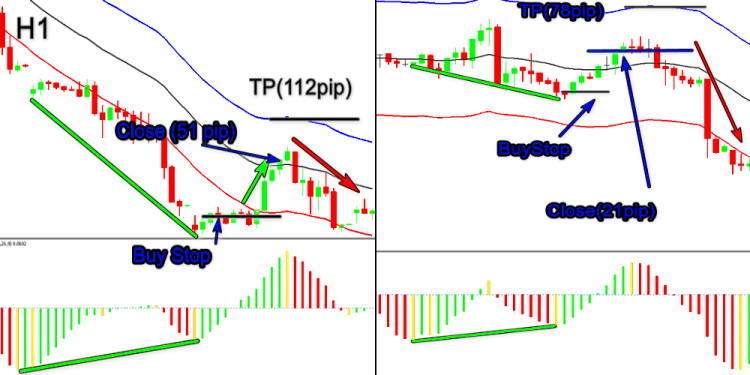
Fig. 52
This floating Take Profit is hard to determine before the deal opening. The level can change over time. One of the shortcomings: it is very difficult to calculate the possible outcome of the deal. In such cases, a more reliable variant can be used. Let us create a trendline. The deal will be entered after the trendline breakout, which serves as a trend change signal and an additional confirmation. In most cases it will be almost equal to the classic variant level but will provide more confidence.
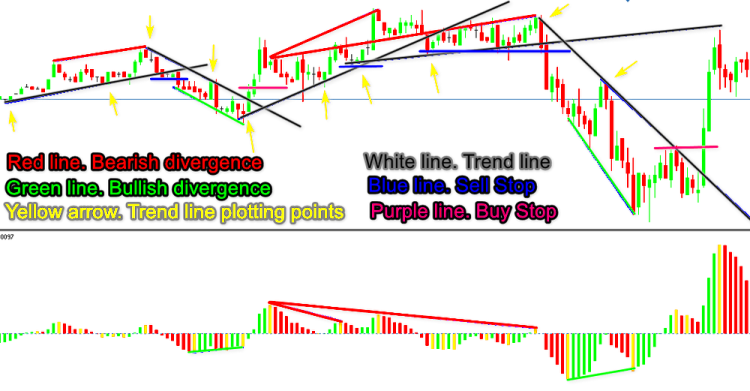
Fig. 53
We can use the rules from the first part with a proper drawing of lines. Sometimes lines created by an indicator need adjustment.
In such deals, the targets are set at support/resistance levels.
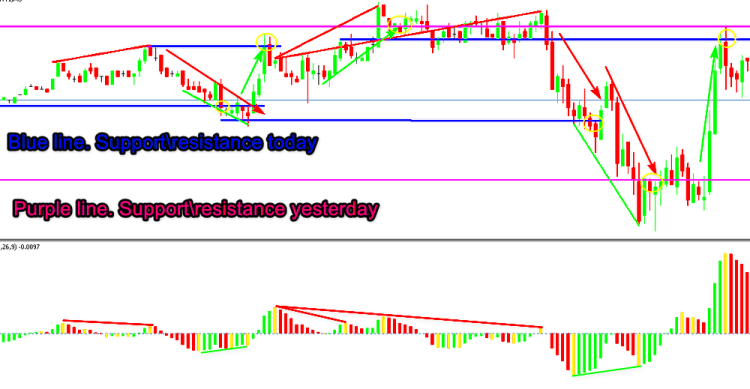
Fig. 54
As for double and triple divergences, their target can be set at the end of the first signal formation (often the case). More rarely it is possible to use a fractal between first divergence formation points or at its beginning.
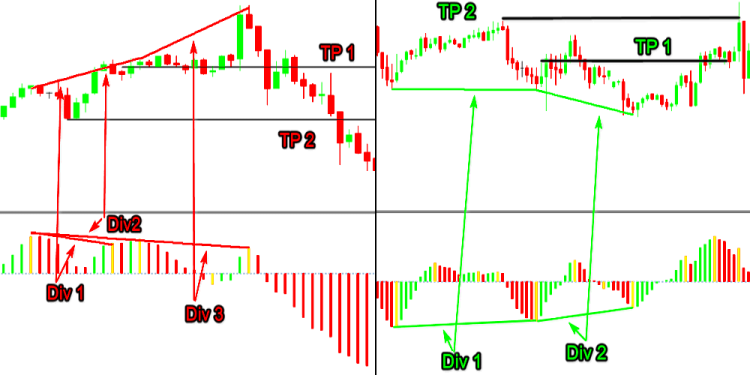
Fig. 55
Is it always necessary to set stop levels? Of course, everyone chooses their own trading style and money management rules. Trading without stop-levels at all or with the ones set very far away can be recommended only for highly experienced traders. Such a trader must be confident in related technical analysis and indicators and be able to adjust his actions on the fly, such as to modify a deal or close a losing deal manually until it gets out of control.
Creating a Trading Tool
Our purpose is not to criticize existing rules. We need to re-analyze available information and make applicable conclusions. Every author creating a trading tool is aiming to achieve a certain desired result. The indicator is usually created for a specific market. Sometimes its underlying idea is not very clear. Often, only the author understands the details of signal interpretation.
Traders may try to apply this indicator under other conditions and thus lose the general idea and the potential profits. That is why often traders meet stably losing trading robots. What if we change trade direction? Will this turn into a stable profit?
Our goal is similar: What if. Some of the results related to this approach were published in the first part. Now we will need to implement it in a different aspect. Let us use the tool which has its disadvantages but still provides a good result under certain conditions, and this result cannot be achieved by other tools. This is the ADX indicator. We all know its disadvantages. It is lagging due to double smoothing. The direction of its main line, as well as its other lines, does not coincide with the market movement direction. Due to this, difficulties arise when interpreting the indicator. The author wanted to show the strength but not the direction.
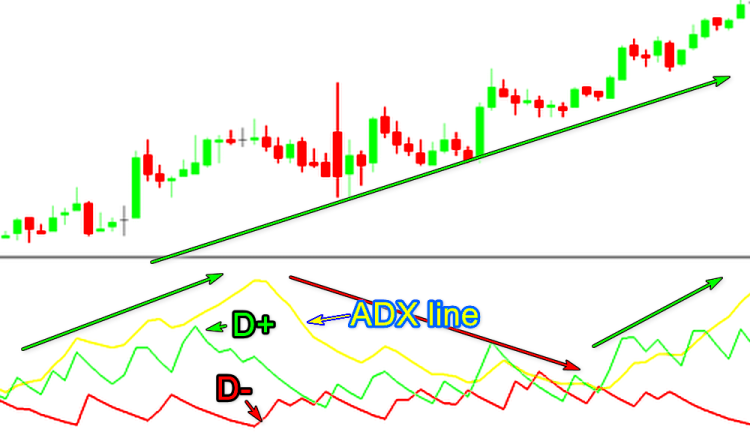
Fig. 56
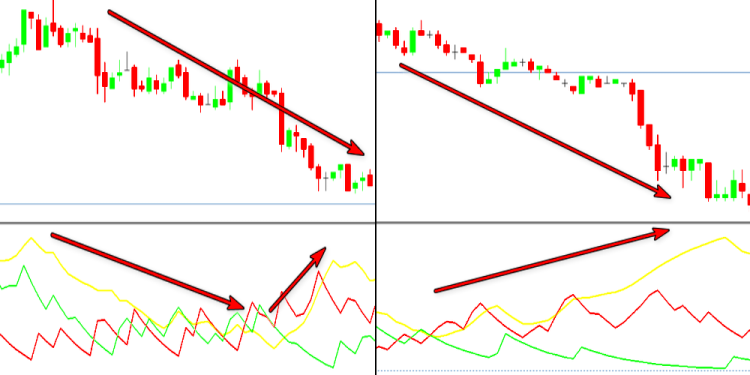
Fig. 57
Due to this, the DI+ seems to be all right, while DI- is turned upside down. Here the line peaks coincide with price troughs.
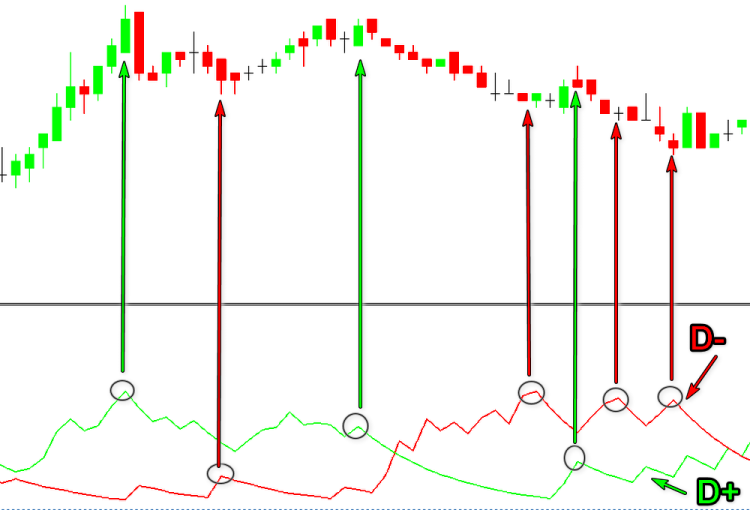
Fig. 58
I do not know the reasons for J. Wells Wilder to create such an indicator within the framework of the Parabolic System. I can suppose that it was created for the stock market, in which trading differs from the Forex market. Stocks are often bought for a longer period to receive dividends or for capitalization purposes.
Let us work with this specific feature. We need to use its best sides and use them as efficiently as possible. Its best advantage is that it can detect peaks and troughs in accordance with the market trend (market strength) through the separation to the positive and negative components. This solution also allows you to understand what is happening on the market. Whether it is buyers' pressure on sellers in a falling market or sellers' pressure in a growing one, whether it is a decrease in the overall activity due to a decrease in participants, or traders simply decided to take a break to analyze what is happening. We will go even further. We can easily turn it into a familiar form of an oscillator with a zero balance line based on the parabolic movement of the main indicator line. This can be done by removing the reduction of the main value to an absolute value ( ADX). Delete from the following line:
dTmp=100.0*MathAbs((ExtPDIBuffer[i]-ExtNDIBuffer[i])/dTmp);
the MathAbs function.
As a result, we get the following indicator.
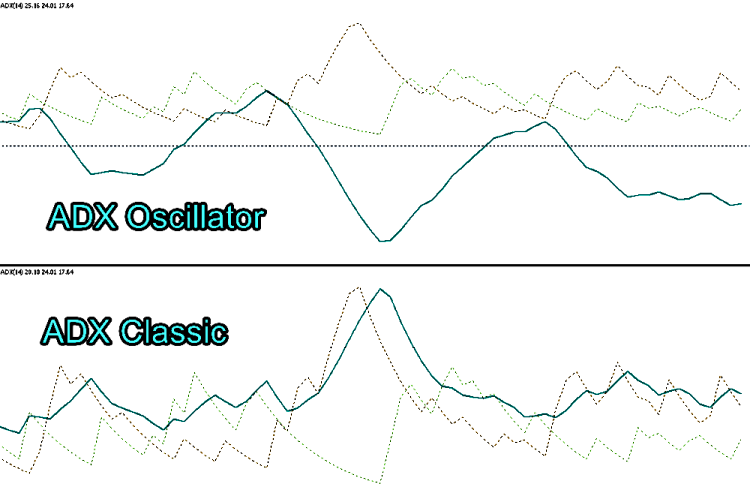
Fig. 59
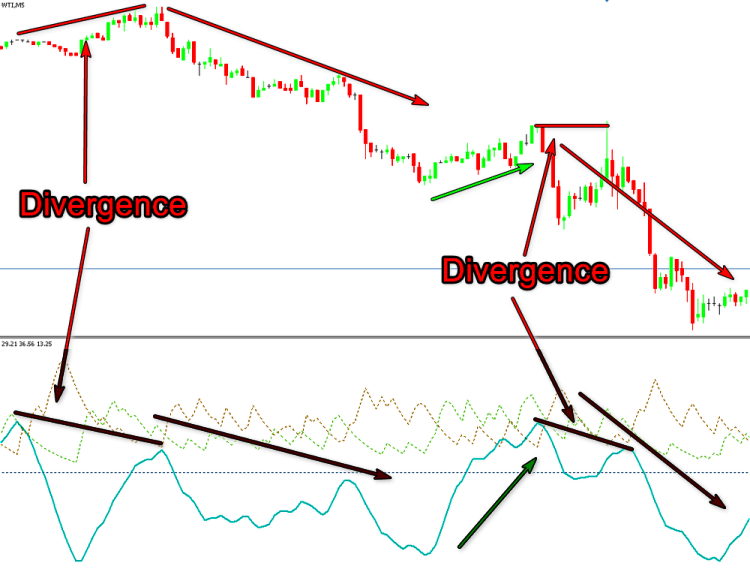
Fig. 60
As can be seen from the above figure, our ADX (let us call it ADX_Osc) is good at showing market direction, based on which we can search for divergences on a global scale. The line is still a bit lagging. This disadvantage can be compensated by preliminary market reversal signals. They are determined based on "DI-" and "DI+".
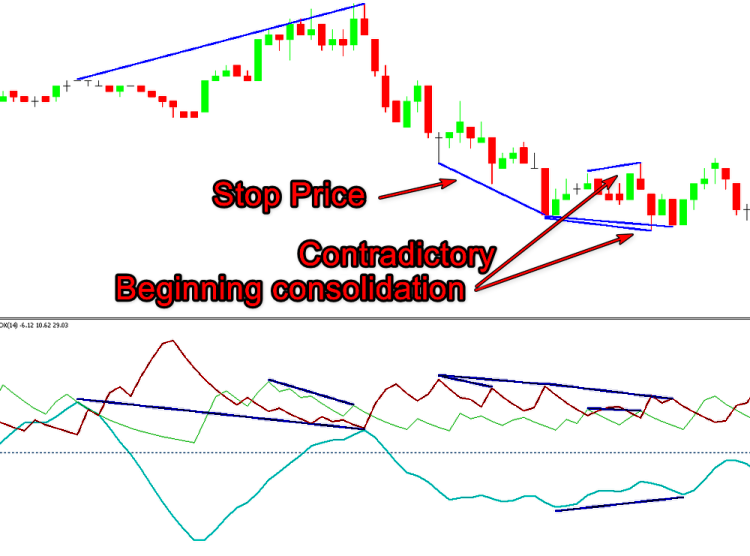
Fig. 61
To understand better why the difference between DI- (red line) and the price is determined like this, please read again the part related to ADX. We can see it from the figure: buyers' pressure in a downtrend has begun, which leads to further consolidation, and there is confirmation by the main line of the indicator. But we need a more serious reason to enter a BUY deal. It can be seen from Fig. 60 that the market continued its downward movement.
What can be used for decision making is the "unidirectional" line of DI- and DI+. Why "Unidirectional" if the price seems to be rising and falling at the same time. We understand that this cannot happen. This is the diversion. Such moments arise when the so called "inside bar" appears.
Let us check. Price Action: "Inside bar (IB) is a set of candlesticks located within the range of the previous candlestick, which has the highest low and the lowest high greater than those of the preceding one. On high timeframes, the setup often looks like a triangle. The inside bar indicates uncertainty and market consolidation. It is usually found in the trend market, where it indicates trend continuation after the breakdown of the mother candlestick. It often happens at the market top/bottom, at main support/resistance levels and in sideway channels."
Our case is not quite suitable for this definition. As you probably remember, we determine the strength but not direction. Therefore, our definition should be like this: "Bulls power at the current bar is less than at the previous one, while Bears power is greater than at the previous bar. The bar shape is irrelevant."
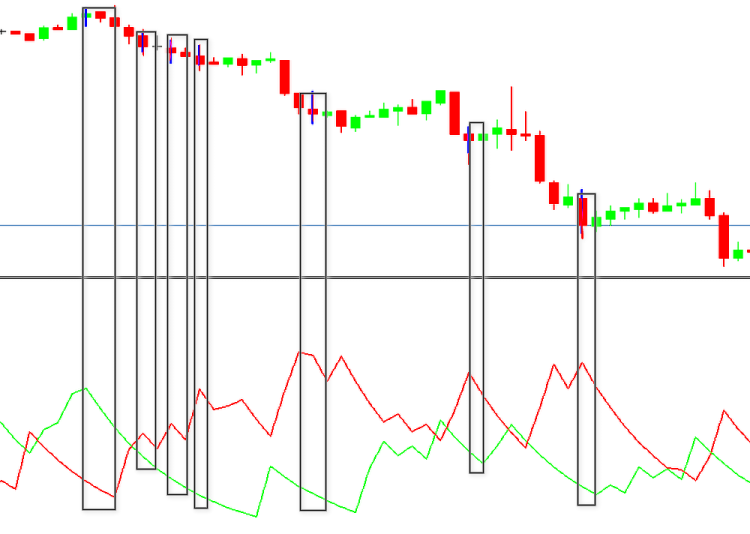
Fig. 62
Here we still preserve the main idea: the bar signals market stop or reversing. When assessing its quality, let us take into account the main trend direction (strength) which is represented by the ADX_Osc line . If the trend develops, the ADX line value is higher than the previous one for the uptrend and lower for the downtrend. This indicates consolidation (Stop Price). If the trend weakens, the main line decreases during the uptrend and rises during the uptrend (divergence), then we can expect a market reversal. That is all we need for the creation of our indicator.
Of course, ADX can do much more. But our task is not to utilize all of its possibilities.
Here comes a small digression, before we continue. Some time ago, my offer to write an article was declined. I was advised to start a blog. But I had already done a lot of work preceding that publication. The article contained only excerpts which seemed essential to me. No one explained at that time that the article must contain program code. However I was discouraged. Later, I came back to the idea and wanted to share my research results. I failed once again. A simple presentation of the idea did not satisfy the moderators. This time I decided to write everything that preceded the result. Of course, this material does not provide 100% of details. Before proceeding to the final stage of our research, I will briefly mention why the obtained result may seem worthless.
In the previous article, we briefly touched on the issues arising with indicators based on graphical constructions. Such tools are hard to analyze further, because this cannot be done in the adaptation mode. They can only be analyzed visually, which is very time-consuming. The indicator signals are very hard-to-pass, so its code needs to be added to Expert Advisor code. There are also issues with the correct drawing of its lines, which results in false market entry signals. This problem can be solved, but this is beyond the scope of this article.
We should probably address this issue to MQL language developers: why isn't it possible to create graphical objects as a machine code library? Why cannot a buffer, data from which we need to pass (as a plot or as data), belong separately to the main chart window and its subwindow? Perhaps someone will write an article related to this topic or I may want to do it myself. Based on the above, let's summarize the preliminary result. In my opinion we have selected the most suitable indicator for a non-standard approach, which is able to cope with our main task. Based on the analysis, I have determined its behavioral moments that are optimal for implementation and will not overload the screen. We will not avoid all graphical constructions in the indicator, as the main task is not trading automation but the opportunity to apply the indicator in trading.
Please note, we are not creating a specific complete concept. This is a "testing ground" for further work. Everyone can use this tool as the basis for implementing specific desired features. For this reason, we implement the "non-standard approach" only for the short-term trend, while using the classic solution for global signals.
The major code of ADX remains without significant changes. We make a few changes to implement it as an oscillator. Due to this, ADX cannot be simply called via Handle.
#property indicator_separate_window
#property indicator_buffers 8
#property indicator_plots   3
#property indicator_type1   DRAW_LINE
#property indicator_color1  LightSeaGreen
#property indicator_style1  STYLE_SOLID
#property indicator_width1  1
#property indicator_type2   DRAW_LINE
#property indicator_color2  Green
#property indicator_style2  STYLE_DOT
#property indicator_width2  1
#property indicator_type3   DRAW_LINE
#property indicator_color3  Red
#property indicator_style3  STYLE_DOT
#property indicator_width3  1
#property indicator_label1  "ADX"
#property indicator_label2  "+DI"
#property indicator_label3  "-DI"
//--- input parameters
input int InpPeriodADX=14; // Period
input int extremum=100; // Extremum (<1 Div= OFF)
input int Gep=4; // Point to Gep
input int Bars_Calculated=300;
//--- global variables
input bool   allLine=false;// All Line
int    ExtADXPeriod;
double PDI,NDI,pDI,nDI;
string short_name="";
int    wid=-1;
//---- buffers
double    ExtADXBuffer[];
double    ExtPDIBuffer[];
double    ExtNDIBuffer[];
double    ExtPDBuffer[];
double    ExtNDBuffer[];
double    ExtTmpBuffer[];
double    ExtUpBuffer[];
double    ExtDnBuffer[];
Some of the inputs need explanation.
input int extremum=100; // Extremum (<1 Div= OFF)
This is the number of indicator line extremes, which we be checked to find divergence. The minimum number is "1". If less, then no calculation will be performed. Later, after determining the optimal number, it is better to make it a global parameter.
input bool allLine=false;// All Line
This parameter allows showing on the screen the lines of all divergences found during indicator operation and defined by the 'extremum' parameter. Set specifically to simplify the indicator analysis and to determine the value of the above parameter.
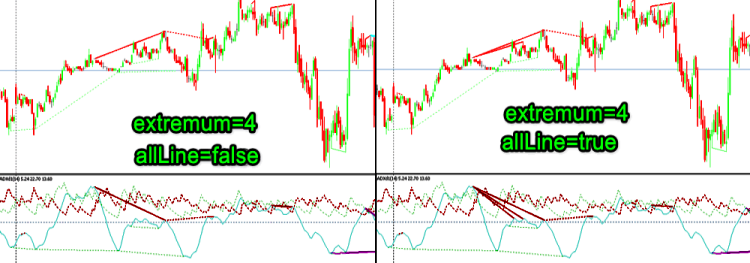
Fig. 63
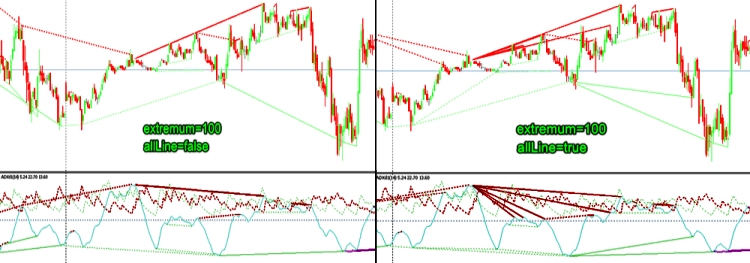
Fig. 64
input int Gep=4; // Point to Gep
It is used for aesthetic purposes. The points with a spread of values, determined by this parameter, will be arranged as one line. I determined this value as one and a half to two spreads. It does not affect the indent. If you need the offset, you should additionally set this value. The points will be explained later. To reduce the OnDeinit function, we will use a command deleting all data with a prefix, which is equal to the indicator name. The MetaTrader 5 terminal may have some slowdown when deleting a large number of objects from the main screen. To avoid this, let us add a forced redrawing of the screen.
//+------------------------------------------------------------------+
void OnDeinit(const int reason)
  {
   ObjectsDeleteAll(0,short_name);
   ChartRedraw(0);
  }
//+------------------------------------------------------------------+
It noticed that if the terminal was not connected for a long time, graphical objects in the subwindow retain their binding not to the price/time coordinates, but in pixels of their last position. Therefore, in the block determining the number of bars for the first calculation let us add a command to delete them. There might be a better solution to this, but I solved this issue as follows.
   if(prev_calculated>1) start=prev_calculated-1;
   else
     {
      OnDeinit(9);
      start=1;
      ExtPDIBuffer[0]=0.0;
      ExtNDIBuffer[0]=0.0;
      ExtADXBuffer[0]=0.0;
     }
A block determining the unidirectional movement of the DI+ and DI- lines has been added to the indicator's main calculation function.
//+------------------------------------------------------------------+
//|           Fast divergence calculation                            |
//+------------------------------------------------------------------+
   int bar=start;
   if(prev_calculated<2) bar=start+2;
   if(Bars_Calculated>0)bar=fmax(rates_total-Bars_Calculated,start);
//---
   for(int i=bar;i<rates_total-1 && !IsStopped();i++)
     {
      ExtUpBuffer[i-1]=EMPTY_VALUE;
      ExtDnBuffer[i-1]=EMPTY_VALUE;
      //---
      color clrUp=clrLime;
      color clrDn=clrDarkViolet;
      //---
      if((ExtPDIBuffer[i-1]<ExtPDIBuffer[i-2] && ExtNDIBuffer[i-1]<ExtNDIBuffer[i-2]) ||
         (ExtPDIBuffer[i-1]>ExtPDIBuffer[i-2] && ExtNDIBuffer[i-1]>ExtNDIBuffer[i-2]))
        {
         if(ExtPDIBuffer[i-1]>ExtNDIBuffer[i-1])
           {
            if(ExtADXBuffer[i-1]>ExtADXBuffer[i-2])
               ExtUpBuffer[i-1]=high[i-1];
            else
              {
               ExtUpBuffer[i-1]=EMPTY_VALUE;
               ExtDnBuffer[i-1]=low[i-1];
               clrDn=clrGold;
              }

            //---
            if(MathAbs(ExtUpBuffer[i-1]-ExtUpBuffer[i-2])<Gep*_Point)
               ExtUpBuffer[i-1]=ExtUpBuffer[i-2];
            if(MathAbs(ExtDnBuffer[i-1]-ExtDnBuffer[i-2])<Gep*_Point)
               ExtDnBuffer[i-1]=ExtDnBuffer[i-2];
            //---
           }
         if(ExtPDIBuffer[i-1]<ExtNDIBuffer[i-1])
           {
            if(ExtADXBuffer[i-1]<ExtADXBuffer[i-2])
               ExtDnBuffer[i-1]=low[i-1];
            else
              {
               ExtDnBuffer[i-1]=EMPTY_VALUE;
               ExtUpBuffer[i-1]=high[i-1];
               clrUp=clrBlue;
              }

            //---
            if(MathAbs(ExtDnBuffer[i-1]-ExtDnBuffer[i-2])<Gep*_Point)
               ExtDnBuffer[i-1]=ExtDnBuffer[i-2];
            if(MathAbs(ExtUpBuffer[i-1]-ExtUpBuffer[i-2])<Gep*_Point)
               ExtUpBuffer[i-1]=ExtUpBuffer[i-2];
            //---
           }
        }
      //---
      if(ExtUpBuffer[i-1]==EMPTY_VALUE)
         ExtUpBuffer[i-1]=ExtUpBuffer[i-2];
      if(ExtDnBuffer[i-1]==EMPTY_VALUE)
         ExtDnBuffer[i-1]=ExtDnBuffer[i-2];
      //---
      if(ExtUpBuffer[i-1]!=EMPTY_VALUE)
        {
         ArrowCreate(short_name+(string)time[i]+(string)Lime,time[i],ExtUpBuffer[i-1],ANCHOR_BOTTOM,clrUp);
         if(ExtUpBuffer[i-1]!=ExtUpBuffer[i-2])
            ArrowCreate(short_name+(string)time[i-1]+(string)Lime,time[i-1],ExtUpBuffer[i-1],ANCHOR_BOTTOM,clrUp);
        }
      else
         ArrowCreate(short_name+(string)time[i]+(string)Lime,time[i],ExtUpBuffer[i-2],ANCHOR_BOTTOM,clrUp);
      //---
      if(ExtDnBuffer[i-1]!=EMPTY_VALUE)
        {
         ArrowCreate(short_name+(string)time[i]+(string)Red,time[i],ExtDnBuffer[i-1],ANCHOR_TOP,clrDn);
         if(ExtDnBuffer[i-1]!=ExtDnBuffer[i-2])
            ArrowCreate(short_name+(string)time[i-1]+(string)Red,time[i-1],ExtDnBuffer[i-1],ANCHOR_TOP,clrDn);
        }
      else
         ArrowCreate(short_name+(string)time[i]+(string)Red,time[i],ExtDnBuffer[i-2],ANCHOR_TOP,clrDn);
     }
Also, the module for launching the global divergence calculation functions has been added here.
//+-------------------- Finding a discrepancy ----------------------+
   bar=start;
   if(bar>rates_total-2)bar=rates_total-2;
   if(Bars_Calculated>0)bar=fmax(rates_total-Bars_Calculated,bar);
   for(int i=bar;i<rates_total-2 && !IsStopped() && extremum>0;i++)
     {
      UP(i,ExtADXBuffer,high,time);
      DN(i,ExtADXBuffer,low,time);
     }
The indicator from Part 1 was re-written from MQL4. This version was originally written in MQL5, that is why the divergence search have been changed.
Bearish divergence search function.
//+----------- Detecting UP divergences ------------------------------+
void UP(int l,const double &buf[],const double &high[],const datetime &time[])
  {
   if(Extremum(buf[l+1],buf[l],buf[l-1])<0)
     {
      int i=l;
      for(int j=0;j<extremum;j++)
        {
         int counted=LastPeak(i,buf);
         if(counted!=-1)
           {
            if(buf[l]<buf[counted] && high[l]>high[counted])
              {
               double k=fabs(buf[l]-buf[counted])/(l-counted);
               int z=1;
               bool yes=true;
               for(i=l-1;i>counted;z++,i--)
                     if(buf[i]>buf[l]+k*z){yes=false;break;}
               if(yes)
                 {
                  DrawPriceTrendLine(time[l],time[counted],high[l],high[counted],Red,STYLE_SOLID);
                  DrawIndicatorTrendLine(time[l],time[counted],buf[l],buf[counted],Red,STYLE_SOLID);
                  break;
                 }
              }

            if(buf[l]>buf[counted] && high[l]<high[counted])
              {
               double k=fabs(buf[l]-buf[counted])/(l-counted);
               int z=1;
               bool yes=true;
               for(i=l-1;i>counted;z++,i--)
                     if(buf[i]>buf[l]-k*z){yes=false;break;}
               if(yes)
                 {
                  DrawPriceTrendLine(time[l],time[counted],high[l],high[counted],Red,STYLE_DOT);
                  DrawIndicatorTrendLine(time[l],time[counted],buf[l],buf[counted],Red,STYLE_DOT);
                  break;
                 }
              }
           }
         i=counted;
        }
      //---
     }
  }
Bullish divergence search function.
//+----------- Detecting DN divergences ------------------------------+
void DN(int l,const double &buf[],const double &low[],const datetime &time[])
  {
   if(Extremum(buf[l+1],buf[l],buf[l-1])>0)
     {
      int i=l;
      //---
      for(int j=0;j<extremum;j++)
        {
         int counted=LastTrough(i,buf);
         if(counted!=-1)
           {
            if(buf[l]>buf[counted] && low[l]<low[counted])
              {
               double k=fabs(buf[l]-buf[counted])/(l-counted);
               int z=1;
               bool yes=true;
               for(i=l-1;i>counted;z++,i--)
                     if(buf[i]<buf[l]-k*z){yes=false;break;}
               if(yes)
                 {
                  DrawPriceTrendLine(time[l],time[counted],low[l],low[counted],Green,STYLE_SOLID);
                  DrawIndicatorTrendLine(time[l],time[counted],buf[l],buf[counted],Green,STYLE_SOLID);
                  break;
                 }
              }
            if(buf[l]<buf[counted] && low[l]>low[counted])
              {
               double k=fabs(buf[l]-buf[counted])/(l-counted);
               int z=1;
               bool yes=true;
               for(i=l-1;i>counted;z++,i--)
                     if(buf[i]<buf[l]+k*z){yes=false;break;}
               if(yes)
                 {
                  DrawPriceTrendLine(time[l],time[counted],low[l],low[counted],Green,STYLE_DOT);
                  DrawIndicatorTrendLine(time[l],time[counted],buf[l],buf[counted],Green,STYLE_DOT);
                  break;
                 }
              }
           }
         i=counted;
        }
      //---
     }
  }
The main difference is in the additional filter. I found out that for cases in figures 20 and 28 the signal has a positive trend of less than 30%. That is why they were removed. The filter code is highlighted. Extremum detection function has also changed. Filtering by positive and negative value of indicator line position has been excluded from it. In our case, this is useless and can even be harmful. Since the line can take equal values on the current and previous bar, we provide the possibility for the main definition to be equal to zero.
The search rules can be easily changed later, if necessary.
//+-- Search for extrema --------------------------------------------+
int Extremum(double a,double b,double c)
  {
   if((a-b)*(b-c)<=0)
     {
      if(c>b) return(1); //DN extremum
      if(c<b) return(-1);//UP extremum
     }
   return(0);
  }
Search for the left shoulder is almost unchanged.
//+----- Search for the second UP extremum --------------------------+
int LastPeak(int l,const double &buf[])
  {
   for(int i=l-2; i>4; i--)
     {
      int ext=Extremum(buf[i+1],buf[i],buf[i-1]);
      if(ext < 0)return (i);
     }
   return (-1);
  }
//+----- Search for the second DN extremum --------------------------+
int LastTrough(int l,const double &buf[])
  {
   for(int i=l-2; i>4; i--)
     {
      int ext=Extremum(buf[i+1],buf[i],buf[i-1]);
      if(ext > 0)return (i);

     }
   return (-1);
  }
The following function builds the previously mentioned points. The points mark short-term deviations.
//+-------------------- Creates an arrow -----------------------------+
bool ArrowCreate(string                  name,
                 datetime                time,
                 double                  price,
                 ENUM_ARROW_ANCHOR       anchor,
                 color                   clr)
  {
//--- reset the error value
   ResetLastError();
//--- create an arrow
   if(!ObjectCreate(0,name,OBJ_ARROW,0,time,price))
     {
      Print(__FUNCTION__,
            ": failed to create an arrow! Error code = ",GetLastError());
      return(false);
     }
   ObjectSetInteger(0,name,OBJPROP_ARROWCODE,167);
//--- set the binding type
   ObjectSetInteger(0,name,OBJPROP_ANCHOR,anchor);
   ObjectSetInteger(0,name,OBJPROP_COLOR,clr);
   ObjectSetInteger(0,name,OBJPROP_STYLE,STYLE_SOLID);
   ObjectSetInteger(0,name,OBJPROP_WIDTH,1);
   ObjectSetInteger(0,name,OBJPROP_BACK,false);
   ObjectSetInteger(0,name,OBJPROP_SELECTABLE,false);
   ObjectSetInteger(0,name,OBJPROP_SELECTED,false);
   ObjectSetInteger(0,name,OBJPROP_HIDDEN,true);
//--- successful implementation
   return(true);
  }
//+------------------------------------------------------------------+
The main drawing blocks have also been changed to enable the possibility to display all divergence lines or only the last one in the interval specified by the " extremum" parameter.
For the main chart window
//+------ Creating objects on the price chart -----------------------+
void DrawPriceTrendLine(datetime T_0,datetime T_1,double P_0,double P_1,color color_0,int style)
  {
   string name_0=short_name+"Line_Sn"+ColorToString(color_0);
   string name_1="";
   if(allLine)
      name_1=short_name+DoubleToString(T_0,0);
   else
      name_1=short_name+DoubleToString(T_1,0);
//---
   ObjectDelete(0,name_1);
   drawLineS(name_1,T_0,T_1,P_0,P_1,color_0,style,0,true,false,0);
//+-----------+
   if(style==STYLE_DOT)
     {
      ObjectDelete(0,name_0);
      drawLineS(name_0,T_1,T_0,P_1,P_0,clrAqua,0,3,true,true,0);
     }
  }
and in the indicator window
//+------ Creating objects in the indicator window ------------------+
void DrawIndicatorTrendLine(datetime T_0,datetime T_1,double P_0,double P_1,color color_0,int style)
  {

   int window=wid;
   string name_0=short_name+"Line_Pn"+ColorToString(color_0);
   string name_1="";
   if(allLine)
      name_1=short_name+DoubleToString(T_0+wid,0);
   else
      name_1=short_name+DoubleToString(T_1+wid,0);
//---
   ObjectDelete(0,name_1);
   drawLineS(name_1,T_0,T_1,P_0,P_1,color_0,style,0,false,false,window);
//---
   if(style==STYLE_SOLID)
     {
      ObjectDelete(0,name_0);
      drawLineS(name_0,T_1,T_0,P_1,P_0,clrMagenta,style,2,true,true,window);
     }
  }
For the same reason, the deletion command was moved from the trendline construction function to the main block.
//+------------------------------------------------------------------+
void drawLineS(string name,datetime T_0,datetime T_1,double P_0,double P_1,color clr,
               int style,int width,bool back,bool ray,int window)
  {
   ObjectCreate(0,name,OBJ_TREND,window,T_0,P_0,T_1,P_1,0,0);
   ObjectSetInteger(0,name,OBJPROP_RAY_RIGHT,ray);
   ObjectSetInteger(0,name,OBJPROP_COLOR,clr);
   ObjectSetInteger(0,name,OBJPROP_STYLE,style);
   ObjectSetInteger(0,name,OBJPROP_WIDTH,width);
   ObjectSetInteger(0,name,OBJPROP_SELECTABLE,false);
   ObjectSetInteger(0,name,OBJPROP_BACK,back);
  }
The indicator now looks as follows.
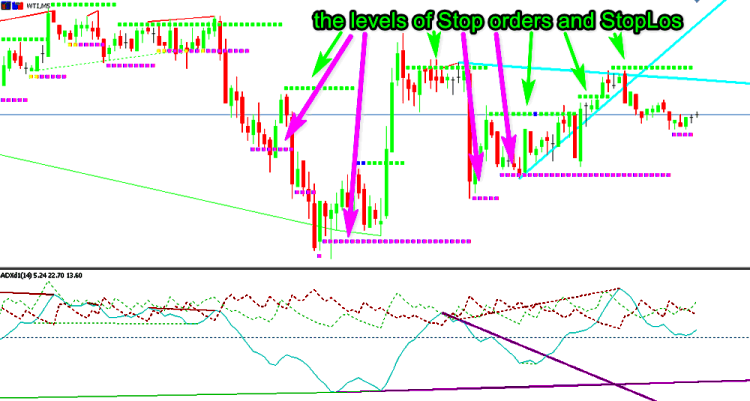
Fig. 65
In addition to the usual divergence lines, we see a lot of points which mark consolidation zones and serve as entry points for Sell and Buy deals. These signals are determined by the discovered rules (unidirectional movement of DI+ and DI-). Green points show Buy entry points, purple points show entries to Sell. Appearance of blue points against a background of green buttons or yellow points against purple indicate trend uncertain and possible change. After deal opening the points can serve as levels to trail stop levels. Please note that it is undesirable that you enter using pending orders based on the points. Firstly, the points identify short-term market trends and can cause false triggering. A trade signal occurs when the candlestick closes above (below) this level. The Gap variable is used for drawing. The algorithm is as follows: after the emergence of a Sell signal, a point appears below the Low of the bar at which the signal is formed. For Buy signals, a point is drawn above High. The indent from High\low is implemented by the functions that determine anchor points ANCHOR_BOTTOM and ANCHOR_TOP. After that all signals within a distance of "+\- Gap" will be created based on the first point.
This version can be further changed. For example, you can try to reduce the main line lagging. The easiest solution is to reduce the second smoothing period and move it to variables. We can also delete the part concerning classical signal detection and add the algorithm mentioned earlier in relation to MACD. Only the entry levels will be drawn on the chart. Thus we eliminate unnecessary drawings.
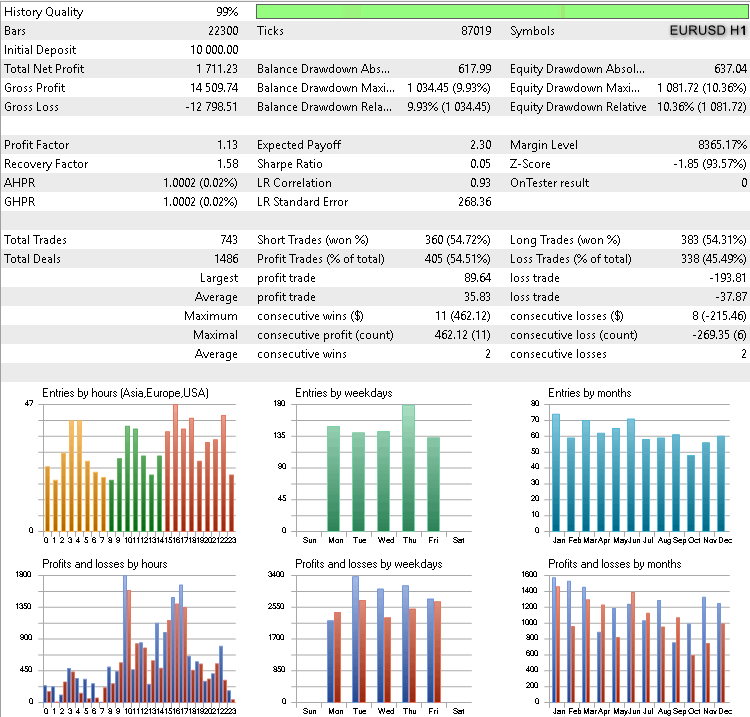
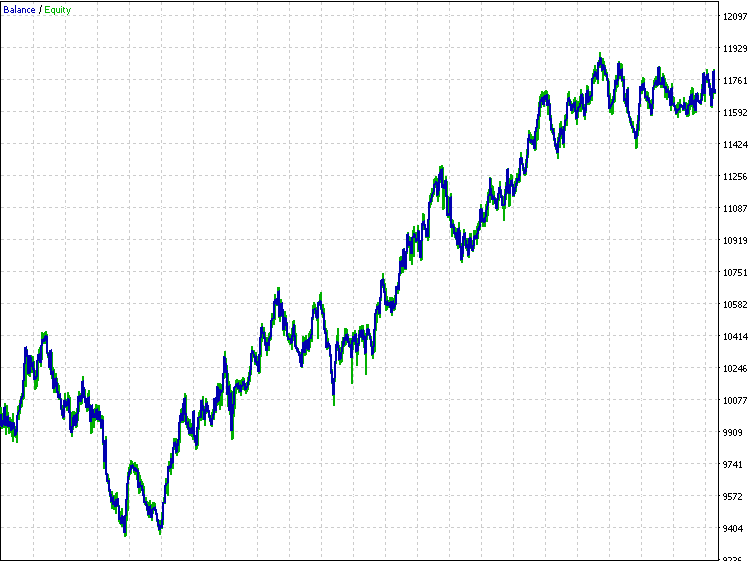
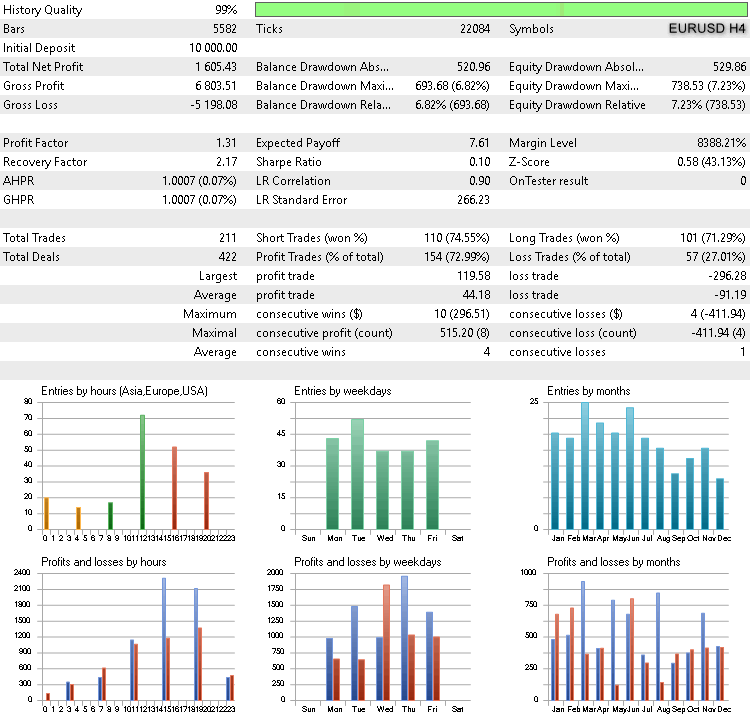
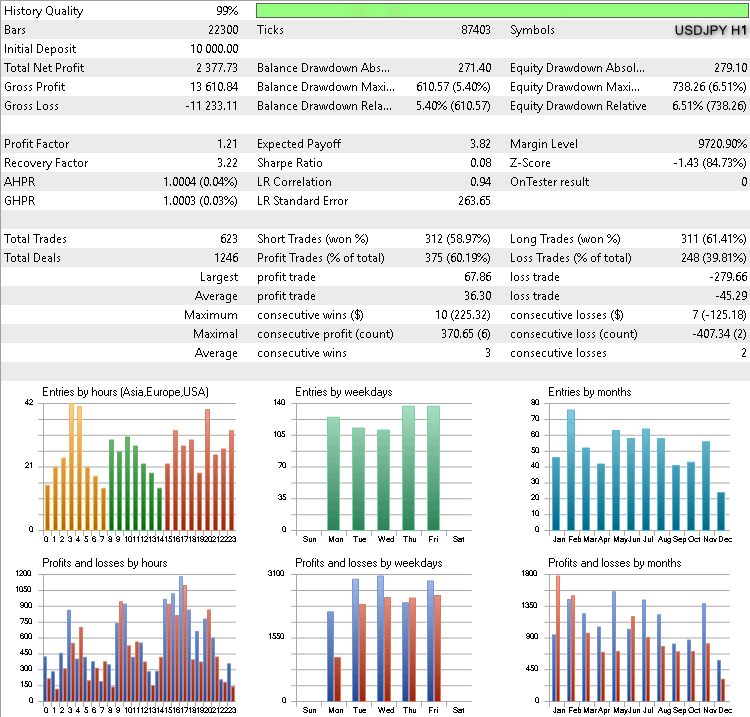
We can check these ideas by creating a small robot. We are not interested in the classical variant and in the main line direction. This allows us using the standard ADX from the terminal. Filter will only be applied when the breakout candlestick is too large. For cases when there is no line of an opposite conditional channel where stops could be set, introduce the Stop Loss distance. Also, in the EA we need to set the distance from High/Low. Below are testing results for the main currency pairs: EUR/USD, GBP/USD, USD/JPY over the period from 01.01.2016 to 01.06.2019 at the H1 and H4 timeframe.
EURUSD Н1
EURUSD Н4
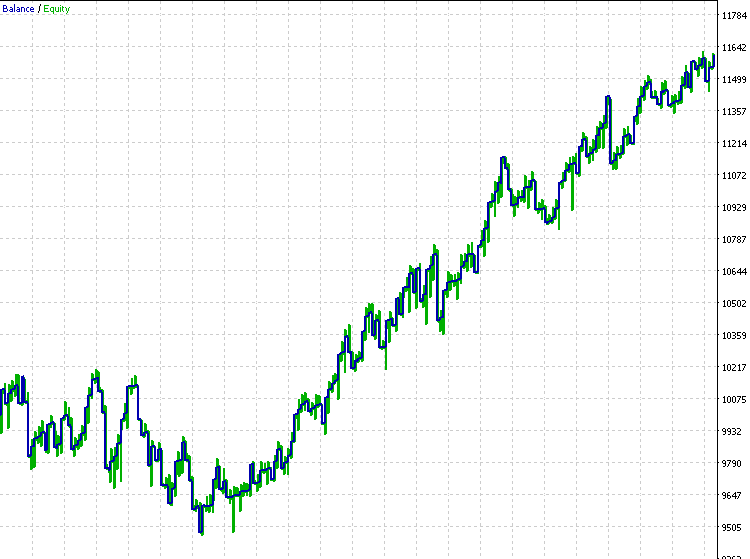
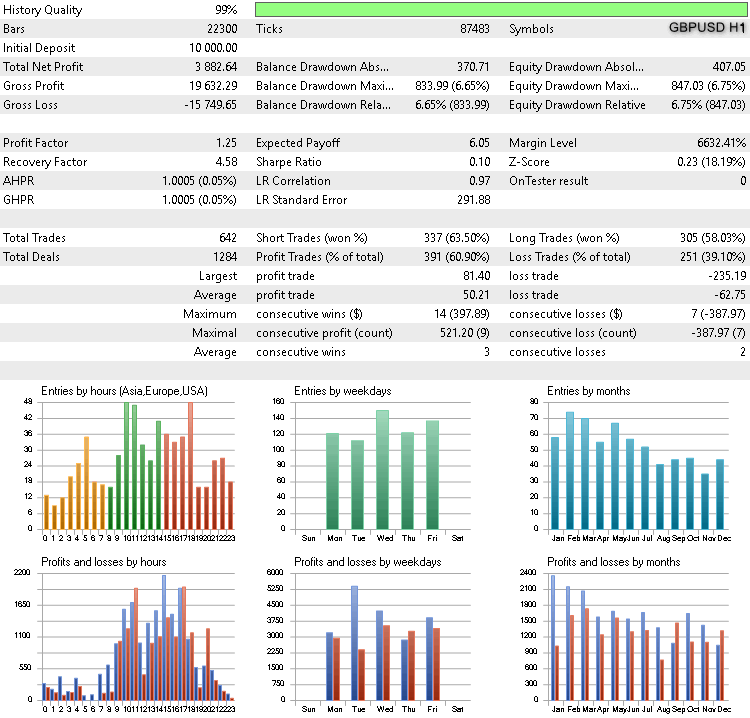
GBPUSD H1
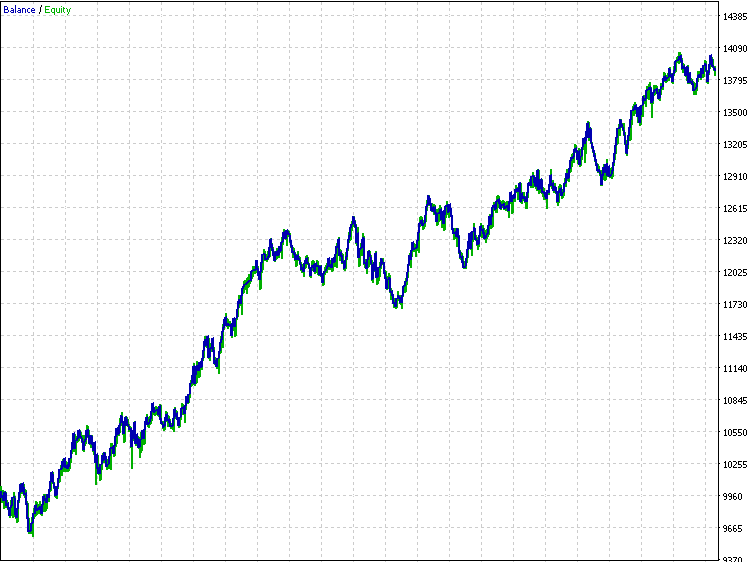
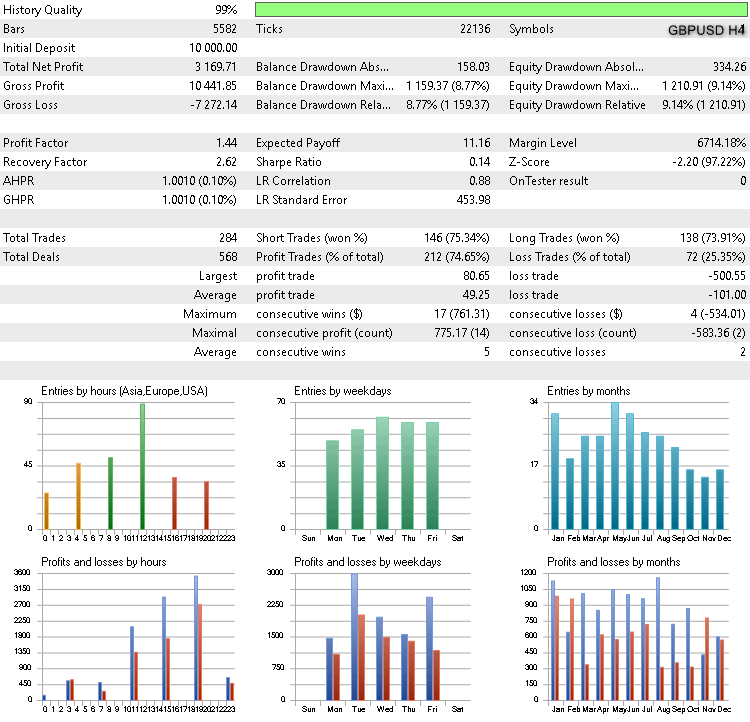
GBPUSD H4
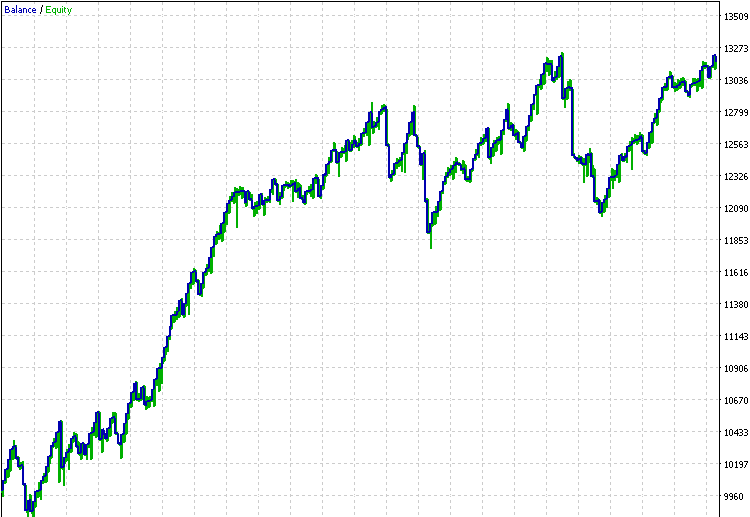
JPYUSD H1
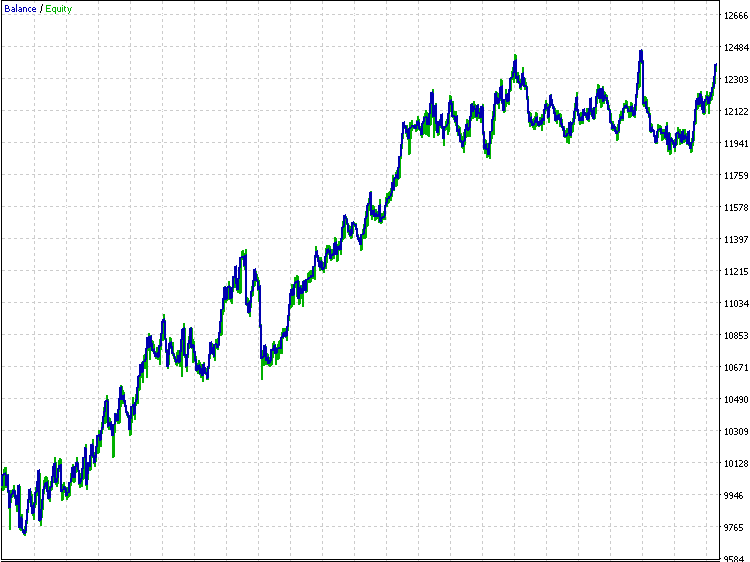
JPYUSD H4
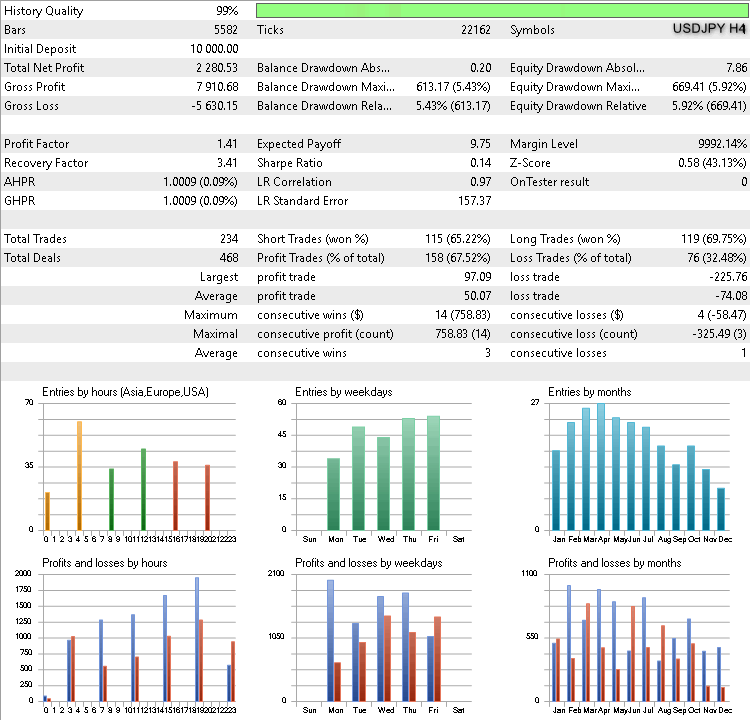
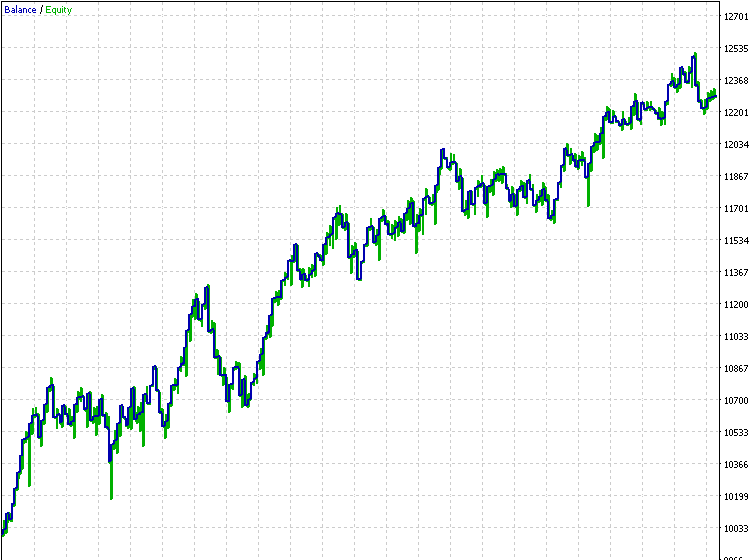
Of course, results are not very good. But this is not the goal. What's more important is that there is a positive tendency.
Conclusions
So what is a new approach to the well-known ideas? Is it a waste of time or progress? You are a successful trader. You have a great working strategy. Should you revise your strategy to achieve a higher result? Or leave it like this? You should decide for yourself. Perhaps the results of my research will inspire someone to take a different look at their strategy or even create completely new technical analysis tools.
I am an adept of self-study, so I am always critical to publicly available materials. I do not stick to specific ideas by popular writers. In different forums I read lengthy description of strategy nuances provided by their authors. I always try to find the most efficient solutions within the framework of profit maximization concept. I hope this material will help the readers and encourage them to use new approaches in order to improve their strategies. This material includes only a small part of what was done during the study of divergences. Some of the issues and questions arising during my research required non-standard solutions. It is difficult to describe everything within one article. So possibly I will publish more materials describing other non-standard solutions.
PS: Please do not request the improvement of the published material or the creation of trading robots. Please use the Freelance service. Programming is rather a necessity for me: I started developing only to learn the language possibilities and to check my ideas.
| # | Name | Type | Description |
|---|---|---|---|
| 1 | ADX_Osc.mq5 | Indicators | Divergence analyzing indicator. |
| 2 | TestADX.mql5 | Experts | An Expert Advisor for testing the ideas. |
Translated from Russian by MetaQuotes Ltd.
Original article: https://www.mql5.com/ru/articles/5703
Warning: All rights to these materials are reserved by MetaQuotes Ltd. Copying or reprinting of these materials in whole or in part is prohibited.
This article was written by a user of the site and reflects their personal views. MetaQuotes Ltd is not responsible for the accuracy of the information presented, nor for any consequences resulting from the use of the solutions, strategies or recommendations described.

- Free trading apps
- Over 8,000 signals for copying
- Economic news for exploring financial markets
You agree to website policy and terms of use
The theory of impulse equilibrium shows that in fact divergence is a consequence of imperfection of algorithms of traditional indicators.
In particular, due to the lack of a mechanism to take into account non-stationarity in the form of constantly changing frequency of price fluctuations.
Nice article Alex.
Had quick read, will go back and read again (and again..) to absorb.
Much appreciated, regards, Paul
Thank you so much, Alex,
I reread your article many times to try to understand your ideas. Only a little regret is that I cannot translate this article into Vietnamese to increase knowledge for traders in my country, because of copyright issues.
Jewel
in your programs we find include files like
#include <Trade\Trade.mqh>
#include <Trade\SymbolInfo.mqh>
#include <Trade\PositionInfo.mqh>
#include <Trade\AccountInfo.mqh>
Where can I get these files?