KT SSL Indicator MT4
- Indicateurs
-
KEENBASE SOFTWARE SOLUTIONS
 Keenbase Trading développe des indicateurs professionnels et des Expert Advisors pour MetaTrader 4 et MetaTrader 5 afin d'aider les traders à prendre des décisions de trading plus éclairées.
 - Version: 1.0
- Activations: 10
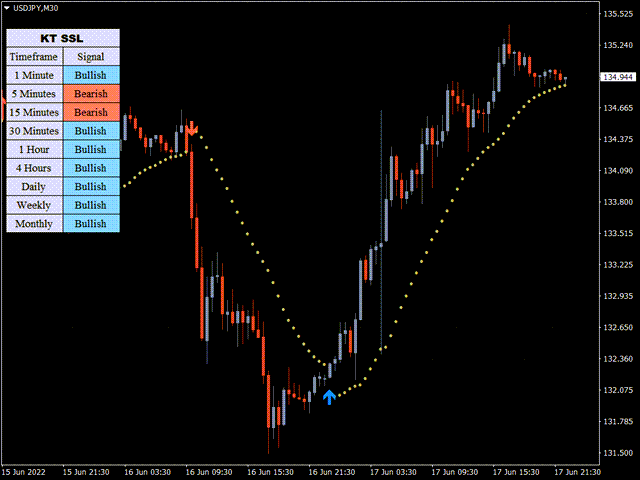
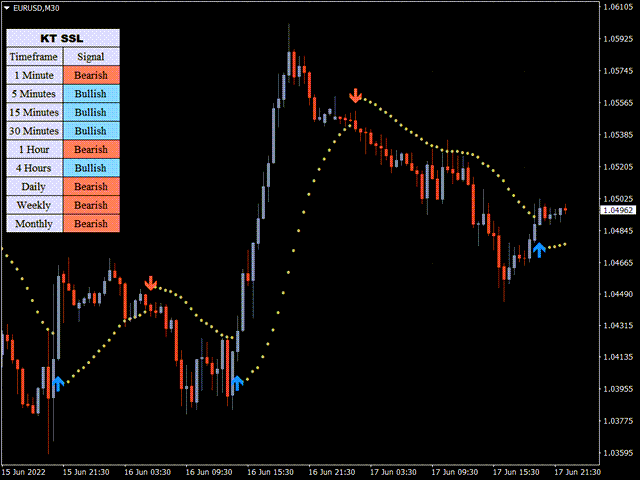
SSL signifie Semaphore Signal Level. Il s’agit d’un canal constitué de deux moyennes mobiles appliquées respectivement aux plus hauts et aux plus bas des bougies, afin de créer une enveloppe qui suit les mouvements du prix.
- Signal d'achat : Lorsque le prix clôture au-dessus de la moyenne mobile supérieure.
- Signal de vente : Lorsque le prix clôture en dessous de la moyenne mobile inférieure.
Fonctionnalités
- Intègre un scanner multi-timeframe qui détecte les nouveaux signaux sur toutes les unités de temps.
- Une implémentation simple et efficace du canal SSL classique pour identifier la direction de la tendance.
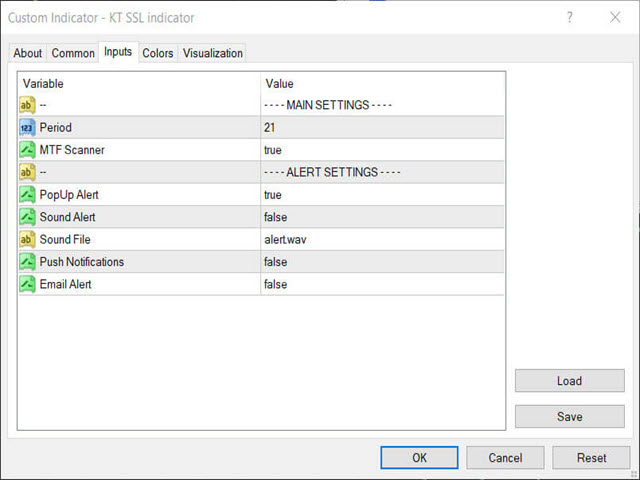
- Inclut toutes les alertes compatibles avec MetaTrader.
Formule SSL
- Ligne supérieure : Moyenne mobile appliquée aux plus hauts des bougies.
- Ligne inférieure : Moyenne mobile appliquée aux plus bas des bougies.
- Entrée achat : Lorsque le prix clôture au-dessus de la ligne SSL supérieure.
- Sortie achat : Lorsque le prix clôture en dessous de la ligne SSL inférieure.
- Entrée vente : Lorsque le prix clôture en dessous de la ligne SSL inférieure.
- Sortie vente : Lorsque le prix clôture au-dessus de la ligne SSL supérieure.
One of the best trend indicators. I really appreciate your work with this easy-to-use indicator. Thank you so much for this wonderful indicator and especially for your kind support. Best regards.