Wolfe Wave

This particular methodology.

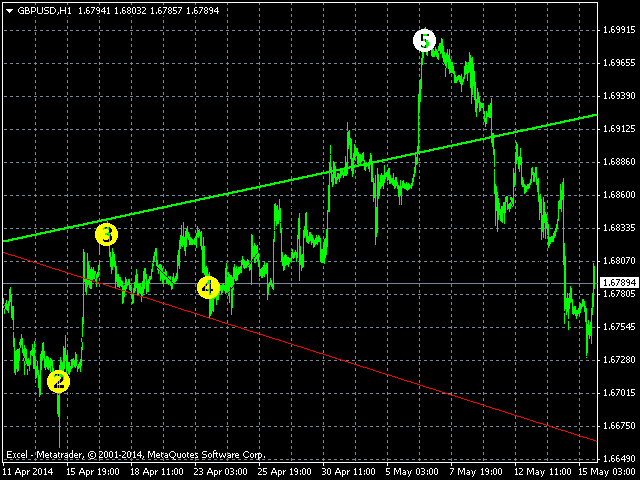
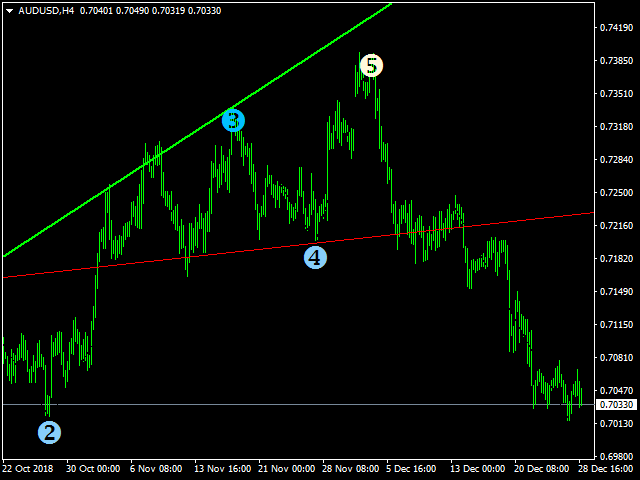
Please note the odd sequence in counting, as you will see, it is necessary for the inductive analysis. By starting with a top we are assured of beginning our count on a new wave. (The reverse would apply for a bearish wave.)

  • The 2 point is a top.
  • The 3 point is the bottom of the first decline.
  • The 1 point is the bottom prior to point 2 (top), that 3 has surpassed.
  • The 4 point is the top of the rally after point 3.
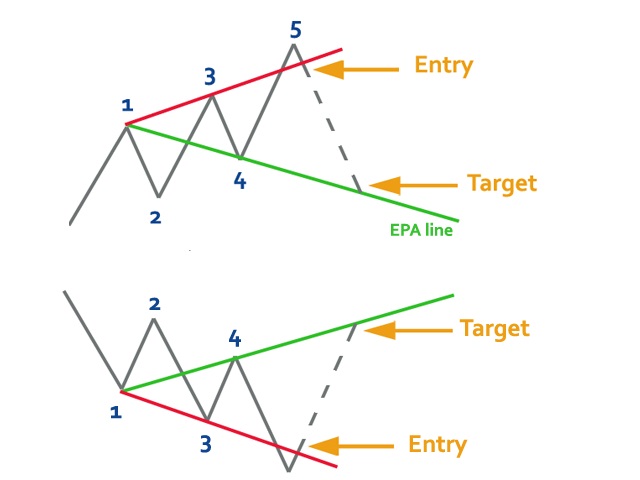
  • The 5 point is the bottom after point 4 and is likely to exceed the extended trend line of 1 to 3. This is the entry point for a ride to the EPA line (1 to 4).
  • Estimated Price at Arrival (EPA) is trend line of 1 to 4 at apex of extended trend line of 1 to 3 and extended trend line of 2 to 4.
  • Estimated Time of Arrival (ETA) is apex of extended trend line of 1 to 3 and 2 to 4.
Produits recommandés
This is a well-known ZigZag indicator. But it differs by the fact that its plot is based on values of the middle line which is set by a user. It can display Andrews’ Pitchfork and standard or Bobokus Fibo levels. NO REPAINTING. Parameters Period МА — middle line period. Default value is 34. Minimum value is 4. Maximum value is set at your discretion. Used to calculate price - base price to calculate the middle line. The averaging method - method of smoothing the middle line. Turning pitchfork —
Description The base of this indicator is an ZigZag algorithm based on ATR and Fibo retracement. The ZigZag can be drawn like a classic ZigZag or like Arrows or needn't be drawn at all. This indicator is not redrawing in sense that the ZigZag's last shoulder is formed right after the appropriate conditions occur on the market. The shoulder doesn't change its direction afterwards (can only continue). There are some other possibilities to show advanced information in this indicator: Auto Fibo on
This indicators automatically draws the Support and resistances levels for you once you've dropped it on a chart.  It reduces the hustle of drawing and redrawing these levels every time you analysis prices on a chart. With it, all you have to do is dropped it on a chart, adjust the settings to your liking and let the indicator do the rest.  But wait, it gets better; the indicator is absolutely free!  Get the new and improved version here:  https://youtu.be/rTxbPOBu3nY Parameters Time-frame  -> T
FREE
Fibonacci SR Indicator This indicator creates support and resistance lines. This indicator is based on Fibonacci Retracement and Extension levels. It will consider many combinations of the Fibonacci levels and draw support/resistance lines based on these. This indicator uses tops and bottoms drawn by the ZigZag indicator in its calculations. The ZigZag can also be drawn on the chart, if necessary. The indicator considers many combinations of past reversal points and Fibonacci ratio levels, and w
FREE
Tract
Andriy Sydoruk
Tract - Channel indicator, by which you can place orders like a classic channel indicator. Trading can be carried out inside the channel when the price reaches its borders and turns in the opposite direction from them. In such cases, reversal strategies are used. The channel indicator is designed to work with support and resistance levels and help traders find opportunities to enter the market. Another way to trade a breakout - assumes a situation when the price, upon reaching one or another cha
UPD1 Fibo Levels
Vitaliy Kuznetsov
5 (3)
L'indicateur analyse le nombre de bougies spécifié et construit des niveaux de Fibonacci basés sur le maximum-minimum. Comme les niveaux sont reconstruits, nous sommes intéressés par la partie droite de la fourchette. Le prix est magnétique par rapport aux niveaux et réagit à un contact. Utilisez cet outil pour trouver un point d'entrée dans la tendance après une correction. Si, à gauche, nous constatons que les niveaux sont parfaitement relevés, nous pouvons supposer que nous avons trouvé la f
FREE
MultiFiboDynamicMT4 is a powerful, professional indicator for estimating the most important support and resistance levels. The main advantage is that it plots the Fibonacci levels at all timeframes simultaneously, which allows the trader to see the full picture of the possible price movement of the trading instrument! Advantages of the indicator The indicator is perfect for scalping and trading binary options. Suitable for beginners and experienced traders. Works on all timeframes. Works on any
FREE
The indicator is designed for determining Fibonacci levels. Does not repaint/redraw The blue level shows the zero Fibonacci value (it is also the Pivot level) Red levels show calculated Fibonacci levels (used as a rollback or reversal point) Automatic period detection (periods can be entered manually) Adjustable display calculation method. Settings BarsHistory - the number of bars to be used to display the indicator. Method - method of calculation. AutoPeriod - automated period calculation (true
Cet indicateur fonctionne en conjonction avec la théorie des vagues d'Elliott de deux manières : Mode automatique : Dans ce mode, l'indicateur détectera automatiquement les cinq vagues motrices sur le graphique conformément à la théorie des vagues d'Elliott. Il fournira des prédictions et identifiera les zones potentielles de retournement. De plus, il a la capacité de générer des alertes et des messages push pour informer les traders des développements importants. Cette fonctionnalité automatiqu
Fibonacci Wave Bands Indicator The Fibonacci Wave Bands indicator utilizes Fibonacci ratios to create dynamic bands around a central moving average. These bands are derived from key Fibonacci ratios (typically 38.2%, 50%, 61.8%) and adapt to market volatility, offering insights into potential support and resistance zones. Key Features: Fibonacci Levels: The indicator plots multiple bands above and below a central moving average based on Fibonacci ratios. Dynamic Support and Resistance: Bands ser
Ratio market
Aleksandr Krokhalev
4.33 (15)
Volatility under control. The indicator shows the optimal depth for setting goals within the day and on the average trend. It also builds pivot zones for the estimated correction depth. As an accompaniment, the key levels of the structure are displayed for several timeframes. Classical volatility indicators ATR & ADX on fixed timeframes are used for calculation. The calculation takes into account the spread, and if the market is slightly volatile, you will see a warning about the risk. You can c
FREE
Offre spéciale : ALL TOOLS , seulement 35 $ chacun ! New tools   will be   $30   for the   first week   or the   first 3 purchases !  Trading Tools Channel on MQL5 : Join my MQL5 channel to update the latest news from me Dans un environnement de trading volatile, un outil d’analyse puissant et intuitif peut vous aider à saisir rapidement les opportunités. Fibonacci Trend Scanner intègre non seulement les fonctionnalités traditionnelles de l’indicateur Fibonacci et SuperTrend, mais étend égaleme
"The Squeeze indicator attempts to identify periods of consolidation in a market. In general the market is either in a period of quiet consolidation or vertical price discovery. By identifying these calm periods, we have a better opportunity of getting into trades with the potential for larger moves. Once a market enters into a "squeeze," we watch the overall market momentum to help forecast the market direction and await a release of market energy." The StdATR Squeeze Channel combines standard
DailyHit
Elisabet Corrales Rodriguez
Read carefully, because I’m about to sell my strategy based on over 11 years of study: This indicator plots multiple levels: thick and dotted, taking the ATR into account. On 90% of trading days, it touches one thick level and one dotted level. Levels are updated daily. If the price touches a thick level and a dotted level in a single day, trading for that day is over—you wait for the next day to look for the same setup. If the price comes very close to a level but doesn’t reach it, it’s likely
Channel FTF
Pavel Verveyko
The Envelopes indicator determines the presence of a trend or flat. It has 3 types of signals, shows the probable retracement levels and levels of the possible targets. The Fibonacci coefficients are used in the indicator's calculations. Signals (generated when touching the lines or rebounding from lines): Trend - the middle line of the Envelopes has a distinct inclination; the lines below the channel's middle line are used for buy trades, the lines above the middle line and the middle line itse
Fibonacci sequence is defined by integer sequence: 0, 1, 1, 2, 3, 5, 8, 13, 21, 34, 55, 89, 144, ... By definition, it starts from 0 and 1, the next number is calculated as a sum of two previous numbers. Instead of the standard moving average, the indicator uses the following calculation of average price: Bar0 + Bar1 + Bar2 + Bar3 + Bar5 + Bar8 + Bar13 + Bar21 + ... Input parameters FiboNumPeriod_1 - numbers in the following integer sequence for Fibo Moving Average 1. nAppliedPrice_1 - Close pr
Auto Fibo Retracement MT4
Nguyen Tuan Son
3.67 (3)
Auto Fibonacci Retracement Indicator — Flexible and Reliable This is not just another Auto Fibonacci Retracement indicator — it’s one of the most flexible and dependable tools available . If you find it useful, please leave a review or comment to support the project. Check out my other helpful tools below: Timeframes Trend Scanner    - Scan the trend of assets in difference timeframes with multiple indicators Market Trend Scanner   - Scan the trend of multiple-assets in with multiple indicators
FREE
This indicator filters the Zigzag indicator to calculate the main support and resistance levels. Variables minimum gap between peaks : is the distance (GAP) between the peaks of the Zigzag peaks sensitivity : Minimum number of nearby peaks look back: it means that it has to test the last 50 peaks in the Zigzag object name perfix: a prefix for level’s line name on chart
FREE
Voenix
Lorentzos Roussos
4.58 (12)
Motifs harmoniques , scanner et commerçant  Patrons inclus : Modèle ABCD Motif Gartley Motif chauve-souris Modèle de chiffrement Modèle 3Drives Motif cygne noir Motif cygne blanc Motif Quasimodo ou motif Over Under Modèle de chauve-souris alternative Motif papillon Motif de crabe profond Motif crabe Motif requin Motif FiveO Motif tête et épaules Motif triangle ascendant Modèle un deux trois Et 8 motifs personnalisés Voenix est un scanner de modèles harmoniques multi-périodes et multi-paires, pr
Auto Levels
Yaroslav Varankin
Auto Level this tool is able to determine the levels of support and resistance. search and display when the price has broken through the level and when it pushed off from it. the indicator can be useful if you use resistance support levels in your trading. or the highs and lows of the price, then it will greatly simplify your work and help you more quickly and more accurately determine the rebound or breakdown of the current trend or tendencies level. blue line bottom uptrend red line on top dow
Introduction Harmonic Patterns are best used to predict potential turning point. Traditionally, Harmonic Pattern was identified manually connecting peaks and troughs points in the chart. Manual harmonic pattern detection is painfully tedious and not suitable for everyone. You are often exposed under subjective pattern identification with manual pattern detection. To avoid these limitations, Harmonic Pattern Plus was designed to automate your harmonic pattern detection process. The functionality
Limit Levels AM
Andrii Matviievskyi
The presented indicator sets dynamic support/resistance levels on the price chart. The indicator is easy to use and can be useful for both beginners and professional traders. The middle line of the indicator (Central level) helps to identify the current trend: If the closing price is above the central line - the trend is ascending. If the closing price is below the central line - the trend is descending. The presented indicator allows implementing another version of the trading strategy, which w
The indicator detects important peaks and troughs (extremes) on the chart. These points can be used to plot support/resistance levels and trend lines, as well as any other graphical analysis. These points can serve as reference points for setting trading orders. The indicator does not redraw . Settings: Size_History  - the size of the calculated history. Num_Candles_Right  - number of candles to the right of the peak or trough. Num_Candles_Left  - number of candles to the left of the peak or
CONCEPT DE SWING TRADE À QUOI SERT-IL ? Indicateur MT4 conçu pour le swing trading. Il détecte les renversements de tendance à l'aide de la logique SuperTrend et affiche les points TP avec des niveaux de Fibonacci automatiques. COMMENT FONCTIONNE-T-IL ? 1. Suivi de tendance Utilise un algorithme SuperTrend basé sur l'ATR. Il signale lorsque la tendance des prix s'inverse. 2. Génération de signaux Renversement de tendance à la hausse → Boîte verte ACHETER + flèche (sous la bougie) R
"Adjustable Fractals Pro" - est une version avancée de l'indicateur fractal, un outil de trading très utile ! - Comme nous le savons, l'indicateur fractal standard mt4 n'a aucun paramètre - ce qui est très gênant pour les traders. - Adjustable Fractals Pro a résolu ce problème - il dispose de tous les paramètres nécessaires : - Période réglable de l'indicateur (valeurs recommandées - supérieures à 7). - Distance réglable par rapport aux hauts/bas du prix. - Conception réglable des flèches frac
Pivot levels Auto V1
Hafis Mohamed Yacine
What Is a Pivot Point? A pivot point is a technical analysis indicator, or calculations, used to determine the overall trend of the market over different time frames. The pivot point itself is simply the average of the intraday high and low, and the closing price from the previous trading day. On the subsequent day, trading above the pivot point is thought to indicate ongoing bullish sentiment, while trading below the pivot point indicates bearish sentimen How to Use Pivot Points The very ess
Elliott Wave Indicator Perfect for trading Stocks, Futures, Forex & Crypto The Elliott Wave Indicator Suite is designed around a simple but effective Swing Trading strategy. The Indicator Suite is great for Stocks, Futures and Forex trading on multiple time-frames. By subscribing to this indicator, you will get: Automatic Elliott Wave Count Elliott Wave Isolation High Probability Pull Back Zones Special 5-35 Oscillator 6/4 Moving Average High and Low's for trade entry and management Automate
It is a judgment tool that judges trends in 1 minute and supports discretionary trading. Various usages 1. It is used to recognize the environmental advantage of buying or selling with the color of the line. If the line is red, it is advantageous to buy. If it is blue, it is advantageous to sell. Neither if there is no line. 2. Used as a guide for entry by signing the entry.  Red arrow long Blue arrow short 3.Used as a guide for closing (Even if there is no entry sign, the close point will be s
NO REPAINT ADVANCED CHART PATTERN INDICATOR By definition, a price ( chart)  pattern is a recognizable configuration of price movement that is identified using a series of  trendlines  and/or curves. When a price pattern signals a change in trend direction, it is known as a reversal pattern; a continuation pattern occurs when the trend continues in its existing direction following a brief pause. Advanced Chart Pattern Tracker is designed to find the MOST ACCURATE patterns. A special script is a
Dynamic Levels
Svyatoslav Kucher
Dynamic Levels is a channel indicator of dynamic levels, designed for identification of the price extremums. It allows increasing the efficiency of any strategy due to advanced parameters, which in turn allow customizing it for personal trading style. Dynamic Levels does not change its values, it is suitable for any timeframe and currency pair. Indicator Parameters ChannelPeriod - period for the indicator calculation. ChannelSmoot - smoothing of values. ATRPeriod - volatility calculation period
Les acheteurs de ce produit ont également acheté
Gann Made Easy
Oleg Rodin
4.83 (153)
Gann Made Easy est un système de trading Forex professionnel et facile à utiliser qui est basé sur les meilleurs principes de trading en utilisant la théorie de mr. WD Gann. L'indicateur fournit des signaux d'ACHAT et de VENTE précis, y compris les niveaux Stop Loss et Take Profit. Vous pouvez échanger même en déplacement en utilisant les notifications PUSH. VEUILLEZ ME CONTACTER APRÈS L'ACHAT POUR OBTENIR DES CONSEILS DE TRADING, DES BONUS ET L'ASSISTANT EA GANN MADE EASY GRATUITEMENT! Vous ave
Pulse Scalping Line - an indicator for identifying potential pivot points. Based on this indicator, you can build an effective Martingale system. According to our statistics, the indicator gives a maximum of 4 erroneous pivot points in a series. On average, these are 2 pivot points. That is, the indicator shows a reversal, it is erroneous. This means that the second signal of the indicator will be highly accurate. Based on this information, you can build a trading system based on the Martingale
Volatility Trend System - un système de trading qui donne des signaux pour les entrées. Le système de volatilité donne des signaux linéaires et ponctuels dans le sens de la tendance, ainsi que des signaux pour en sortir, sans redessiner ni retarder. L'indicateur de tendance surveille la direction de la tendance à moyen terme, montre la direction et son changement. L'indicateur de signal est basé sur les changements de volatilité et montre les entrées sur le marché. L'indicateur est équipé de pl
First 25 copies at $80, after that price becomes $149 (3 copies left) Gold Signal Pro is a powerful MT4 indicator designed to help traders spot strong price reactions in the market. It focuses on clear wick rejections , showing when price strongly rejects a level and often continues in the same direction. Gold Signal Pro is mainly built for scalping gold (XAUUSD) and works best on lower timeframes like M5 and M15 , where timing matters most. That said, it can also be used on any forex pair, a
Actuellement 20% de réduction ! La meilleure solution pour tout débutant ou trader expert ! Ce logiciel de tableau de bord fonctionne sur 28 paires de devises. Il est basé sur 2 de nos principaux indicateurs (Advanced Currency Strength 28 et Advanced Currency Impulse). Il donne un excellent aperçu de l'ensemble du marché Forex. Il montre les valeurs de l'Advanced Currency Strength, la vitesse de mouvement des devises et les signaux pour 28 paires de devises dans tous les (9) délais. Imaginez
Apollo SR Master est un indicateur de support/résistance doté de fonctionnalités spéciales qui simplifient et fiabilisent le trading basé sur les zones de support/résistance. Cet indicateur calcule ces zones en temps réel, sans aucun décalage, en détectant les sommets et les creux locaux des prix. Pour confirmer la nouvelle zone de support/résistance, il affiche un signal spécifique indiquant que cette zone peut être prise en compte et utilisée comme un véritable signal d'achat ou de vente. Dans
Smc Blast Signal
Mohit Dhariwal
5 (3)
NEW YEAR 2026 SALE OFFER PRICE AT JUST 75 DOLLARS FEW COPIES ONLY AT This price From 28th Jan -31th Jan MIDNIGHT Final offer GRAB YOUR COPY ON THIS New Year EVE last offer GRAB IT! Prices will be increased to 150 after the offer period ends Full Fledged EA and Alert plus for alerts will also be provided in this offer along with the purchase of Indicator. Limited copies only at this price and Ea too. Grab your copy soon Alert plus for indicator with set file is kept in comment section with the im
M1 Sniper
Oleg Rodin
4.89 (18)
M1 SNIPER est un système d'indicateurs de trading facile à utiliser. Il s'agit d'un indicateur à flèche conçu pour l'unité de temps M1. Cet indicateur peut être utilisé seul pour le scalping sur l'unité de temps M1 ou intégré à votre système de trading existant. Bien que conçu spécifiquement pour le trading sur l'unité de temps M1, ce système peut également être utilisé avec d'autres unités de temps. Initialement, j'avais conçu cette méthode pour le trading du XAUUSD et du BTCUSD. Cependant, je
Game Changer Indicator
Vasiliy Strukov
4.25 (16)
Game Changer est un indicateur de tendance révolutionnaire, conçu pour être utilisé sur tout instrument financier et transformer votre MetaTrader en un puissant analyseur de tendances. L'indicateur ne se redessine pas et est sans latence. Il fonctionne sur n'importe quelle unité de temps et facilite l'identification des tendances, signale les retournements potentiels, agit comme un stop suiveur et fournit des alertes en temps réel pour une réaction rapide du marché. Que vous soyez un trader expé
Scalper Inside PRO
Alexey Minkov
4.74 (69)
An exclusive indicator that utilizes an innovative algorithm to swiftly and accurately determine the market trend. The indicator automatically calculates opening, closing, and profit levels, providing detailed trading statistics. With these features, you can choose the most appropriate trading instrument for the current market conditions. Additionally, you can easily integrate your own arrow indicators into Scalper Inside Pro to quickly evaluate their statistics and profitability. Scalper Inside
Trend indicator AI
Ramil Minniakhmetov
4.8 (79)
L'indicateur Trend Ai est un excellent outil qui améliorera l'analyse du marché d'un trader en combinant l'identification des tendances avec des points d'entrée exploitables et des alertes d'inversion. Cet indicateur permet aux utilisateurs de naviguer dans les complexités du marché forex avec confiance et précision Au-delà des signaux primaires, l'indicateur Trend Ai identifie les points d'entrée secondaires qui surviennent lors des retraits ou des retracements, permettant aux traders de capit
Atomic Analyst
Issam Kassas
5 (3)
Tout d'abord, il convient de souligner que cet indicateur de trading n'est ni repainting, ni redrawing et ne présente aucun délai, ce qui le rend idéal à la fois pour le trading manuel et automatisé. Manuel de l'utilisateur : réglages, entrées et stratégie. L'Analyste Atomique est un indicateur d'action sur les prix PA qui utilise la force et le momentum du prix pour trouver un meilleur avantage sur le marché. Équipé de filtres avancés qui aident à éliminer les bruits et les faux signaux, et à
Si vous achetez cet indicateur, vous recevrez mon Gestionnaire de Trading Professionnel   + EA  GRATUITEMENT. Tout d'abord, il convient de souligner que ce système de trading est un indicateur non repeint, non redessiné et non retardé, ce qui le rend idéal pour le trading manuel et automatisé. Cours en ligne, manuel et téléchargement de préréglages. Le "Système de Trading Smart Trend MT5" est une solution de trading complète conçue pour les traders débutants et expérimentés. Il combine plus de
GOLD Impulse with Alert
Bernhard Schweigert
4.64 (11)
Cet indicateur est une super combinaison de nos 2 produits Advanced Currency IMPULSE with ALERT  +   Currency Strength Exotics . Il fonctionne pour tous les cadres temporels et montre graphiquement l'impulsion de force ou de faiblesse pour les 8 principales devises plus un symbole ! Cet indicateur est spécialisé pour montrer l'accélération de la force des devises pour tout symbole comme l'or, les paires exotiques, les matières premières, les indices ou les contrats à terme. C'est le premier
Trend Screener
STE S.S.COMPANY
4.79 (95)
Indicateur de tendance, solution unique révolutionnaire pour le trading et le filtrage des tendances avec toutes les fonctionnalités de tendance importantes intégrées dans un seul outil ! Il s'agit d'un indicateur multi-période et multi-devises 100 % non repeint qui peut être utilisé sur tous les symboles/instruments : forex, matières premières, crypto-monnaies, indices et actions. OFFRE À DURÉE LIMITÉE : L'indicateur Support and Resistance Screener est disponible pour seulement 50 $ et à vie. (
Product Name:   Quantum Regime Indicator Short Description:   A multi-engine structural regime and volatility filter. Description: Quantum Regime Indicator (QRI) is a sophisticated technical analysis algorithm designed to identify market structure shifts and volatility regimes. Unlike standard indicators that rely on immediate price action, QRI utilizes a hierarchical logic architecture to filter market noise and identify statistical extremes. The indicator is built on the philosophy of "Market
Tout d'abord, il convient de souligner que cet outil de trading est un indicateur non repeint, non redessiné et non retardé, ce qui le rend idéal pour le trading professionnel. Cours en ligne, manuel utilisateur et démonstration. L'indicateur Smart Price Action Concepts est un outil très puissant à la fois pour les nouveaux et les traders expérimentés. Il regroupe plus de 20 indicateurs utiles en un seul, combinant des idées de trading avancées telles que l'analyse du trader Inner Circle et les
Currency Strength Wizard est un indicateur très puissant qui vous offre une solution tout-en-un pour un trading réussi. L'indicateur calcule la puissance de telle ou telle paire de devises en utilisant les données de toutes les devises sur plusieurs périodes. Ces données sont représentées sous la forme d'un indice de devise facile à utiliser et de lignes électriques de devise que vous pouvez utiliser pour voir la puissance de telle ou telle devise. Tout ce dont vous avez besoin est d'attacher l'
Indicateur Miraculous – Outil Forex et Binaire 100% Non-Repaint Basé sur le Carré de Neuf de Gann Cette vidéo présente l' Indicateur Miraculous , un outil de trading très précis et puissant, spécifiquement développé pour les traders du Forex et des Options Binaires . Ce qui rend cet indicateur unique est sa fondation sur le légendaire Carré de Neuf de Gann et la Loi de Vibration de Gann , en faisant l'un des outils de prévision les plus précis disponibles dans le trading moderne. L'Indicateur Mi
Currency Strength Exotics
Bernhard Schweigert
4.88 (33)
ACTUELLEMENT 20% DE RÉDUCTION ! La meilleure solution pour tout débutant ou trader expert ! Cet indicateur est spécialisé pour montrer la force de la devise pour tous les symboles comme les paires exotiques, les matières premières, les indices ou les contrats à terme. C'est le premier de son genre, n'importe quel symbole peut être ajouté à la 9ème ligne pour montrer la force réelle de la devise de l'or, l'argent, le pétrole, DAX, US30, MXN, TRY, CNH etc. Il s'agit d'un outil de trading unique
Indicateur à l'avance   Elle détermine les niveaux et les zones de retournement du marché , vous permettant d'attendre que le prix revienne au niveau et d'entrer au début d'une nouvelle tendance, et non à sa fin. Il montre   niveaux d'inversion   lorsque le marché confirme un changement de direction et amorce un mouvement plus marqué. L'indicateur fonctionne sans redessinage, est optimisé pour tous les instruments et révèle tout son potentiel lorsqu'il est associé à   TREND LINES PRO   indicat
Gold Scalper Super
Aleksandr Makarov
5 (1)
Gold Scalper Super is an easy-to-use trading system. The indicator can be used as a standalone scalping system on the M1 time frame, as well as part of your existing trading system. Bonus: when purchasing an indicator, Trend Arrow Super is provided free of charge, write to us after purchase. The indicator 100% does not repaint!!! If a signal appears, it does not disappear! Unlike indicators with redrawing, which lead to the loss of a deposit, because they can show a signal and then remove it.
Ce tableau de bord affiche les derniers modèles harmoniques disponibles pour les symboles sélectionnés, ce qui vous permettra de gagner du temps et d'être plus efficace / version MT5 . Indicateur gratuit: Basic Harmonic Pattern Colonnes de l'indicateur Symbol : les symboles sélectionnés apparaissent Trend : haussière ou baissière Pattern : type de motif (gartley, papillon, chauve-souris, crabe, requin, cypher ou ABCD) Entry: prix d'entrée SL: prix du stop loss TP1: 1er prix de prise de profi
Supreme Commander
Ramon Sobrevals Arce
4.13 (8)
The indicator of the indicators. The Most Powerful Technique to Determine Forex Trend Strength in 2023. We have perfected Supreme Commander that it calculates an average of the selected indicators (up to 16) and the selected timeframe (all) with the result of a single trend that indicates the potential of buying and selling.  It includes the following indicators: Accelerator/Decelerator oscillator Average Directional Movement Index Awesome oscillator; Bulls and Bears  Commodity Channel Index; De
Matrix Arrow Indicator MT4
Juvenille Emperor Limited
5 (3)
Matrix Arrow Indicator MT4 est une tendance unique 10 en 1 suivant un indicateur multi-période 100% non repeint qui peut être utilisé sur tous les symboles/instruments: forex, matières premières, crypto-monnaies, indices, actions.  Matrix Arrow Indicator MT4 déterminera la tendance actuelle à ses débuts, en rassemblant des informations et des données à partir d'un maximum de 10 indicateurs standard, qui sont: Indice de mouvement directionnel moyen (ADX) Indice de canal de matières premières (CC
Découvrez l'Indicateur d'Avion F-16, un outil de pointe pour MT4 conçu pour révolutionner votre expérience de trading. Inspiré par la vitesse et la précision inégalées de l'avion de chasse F-16, cet indicateur combine des algorithmes avancés et une technologie de pointe pour offrir des performances inégalées sur les marchés financiers. Avec l'Indicateur d'Avion F-16, vous surplomberez la concurrence car il fournit une analyse en temps réel et génère des signaux de trading hautement précis. Ses f
Volatility Master for MetaTrader is a real-time dashboard tool that scans up to 56 symbols using up to 2 flexible dashboards on different charts to identify high-volatility, trending markets instantly. With clear bullish/bearish signals, customizable alerts, and a user-friendly interface, it helps you avoid range-bound conditions and focus on high-probability trades. Clarity leads to confidence. Trade confidently and protect your capital effectively with this powerful dashboard. Setup & Guide: 
TPSpro RFI Levels
Roman Podpora
4.85 (27)
INSTRUCTIONS RUS  /  INSTRUCTIONS   ENG  /  Version MT5 Fonctions principales : Affiche les zones actives des vendeurs et des acheteurs ! L'indicateur affiche tous les niveaux/zones de première impulsion corrects pour les achats et les ventes. Lorsque ces niveaux/zones sont activés, là où commence la recherche de points d'entrée, ils changent de couleur et se remplissent de certaines couleurs. Des flèches apparaissent également pour une perception plus intuitive de la situation. LOGIC AI - Affi
Le système PRO Renko est un système de trading très précis spécialement conçu pour le trading de graphiques RENKO. Il s'agit d'un système universel qui peut être appliqué à divers instruments de négociation. Le système neutralise efficacement ce qu'on appelle le bruit du marché en vous donnant accès à des signaux d'inversion précis. L'indicateur est très facile à utiliser et n'a qu'un seul paramètre responsable de la génération du signal. Vous pouvez facilement adapter l'outil à n'importe que
FX Volume
Daniel Stein
4.63 (38)
FX Volume : Découvrez le Sentiment du Marché tel que perçu par un Courtier Présentation Rapide Vous souhaitez faire passer votre approche de trading au niveau supérieur ? FX Volume vous fournit, en temps réel, des informations sur la manière dont les traders particuliers et les courtiers sont positionnés—bien avant la publication de rapports retardés comme le COT. Que vous visiez des gains réguliers ou recherchiez simplement un avantage plus solide sur les marchés, FX Volume vous aide à repére
Plus de l'auteur
MultiOrderBlock
Kourosh Hossein Davallou
Order blocks are essential structures in trading that indicate areas where large institutional traders, like banks and hedge funds, have placed their orders. These blocks represent significant price levels where substantial buying or selling activity has occurred, providing clues about potential market movements. So, why should you, as a trader, care about order blocks? Well, knowing where these big orders are placed can give you a huge advantage. It’s like having a map showing where the treasur
Moving Average RAINBOW
Kourosh Hossein Davallou
4 (3)
Moving Average RAINBOW Forex traders use moving averages for different reasons. Some use them as their primary analytical tool, while others simply use them as a confidence builder to back up their investment decisions. In this section, we'll present a few different types of strategies - incorporating them into your trading style is up to you! A technique used in technical analysis to identify changing trends. It is created by placing a large number of moving averages onto the same chart. When a
FREE
RenkoVP
Kourosh Hossein Davallou
Overview RenkoVP is a professional tool for price structure analysis that runs fully online on the main chart. Unlike many other Renko indicators, it requires no offline charts. The indicator combines Renko bricks, volume profile, dynamic Fibonacci levels, and automatic pattern recognition to help traders identify trends, key zones, and precise entry/exit points. Renko Bricks Configuration The indicator offers both manual and automatic brick configuration: No offline chart required - runs direc
Stochastic RainBow 5
Kourosh Hossein Davallou
3 (1)
A   stochastic   oscillator is a momentum indicator comparing a particular closing price of a security to a range of its prices over a certain period of time. The sensitivity of the oscillator to market movements is reducible by adjusting that time period or by taking a moving average of the result. It is used to generate overbought and oversold trading signals, utilizing a 0-100 bounded range of values. This indicator  show 8 stochastic on one chart.
FREE
DualVWAP
Kourosh Hossein Davallou
Dual Timeframe VWAP Indicator for MT4  Description Professional VWAP indicator that displays both **Daily** and **Weekly** VWAP simultaneously on your chart.   Features: - Dual VWAP Lines: Blue for Daily, Red for Weekly - Configurable Bands: Two deviation bands for each timeframe - Session Control: Customizable trading hours for Daily VWAP - Clean Visuals: Solid lines for main VWAP, dashed for bands - Optimizable: Parameters can be optimized using Genetic Algorithm Key Settings: - Enable/di
StochasticRainBow
Kourosh Hossein Davallou
5 (2)
A stochastic oscillator is a momentum indicator comparing a particular closing price of a security to a range of its prices over a certain period of time. The sensitivity of the oscillator to market movements is reducible by adjusting that time period or by taking a moving average of the result. It is used to generate overbought and oversold trading signals, utilizing a 0-100 bounded range of values. This indicator  show 15 stochastic on one chart.
FREE
Iranian stock market
Kourosh Hossein Davallou
5 (1)
Smart money is a powerful currency. This money is available to major investors who can identify, predict or even generate capital movements ahead of others. This money can flow into financial and capital markets and create dramatic price changes in various stocks. Therefore, detecting smart cash flow, which usually enters the market in a coherent manner and confronts the volume and value of transactions in a market with high returns, is one of the methods that some investors use to invest. But h
FREE
Price Ladder
Kourosh Hossein Davallou
This indicator is based on the Channel . Input Parameters channel_One- show trend line One on or off. timeFrame_One - time Frame of channel One . ColorChannel_One - color of  trend line One. channel_Two- show trend line Two on or off. timeFrame_Two - time Frame of channel Two . ColorChannel_Two - color of  trend line Two. channel_Three- show trend line Three on or off. timeFrame_Three - time Frame of channel Three . ColorChannel_Three - color of  trend line three. channel_Four- show trend line F
FREE
MarketSession
Kourosh Hossein Davallou
The 24-hour forex (FX) market offers a considerable advantage for many institutional and individual traders because it guarantees liquidity and the opportunity to trade at any conceivable time. Currencies can be traded anytime but an individual trader can only monitor a position for so long, however. Most traders can't watch the market 24/7 so they're bound to miss opportunities or worse. A jump in volatility can lead to a movement against an established position when the trader isn't around. A
FREE
Display Multipair
Kourosh Hossein Davallou
This is an indicator that allows displaying three currency pairs in one window. Input Parameters: Symbol1 - first currency pair. symbol1mirrior - mirror display of the first currency pair. s1color - color of the first currency pair. Symbol2 - second currency pair. symbol2mirrior - mirror display of the second currency pair. Symbol3  - third currency pair. symbol3mirrior -  mirror display of the third currency pair. Symbo4  - fourth currency pair. symbol4mirrior - mirror display of the fourth cur
Price Aleart
Kourosh Hossein Davallou
Price Alert indicator plays sound alerts when the price reaches certain levels that are set by the trader. If you use e-mail alert feature, don't forget to set the e-mail settings in your MetaTrader platform options window.   Input parameters: WhenPriceGoesAbovePIP - if the price exceeds the current one by a specified amount of Pips, the alert will be triggered. WhenPriceGoesBelowPIP - if the price goes below the current one by a specified amount of Pips, the alert will be triggered. WhenPriceIs
Daily GBPUSD trade
Kourosh Hossein Davallou
Our strategy relies on a choppy movement on most Forex pairs during the Asian session. Most traders in London sleep when the Sun shines over the Pacific and this results to a very slow movement of GBPUSD pair between 9:00 PM GMT and 7:00 AM GMT. Buy order: Place a buy-stop order just five  pip above the upper band. Place a stop loss just one pip below the lower band. Place a profit target at the upper LawnGreen Arrow. Sell order: Place a sell-stop order just five pip below the lower band. Place
Breakout trade
Kourosh Hossein Davallou
Breakout System  This indicator is based on the trend line and breakthrough. Pair: EURUSD, GBPUSD. Timeframe: M15 Or H1. Input Parameters AlertsOn - alert on or off. TrendLine - show trend line. TrendLineStyle - style of trend line. UpTrendColor - color of up trend. DownTrendColor - color of down trend. ShowTakeprofit - show take profits. ShowTakeprofitStyle - style of take profit. UpperTakeprofitColor - color of up take profit. LowerTakeprofitColor - color of down take profit.
Week Pivot
Kourosh Hossein Davallou
Weekly Pivot  There are a lot of advantages when trading with support and resistance lines, and they should be a staple in every trader's arsenal. Another effective method of deriving multiple horizontal based support and resistance lines is using a formula derived from yesterday's High, Low and Close bar. The formula maps out pivot point levels consisting of the pivot, and three levels of support and resistance, and these levels can be traded much the same way as trading with the regular suppor
Forex Tools X
Kourosh Hossein Davallou
The indicator is based on several useful indicators in the multi time frames that help us chart and table and alert.   The various parameters used in this indicator and the default ones are as follows. ·    Moving Average Mode:    LMMA ·        Moving Average Period One:     4 ·        Moving Average Period Two:     8 ·        Moving Average Period Three:  15 ·        Moving Average Period Four:    30 ·        Moving Average Period Five:     80 ·        Moving Average Period Six:      150 ·    
Only NonFarm Payroll Trade 4
Kourosh Hossein Davallou
Only NonFarm Payroll Trade  The employment situation is a set of labor market indicators. The unemployment rate measures the number of unemployed as a percentage of the labor force. Non-farm payroll employment counts the number of paid employees working part-time or full-time in the nation's business and government establishments. The average workweek reflects the number of hours worked in the non-farm sector. Average hourly earnings reveal the basic hourly rate for major industries as indicated
Daily GBP expert
Kourosh Hossein Davallou
Daily GBPUSD trade  Our strategy relies on a choppy movement on most Forex pairs during the Asian session. Most traders in London sleep when the Sun shines over the Pacific and this results to a very slow movement of GBPUSD pair between 9:00 PM GMT and 7:00 AM GMT. Input Parameters: Auto GMT shift extern int Broker_GMT_Shift = 0;//Manual Broker GMT shift extern int London_Night = 21; //London Night extern int London_Open = 7; //London Open
CurrencyMeter
Kourosh Hossein Davallou
Currency Meter   When trading Forex, we trade a pair of currencies at time. For example EUR/USD. If we are long on the EUR/USD it means that we expect the EUR to gain in strength relative to the USD. If we are short on the EUR/USD it means that we expect the EUR to weaken relative to the USD. You should be all familiar with this concept. The key thing about pairs though is that they just indicate the strength of one currency  relative to another. If we see the EUR/USD going up, is it because the
Three Channel
Kourosh Hossein Davallou
5 (1)
The Price Channel pattern trading strategy is one of the smartest ways to make money trading. The Price Channel pattern represents two trend lines positioned above (channel resistance) and below (channel support) the price. The price action is contained between these two parallel trendlines. The separation between the two trendlines needs to be wide enough if you want to trade inside the Price Channel Pattern. If this is the case, you can buy at the channel support level and sell at the channel
Multi Andrew PitchFork
Kourosh Hossein Davallou
5 (1)
ANDREW’S PITCHFORK TRADING STRATEGY       Essentially, Andrew’s Pitchfork is a tool for drawing price channels. While two lines surrounding price are usually enough to draw a channel, the Pitchfork has an extra line. It is the median line or the handle of the Pitchfork.     The median line is central to this trading method. This is why Andrew’s Pitchfork is also known as the Median Line Method. TRADING RULES      There are many ways to trade using Andrew’s Pitchfork but the basic idea is that pr
PriceActionDetector
Kourosh Hossein Davallou
Price Action translates as "price movement." Proponents of technical analysis believe that the price takes into account everything that happens on the market. Therefore, indicators and advisers are not needed, since they are calculated based on historical price data and can be very late. By the time the indicator signal triggers, the price direction may already have changed. Those indicators that are trying to predict the price direction are often redrawn. All this leads to unnecessary losses.
Visual Trading
Kourosh Hossein Davallou
With this tool you can easily draw lines on the chart and the trade is done easily. The steps are as follows: First: Draw the buy and sell lines on the chart. Second: Draw the profit and loss lines on the chart. Third: Specify the volume of the transaction you want to trade. Fourth: Activate the lines. Warning When moving lines, be careful not to make a wrong trade. Expert easily trades you. 
Multi Fair Value Gap
Kourosh Hossein Davallou
**Added to the Original Text:**   This indicator (Fair Value Gap - FVG) also **has the capability** to display **multiple timeframes** of your choice **simultaneously on a single chart**. This feature allows you to identify **stronger and more accurate signals**, as you can analyze price discrepancies (Gaps) across higher or lower timeframes, helping you make smarter trading decisions.   For example, if you spot a bullish FVG on the **1-hour timeframe** and it is also confirmed on the **4-hour
Multi OrderBlock
Kourosh Hossein Davallou
5 (1)
Order blocks are essential structures in trading that indicate areas where large institutional traders, like banks and hedge funds, have placed their orders. These blocks represent significant price levels where substantial buying or selling activity has occurred, providing clues about potential market movements. So, why should you, as a trader, care about order blocks? Well, knowing where these big orders are placed can give you a huge advantage. It’s like having a map showing where the treasur
Pattern Searching
Kourosh Hossein Davallou
Pattern Searching: Smart, Precise, & Customizable for MT4!  Are you looking for a powerful tool to quickly and accurately identify trading patterns in Forex? This advanced indicator for MetaTrader 4 (MT4) is exactly what you need!  Key Features That Will Amaze You:  Automatic Classic Pattern Detection: This indicator automatically finds the closest classic Forex patterns for you. Whether you're looking for Smart Money Concepts (SMC) or NDS strategies, this tool covers it all!   * Popular patt
Harmonic Price Patterns
Kourosh Hossein Davallou
Harmonic Price Patterns Indicator This indicator has the capability to manually display the closest harmonic pattern to you. It allows you to easily adjust its parameters and create your own custom harmonic pattern, while also displaying the price distance between each point. Key Features of the Manual Harmonic Pattern Indicator Harmonic Pattern Identification Detects popular harmonic patterns such as ABCD, Gartley, Bat, Butterfly, Crab, and Shark. Displays patterns automatically or semi-automat
MasterVolume Pro
Kourosh Hossein Davallou
Description: Elevate your chart analysis with this advanced indicator that seamlessly integrates Zigzag structures, Fibonacci retracements, and Volume Profile insights. Designed for traders who seek clarity and precision, this tool visually identifies high-probability price patterns and market turning points. Whether you're tracking CHOCH shifts, pinpointing POIs, or analyzing TRIPLE tops and FLAG formations, this indicator offers the depth and flexibility to adapt to any trading strategy.   C
RenkoPointFigure
Kourosh Hossein Davallou
Advanced Renko & Point & Figure Indicator with Win/Loss Pattern Analysis This powerful indicator combines two proven strategies—Renko and Point & Figure (P&F)—into one comprehensive tool for trend identification, pattern recognition, and risk management. With dynamic Box Size calculation (Fixed or ATR-based), moving average filters, and win/loss pattern detection, traders can make smarter, data-driven decisions. Key Features   Hybrid Renko + P&F System Renko: Noise-free price action with fixed
On Click Trade
Kourosh Hossein Davallou
This is an Expert Advisor that allows opening and modifying positions and orders via mouse (with Stop Loss, Take Profit). Working with this Expert Advisor requires setting lot size, take profit and stop loss for positions. For pending orders you need to set lot size, take profit, stop loss and distance (pip). This Expert Advisor has only one input parameter - background color.
Three Channel 5
Kourosh Hossein Davallou
The Price Channel pattern trading strategy is one of the smartest ways to make money trading. The Price Channel pattern represents two trend lines positioned above (channel resistance) and below (channel support) the price. The price action is contained between these two parallel trendlines. The separation between the two trendlines needs to be wide enough if you want to trade inside the Price Channel Pattern. If this is the case, you can buy at the channel support level and sell at the channel
Filtrer:
pandiras
149
pandiras 2019.01.13 14:53 
 

L'utilisateur n'a laissé aucun commentaire sur la note

sunnychow
9048
sunnychow 2019.01.09 16:53 
 

L'utilisateur n'a laissé aucun commentaire sur la note

Répondre à l'avis