Execution Cost Analyzer
- Utilitaires
- Version: 1.0
- Activations: 10

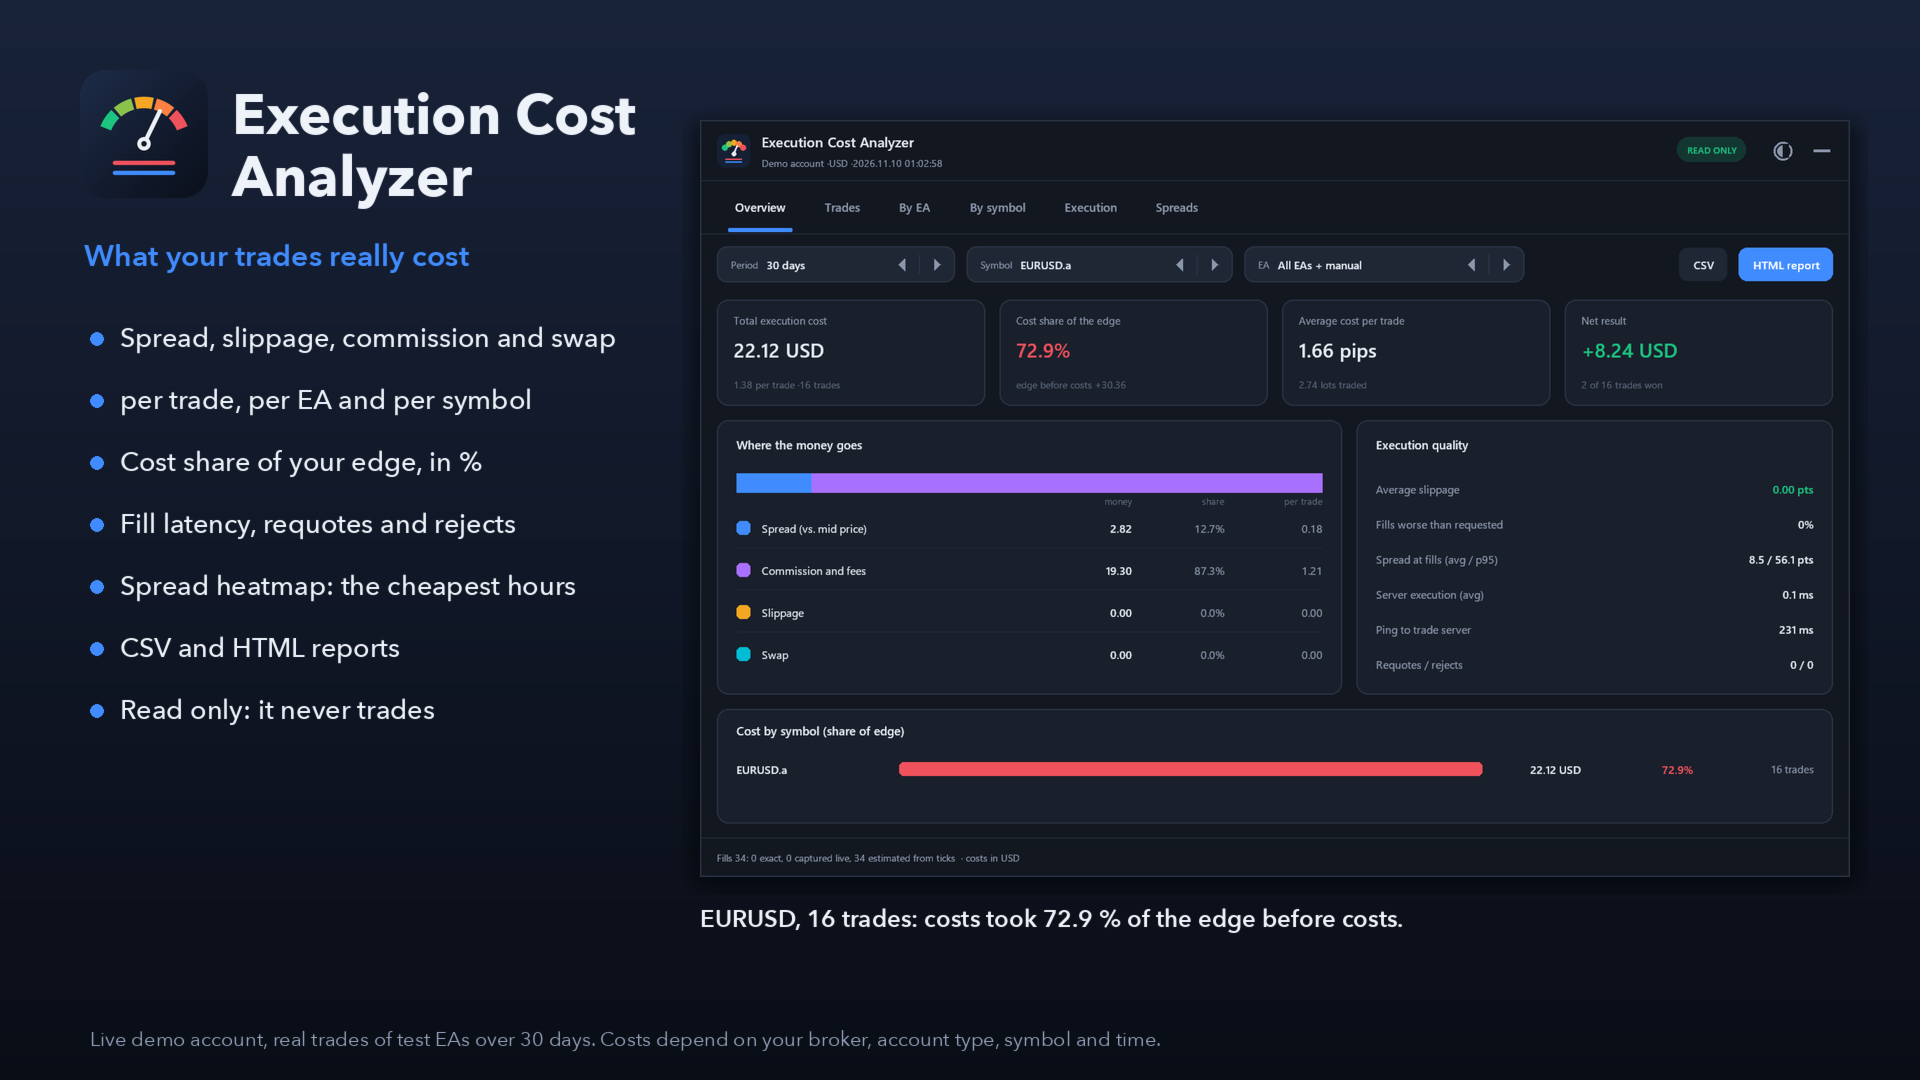
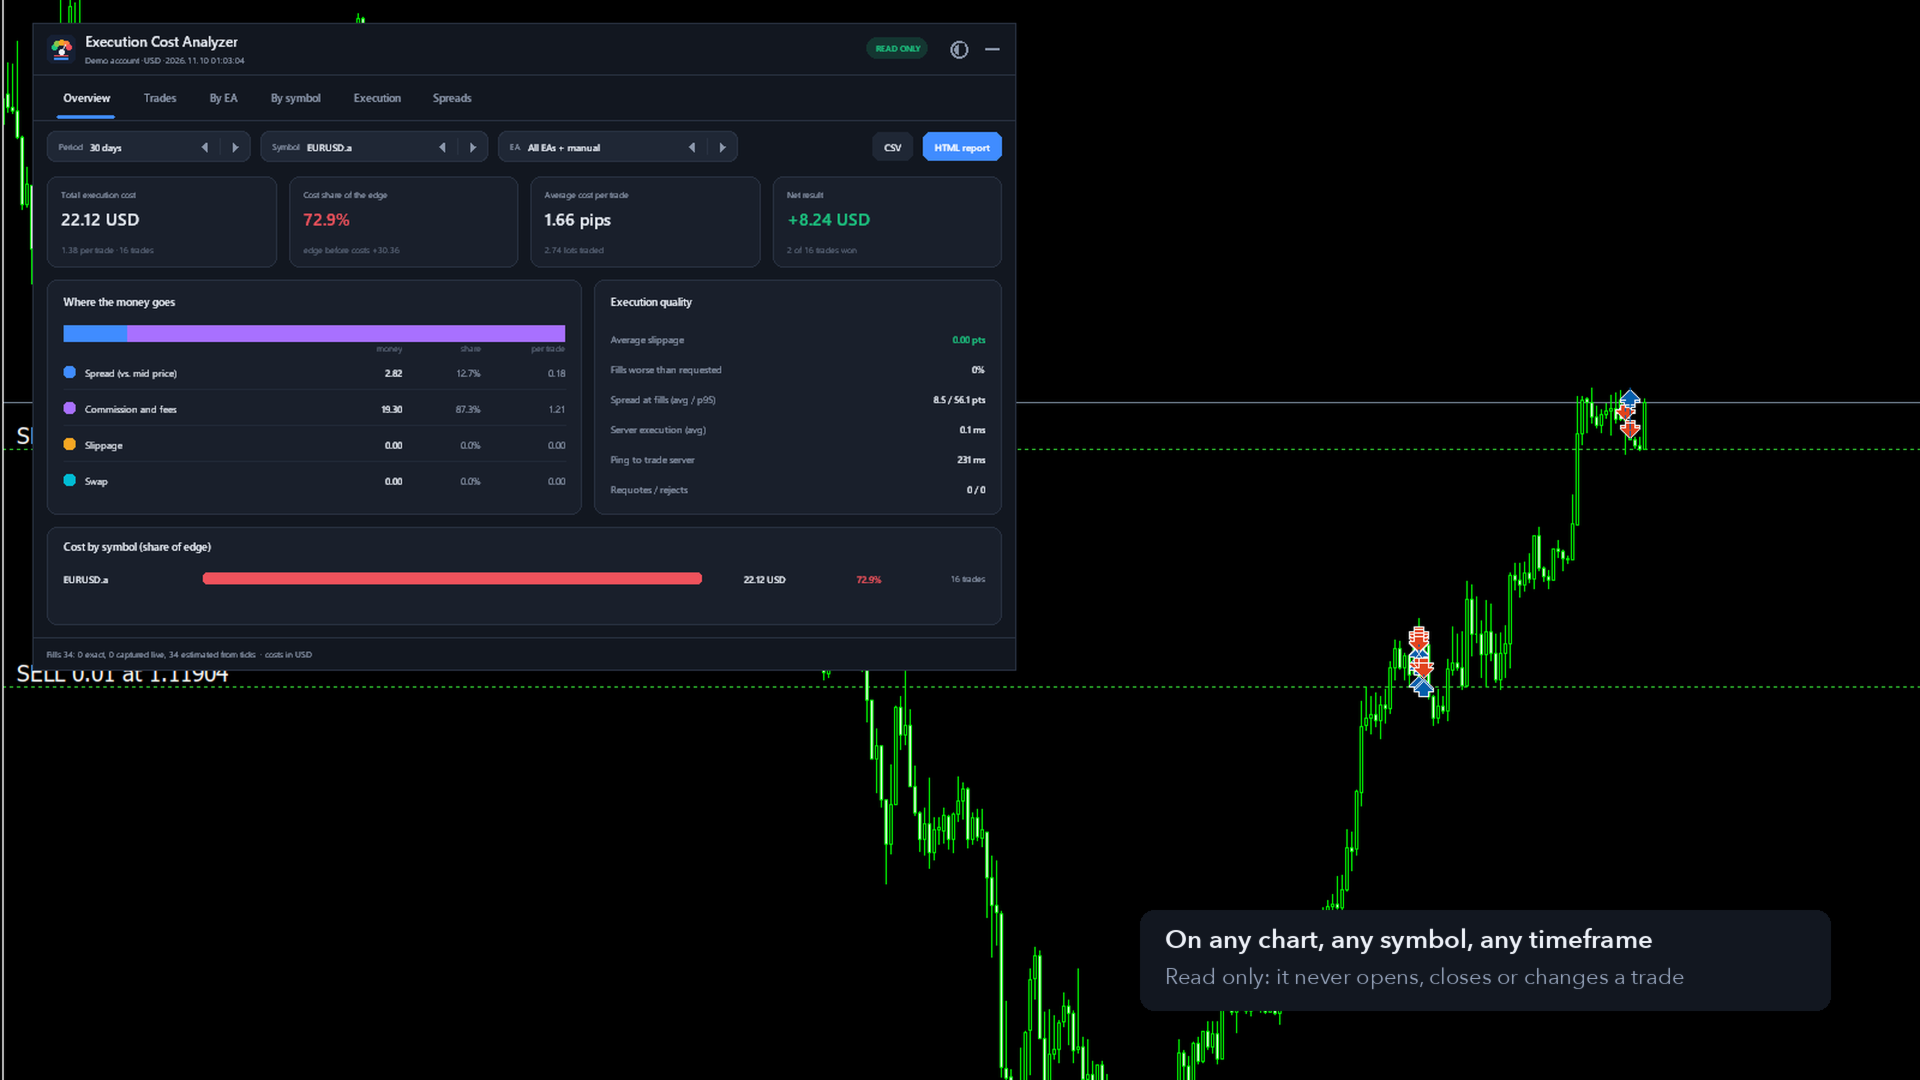
Execution Cost Analyzer shows what your trades really cost and how your account executes them. Attach it to any chart: it reads the deal history of the account and breaks every closed trade into spread, slippage, commission and swap. It then shows, per EA and per symbol, how much of the edge went to costs. While it runs it also records the spread of your symbols every second, so you can see which hours are cheapest to trade.
Read only. It never opens, closes or changes an order. No DLL, no WebRequest, nothing is sent anywhere. It works with manual trading and with any EA (no source code needed), on any symbol and timeframe, on hedging and netting accounts.
Cost of every trade
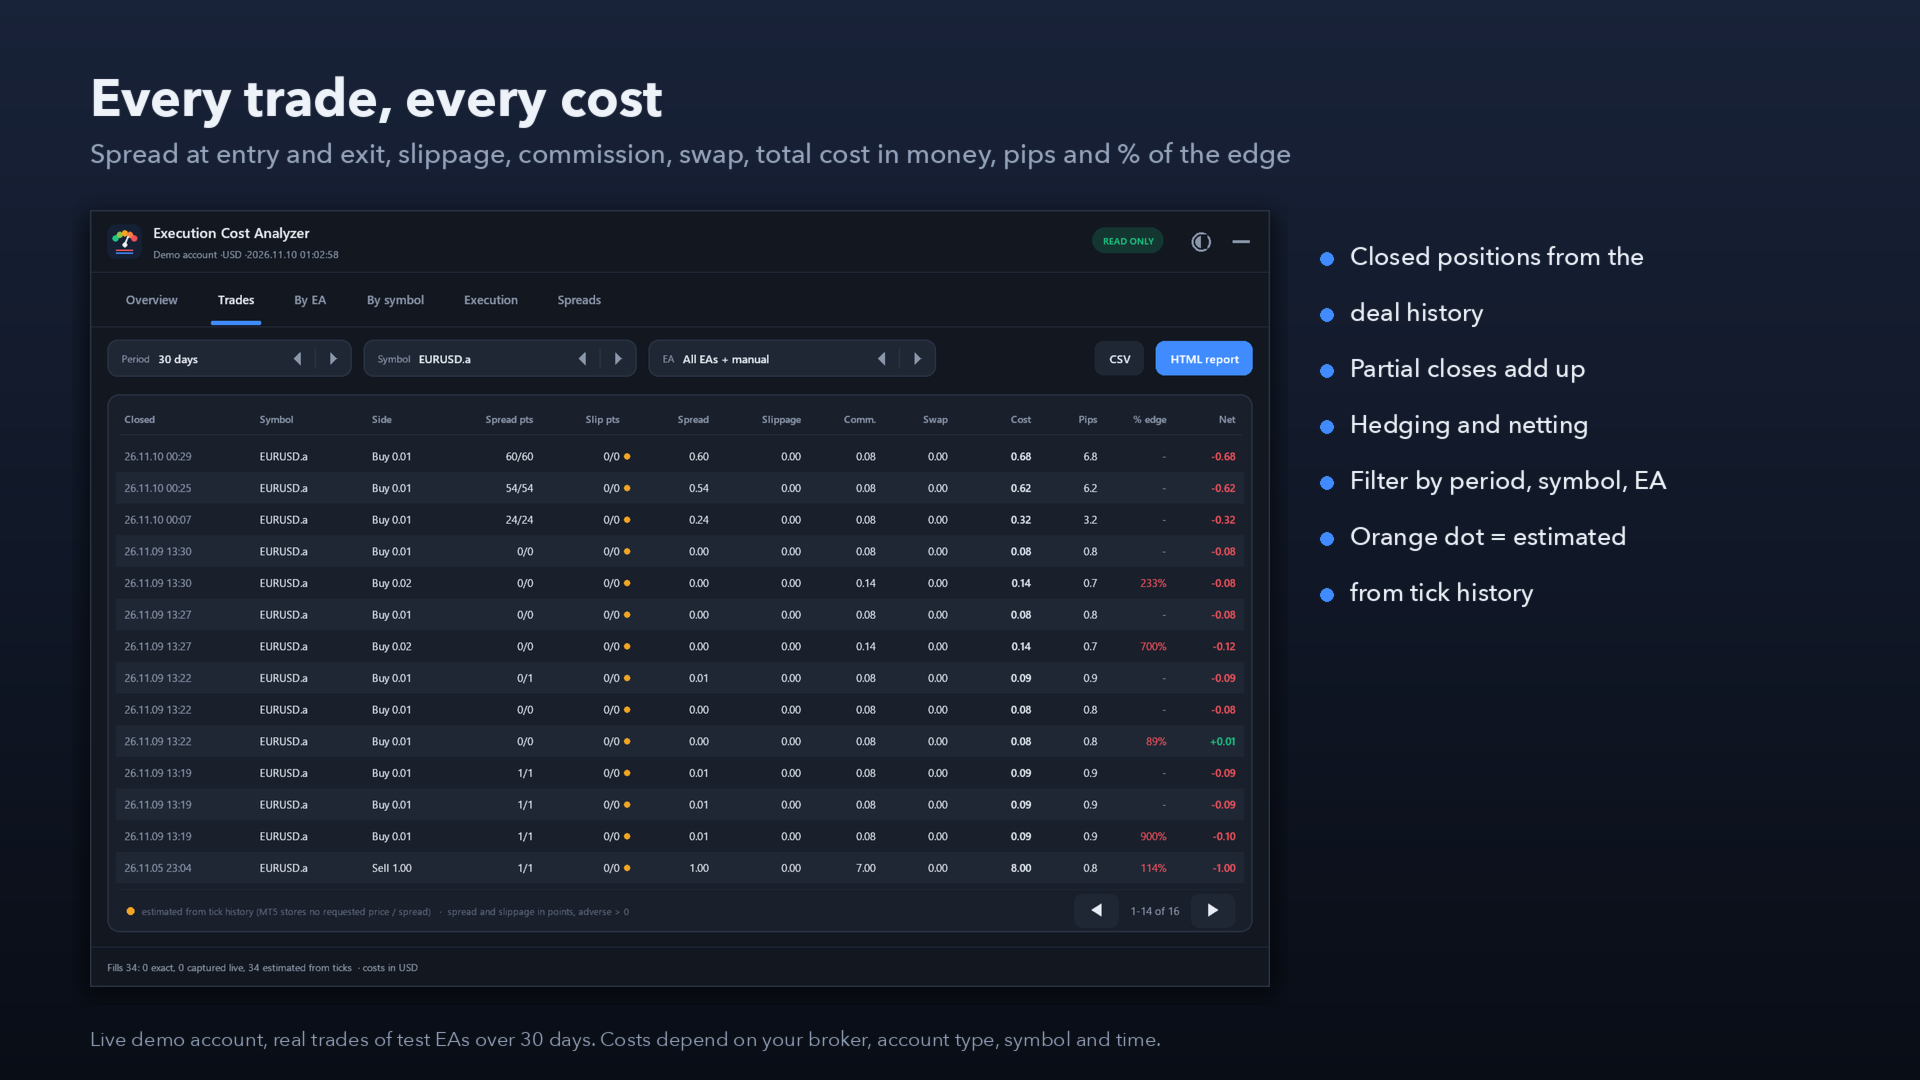
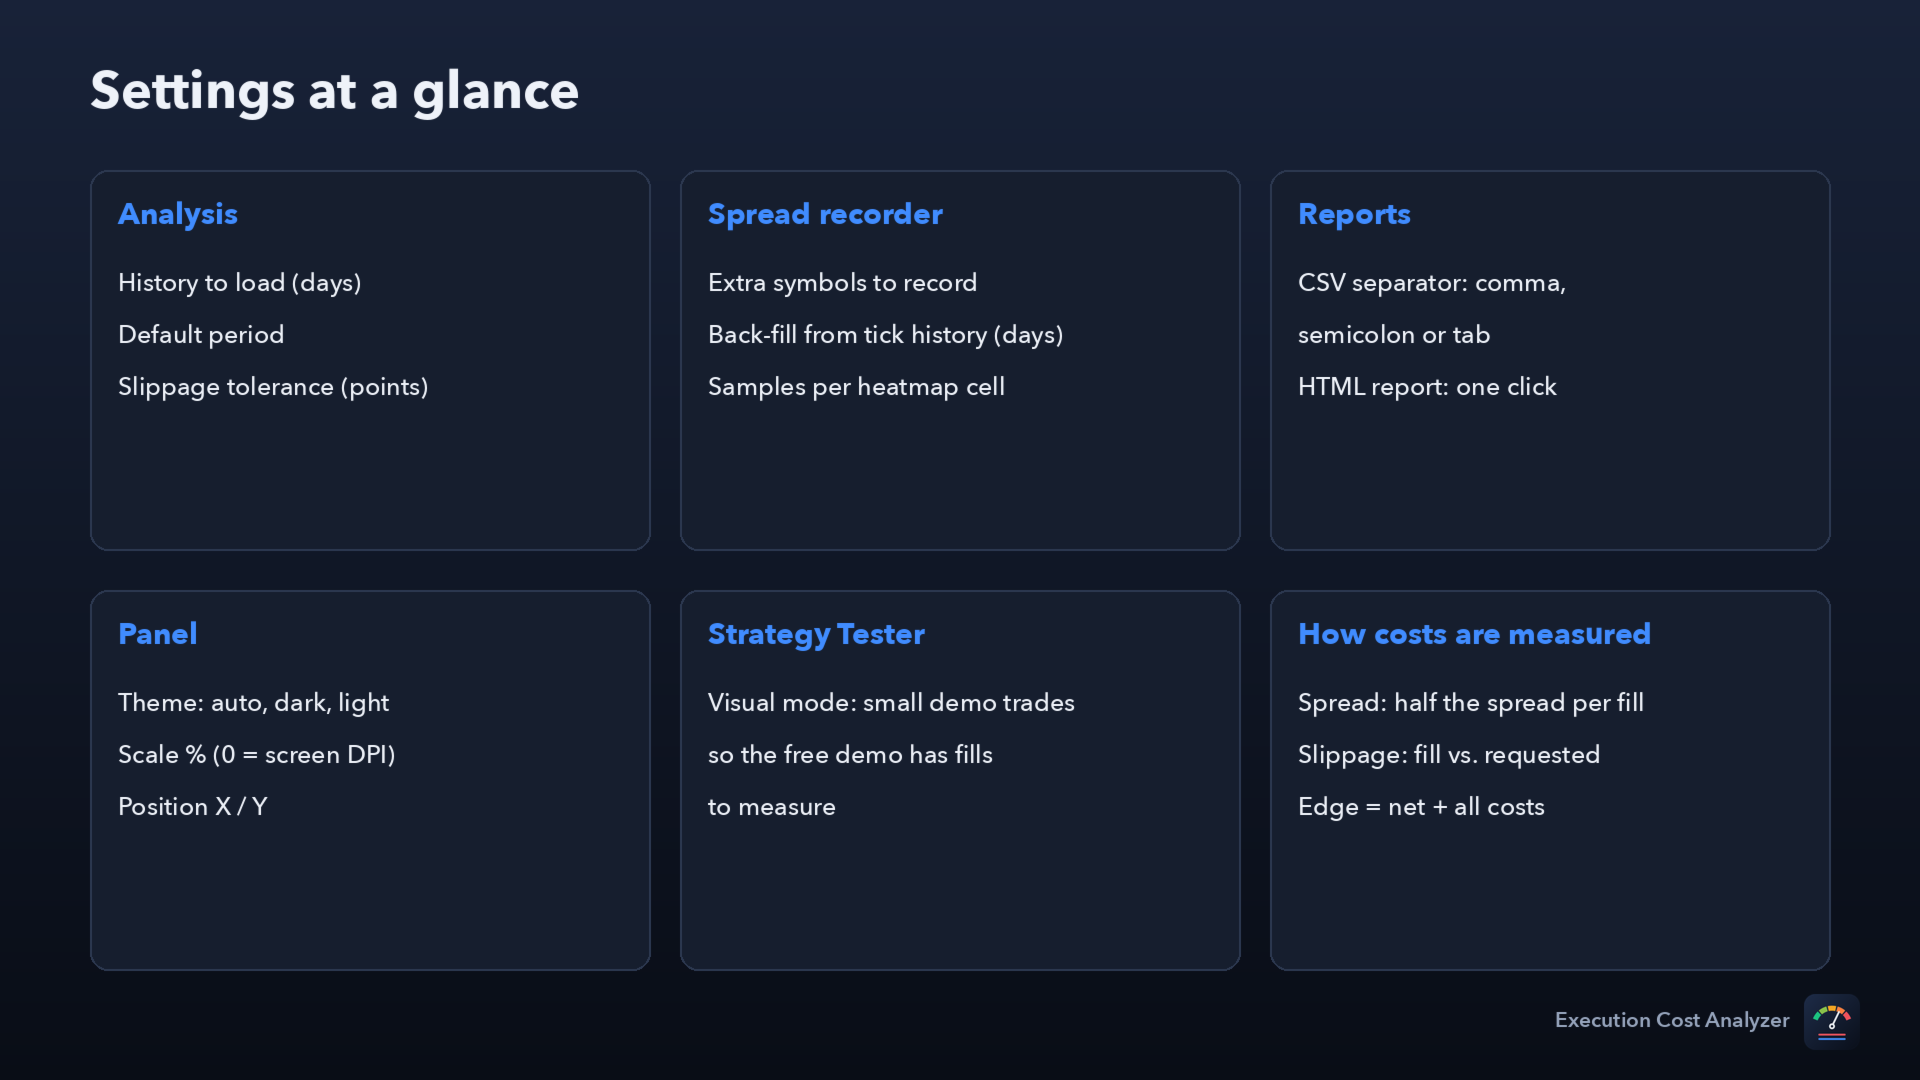
- Spread at entry and exit in points, and its cost in money (half the spread on each fill, measured against the mid price).
- Slippage: the fill price against the requested price, in points and money. Positive = worse for you, negative = price improvement.
- Commission and fees and swap from the deals.
- Total cost in money and in pips, and as a % of the trade's result before costs.
- Closed positions are rebuilt from the deals, so partial closes add up correctly.
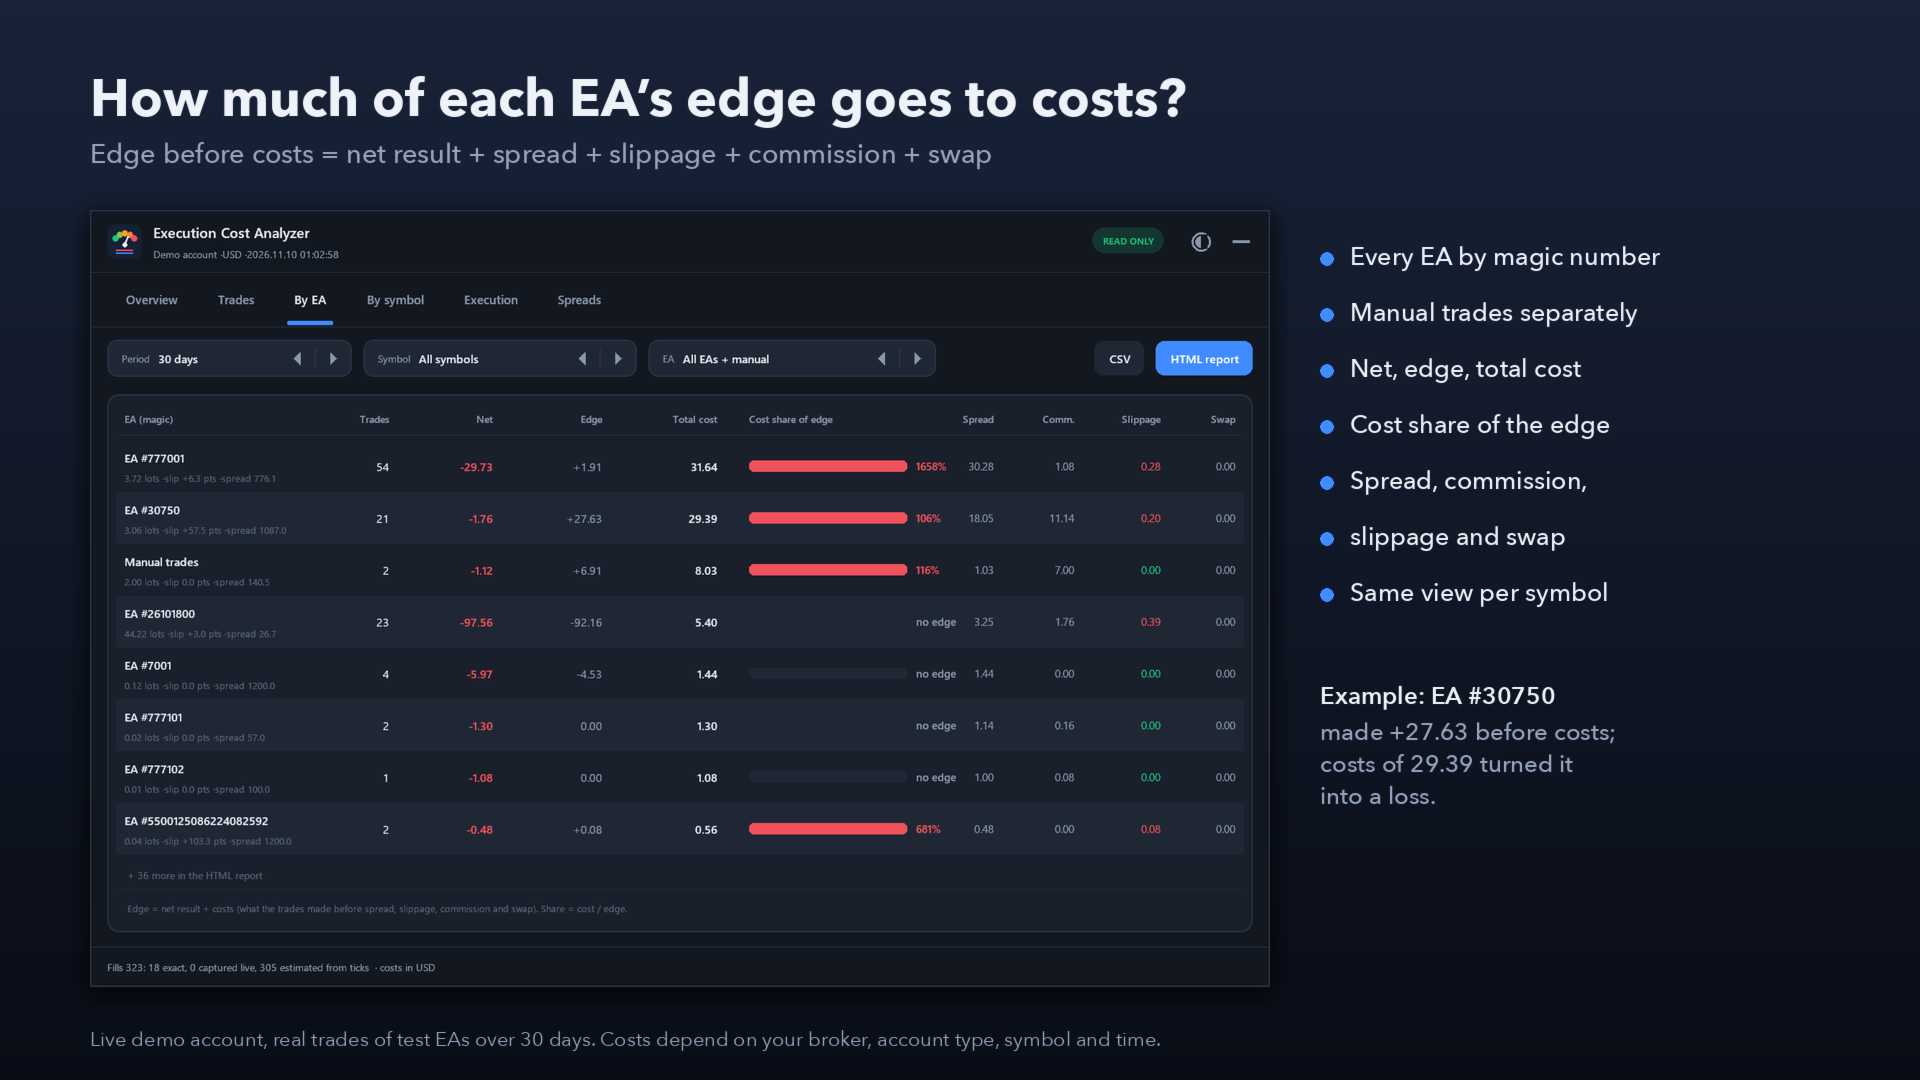
How much of the edge goes to costs
- Edge before costs = net result + spread + slippage + commission + swap: what the trades would have made at the mid price with perfect fills.
- Cost share of the edge per EA (magic number), for manual trades and per symbol. A share above 100 % means costs turned a winning idea into a loss.
- Totals per component (spread, commission, slippage, swap), per trade and per lot.
Execution quality
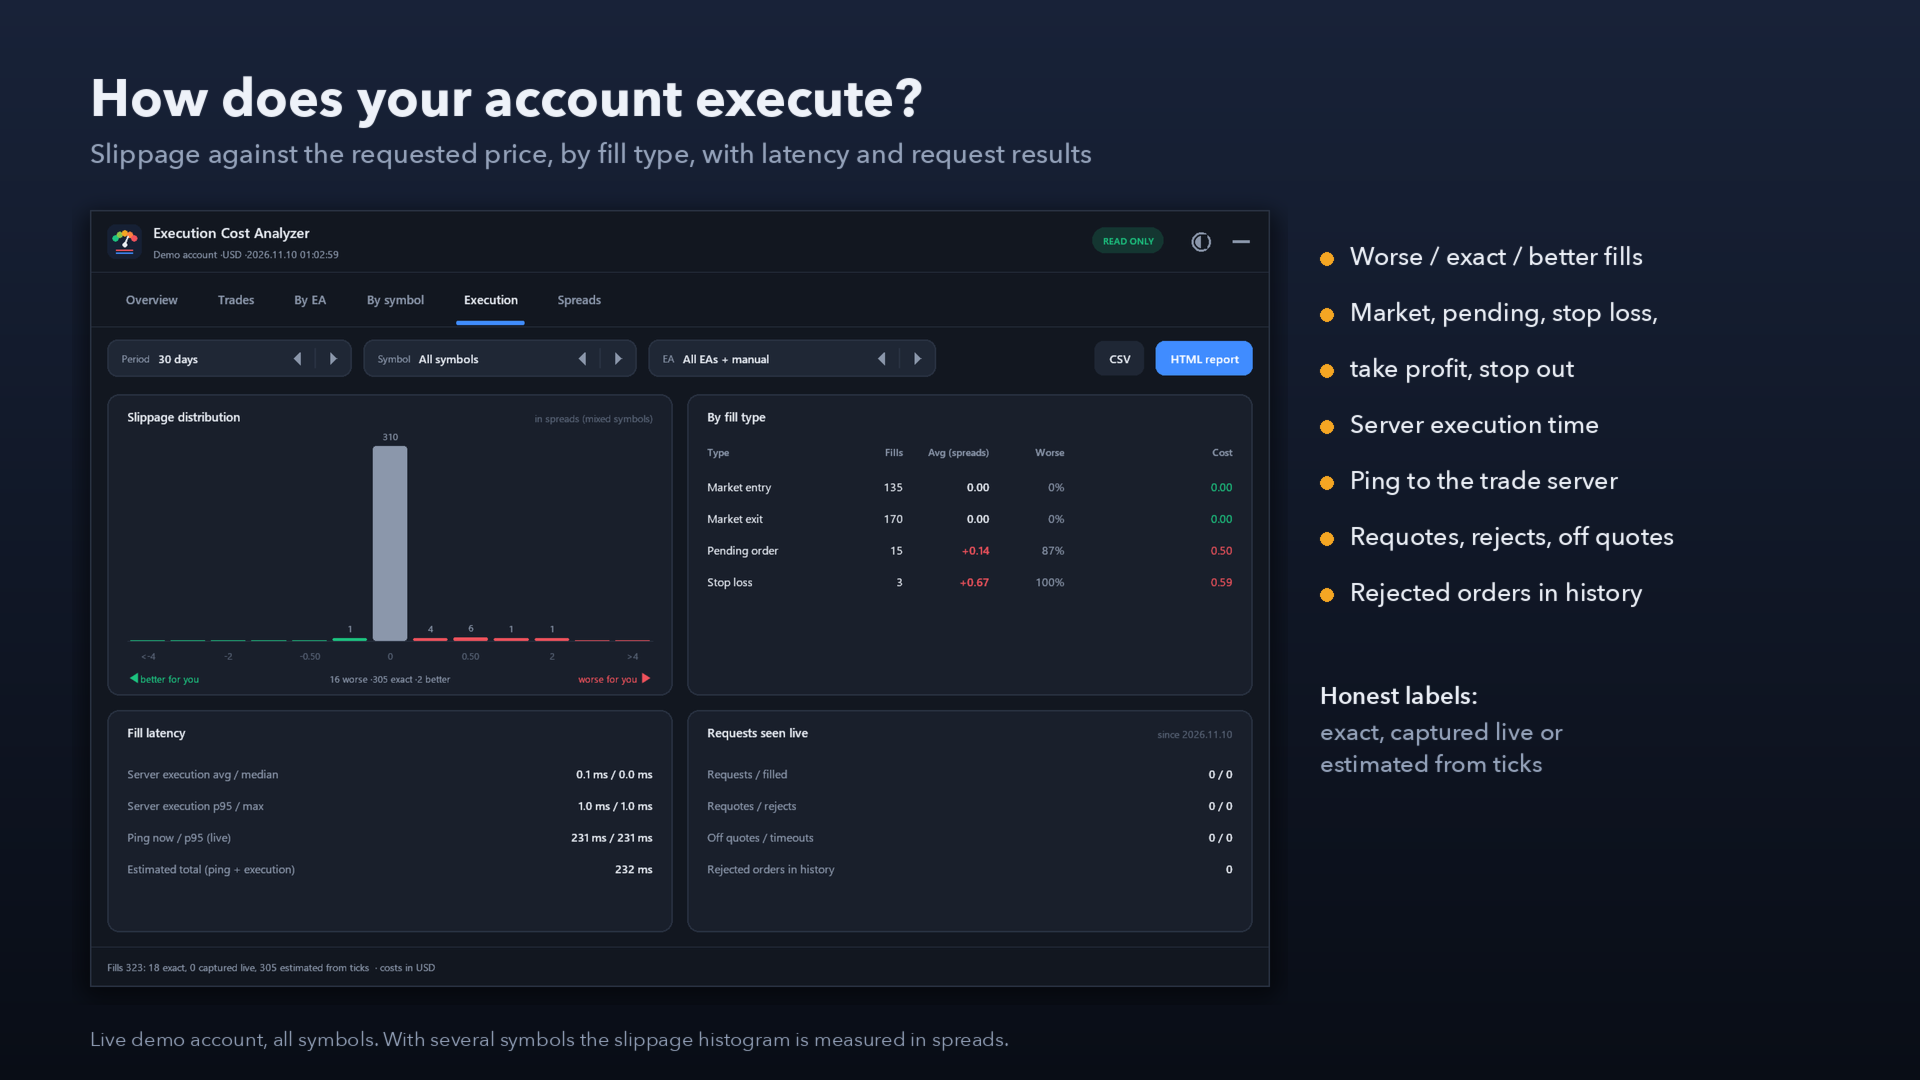
- Slippage distribution: worse, exact and better fills, in points (one symbol) or in spreads (several symbols).
- By fill type: market entry, market exit, pending order, stop loss, take profit, stop out. Fills, average, share of worse fills, worst fill, money.
- Fill latency: server execution time (order accepted by the server to deal, from the millisecond timestamps of market orders), ping to the trade server while it runs, and the estimated total.
- Requotes, rejects, off quotes and timeouts of every trade request the terminal processes while the analyzer runs (from any EA or by hand), plus rejected orders found in the history.
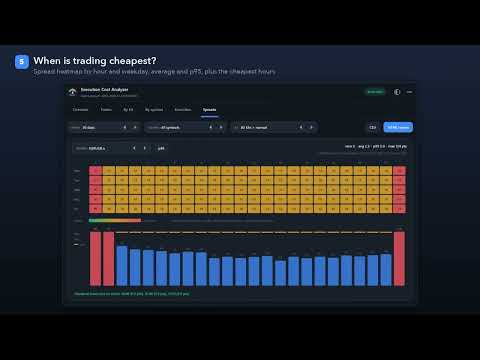
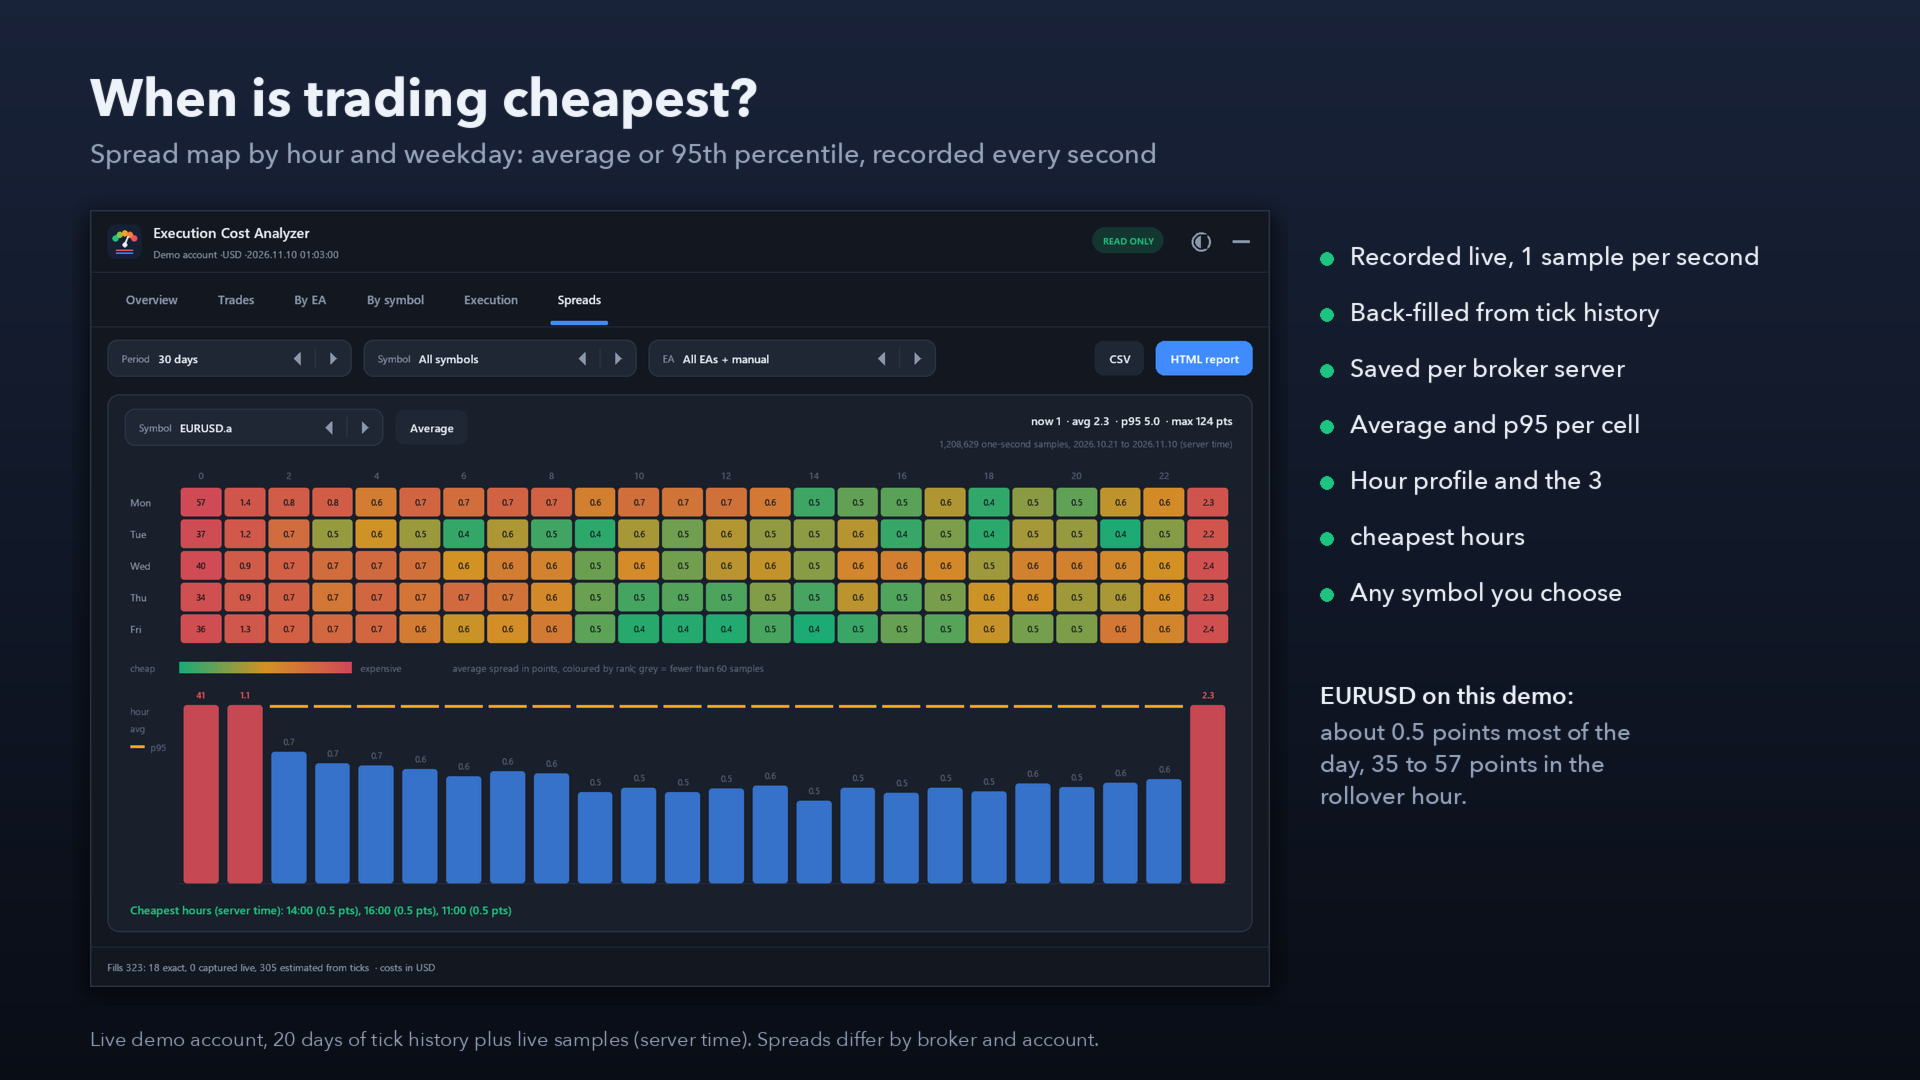
Spread map: when is trading cheapest?
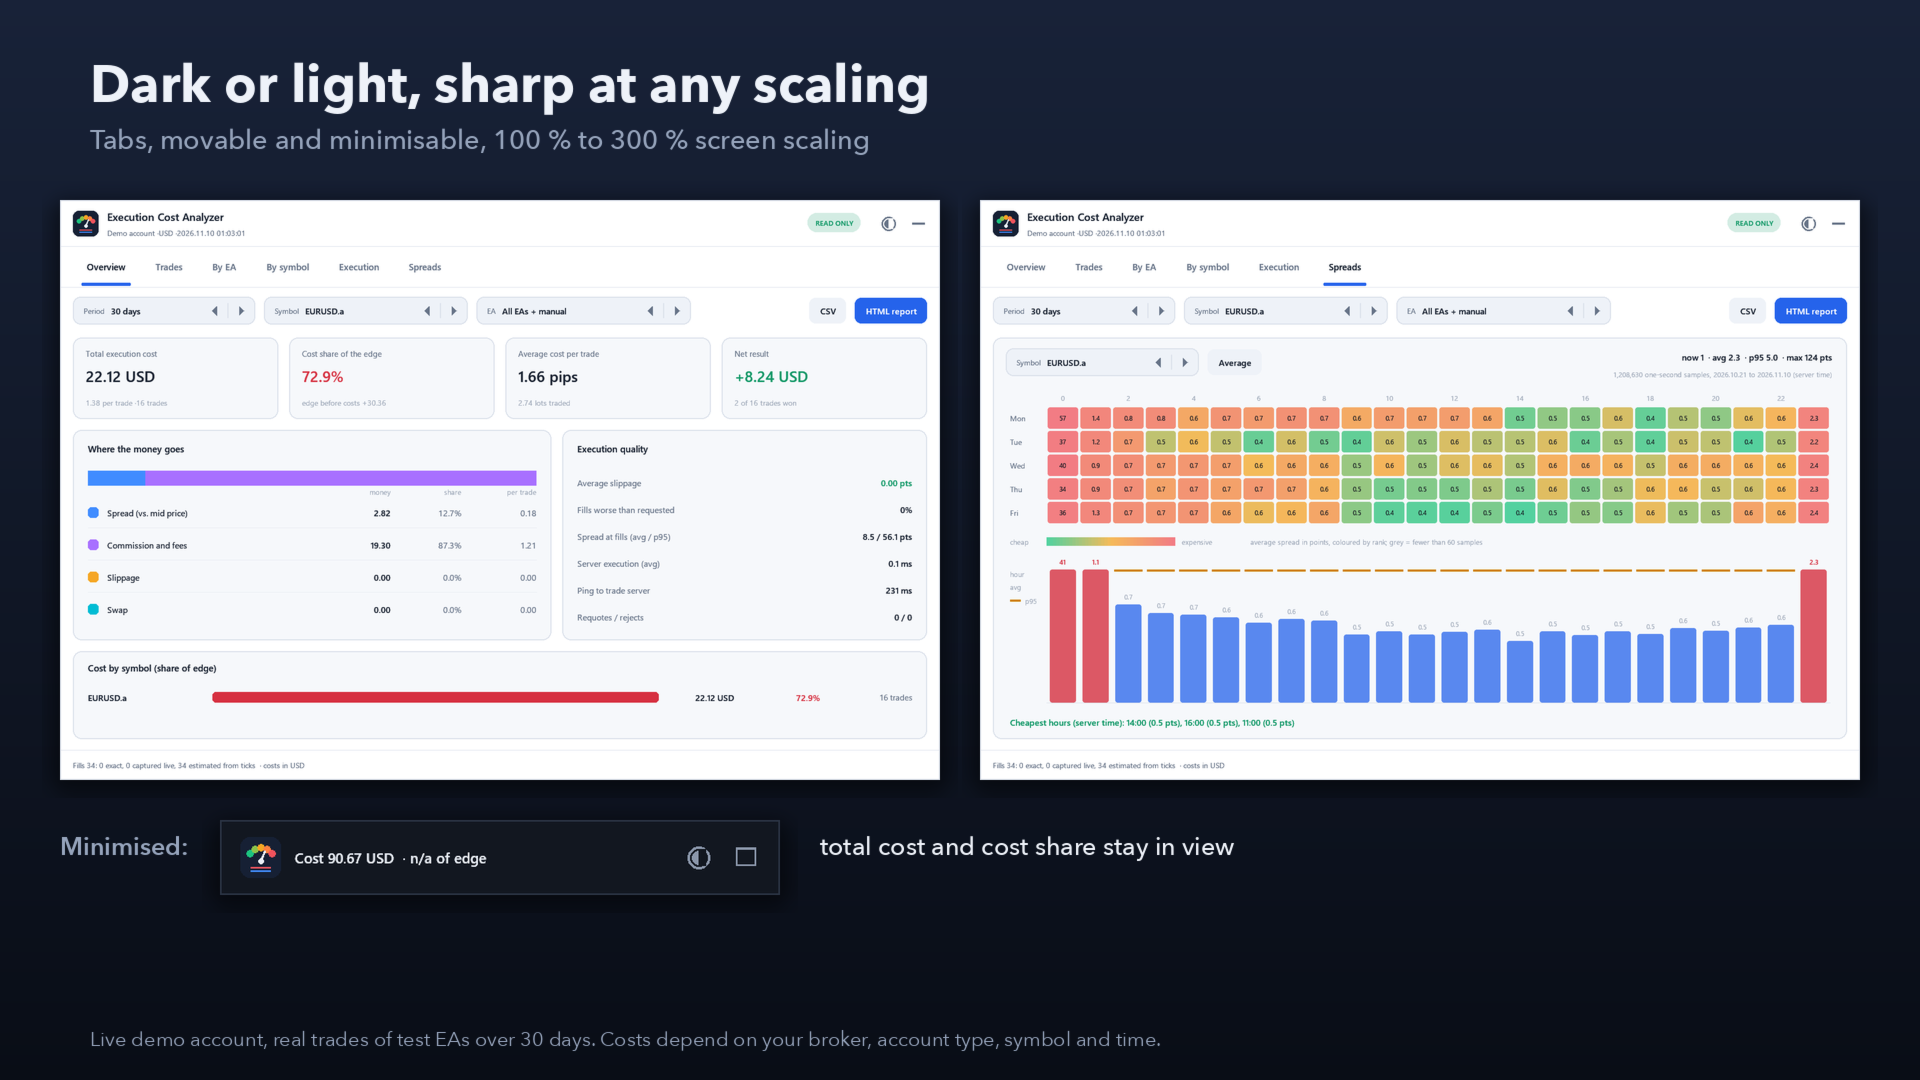
- Heatmap by hour and weekday with the average or the 95th percentile spread per cell, coloured from cheapest to most expensive.
- Hour profile (average and p95) and the three cheapest hours in server time.
- Recorded live once per second for the chart symbol, the symbols you trade and any symbols you add. On the first start it is back-filled from the tick history (10 days by default), and after a restart the gap is filled again.
- Saved per broker server, so the map keeps growing.
Filters
- Period: today, 7, 30 or 90 days, this year, 12 months, all loaded history.
- Symbol: all symbols or one.
- EA: all, one magic number, or manual trades only.
Reports
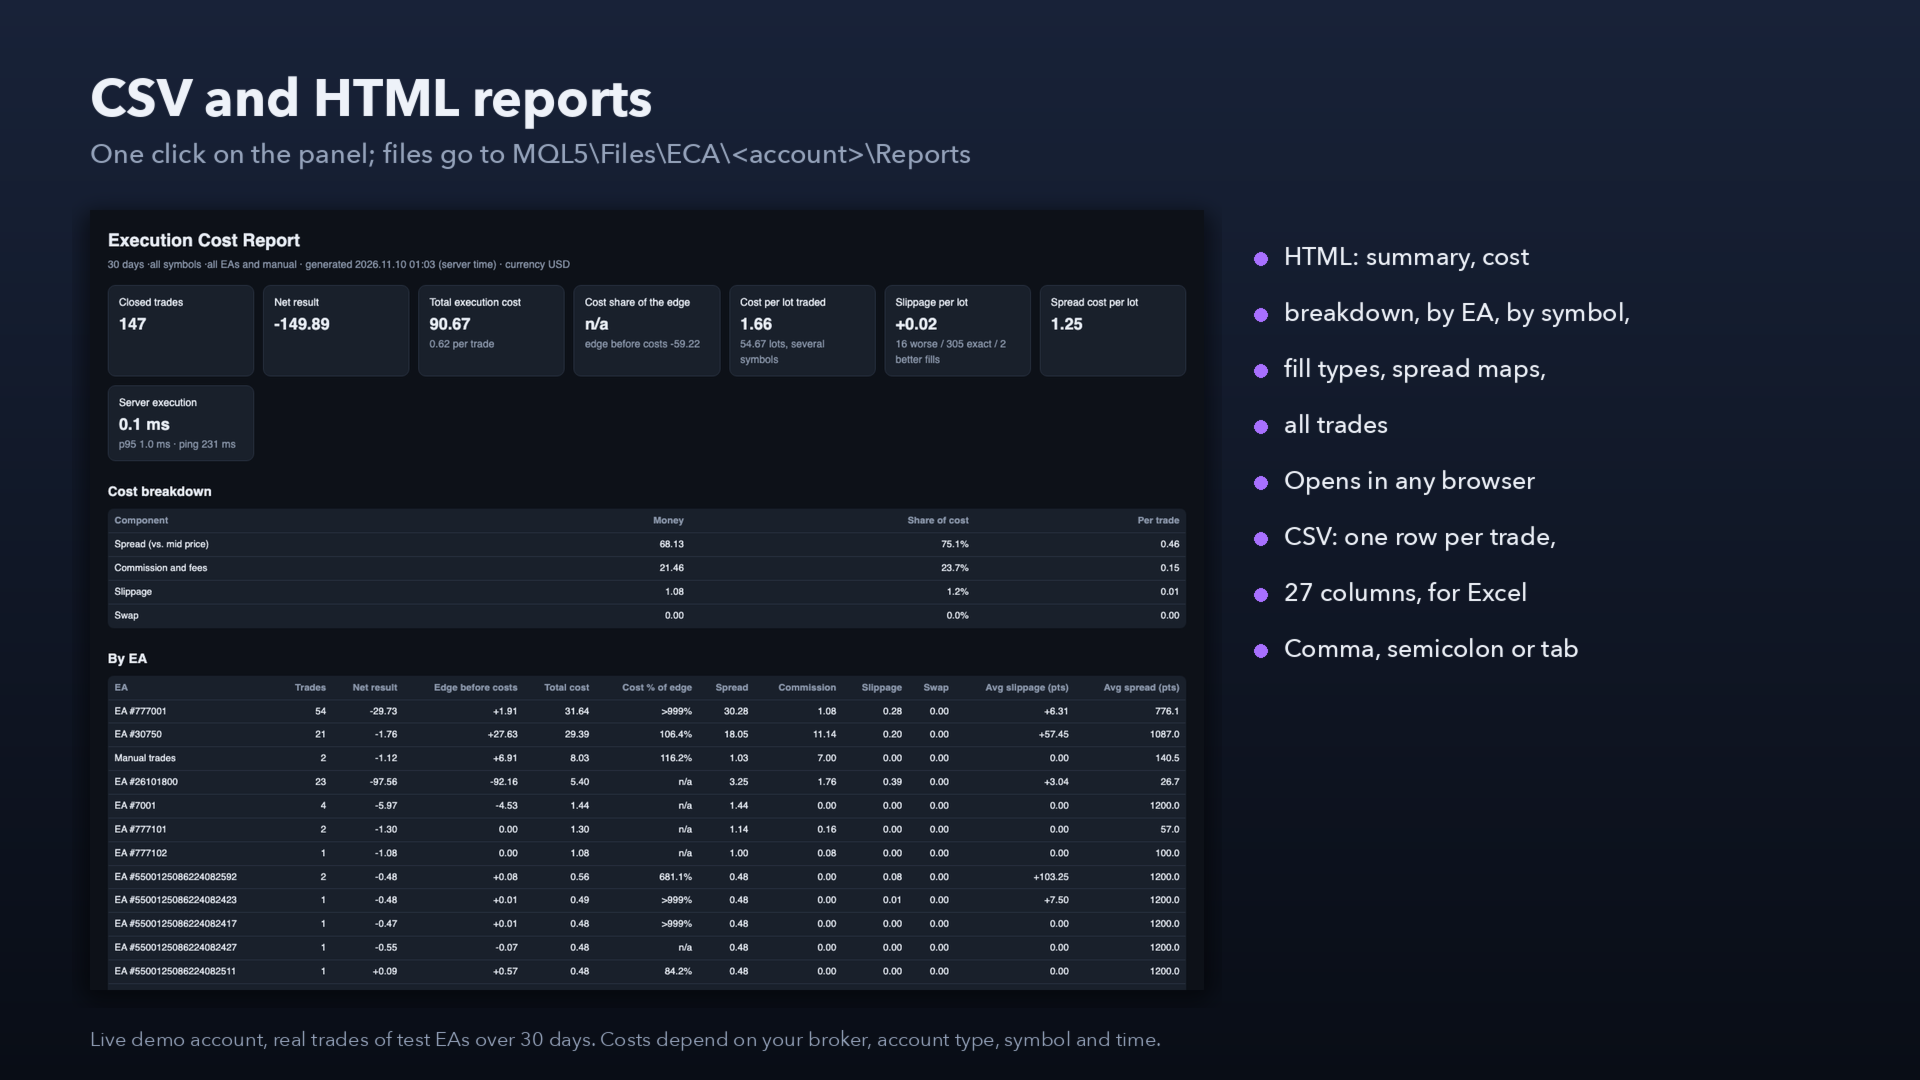
- HTML report with one click: summary, cost breakdown, by EA, by symbol, slippage by fill type, spread heatmaps and all trades. It opens in any browser, in dark or light mode.
- CSV: one row per trade with 27 columns, for Excel or your own analysis. The separator can be a comma, a semicolon or a tab.
- Files are saved in MQL5\Files\ECA\<account>\Reports.
Panel
- Six tabs: Overview, Trades, By EA, By symbol, Execution, Spreads.
- Dark and light themes (automatic from the chart background), sharp at 100 % to 300 % screen scaling, movable and minimisable. The tab, period and theme are kept per chart.
Exact, live or estimated: always labelled
MetaTrader 5 does not store the spread of a deal, and on market-execution accounts it does not store the requested price of a market order either. The analyzer therefore labels every number:
- Exact: trigger prices of pending orders, stop loss and take profit, server timestamps, commission and swap.
- Captured live: the spread at the moment a deal reaches the terminal while the analyzer runs.
- Estimated: for older deals, the quote at the order's server time is read from the tick history (marked with a dot in the table and in the reports).
Leave it running on one chart to get the most exact numbers.
Strategy Tester (free demo)
In the tester the account history is empty. In visual mode the demo places small demo trades on the tested symbol (market and stop orders with stop loss and take profit), so you can see the analyzer measure spread, slippage and commission. It also records the spread map of the tested symbol. You can switch the demo trades off in the inputs.
Inputs
- Analysis: history to load in days (0 = all), default period, slippage tolerance in points.
- Spread recorder: extra symbols to record, back-fill days, samples needed per heatmap cell.
- Reports: CSV separator.
- Panel: theme, scale %, position.
- Strategy Tester: demo trades in visual mode.
Notes
- Money values use the current tick value of each symbol, so cross-currency figures are close estimates.
- The analyzer measures past execution. It cannot change your broker's spread or fills, and past costs do not guarantee future execution conditions.
- Screenshots show a live demo account with trades of test EAs.