SRPowerChannel

SR Power Channel — Support & Resistance Power Channel Indicator
Overview
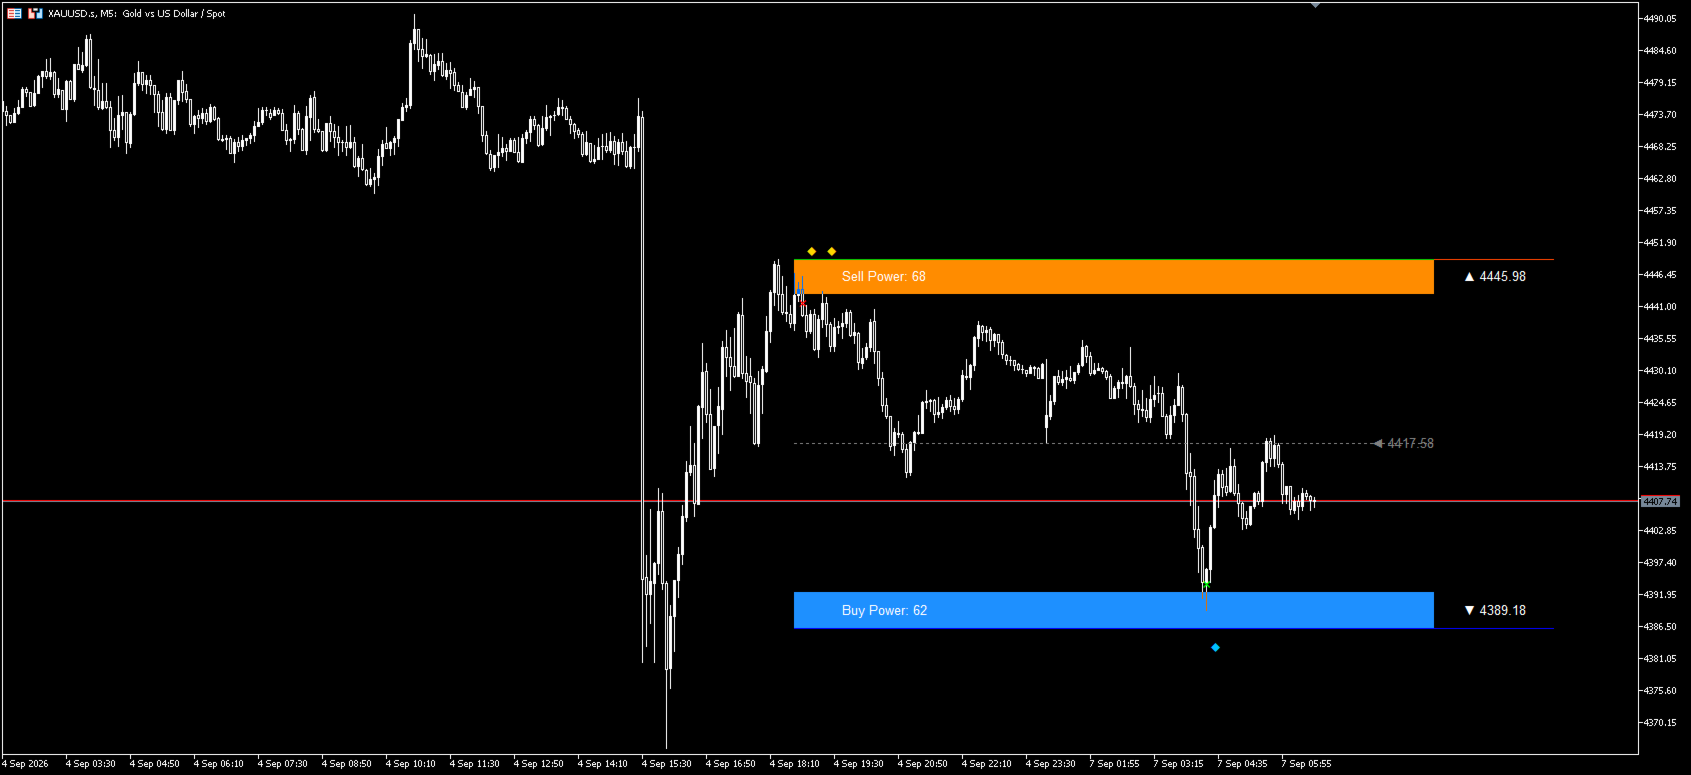
SR Power Channel is a main-chart visual indicator built on price extremes and ATR. It locates the highest high (resistance) and the lowest low (support) within a configurable lookback window, extends those two levels to the right, and wraps them into ATR-based channel bands. The indicator also counts bullish and bearish bars inside the window and marks the moments when price breaks above or below the channel bands with diamond symbols.
Because the drawing is anchored to the current (forming) bar, all levels, bands and markers refresh tick by tick.
Key Features
  • Automatically identifies the highest high (resistance) and lowest low (support) within the lookback window
  • Builds ATR-based channel bands around the extremes, with adjustable band width
  • Counts Buy Power (bullish bars) and Sell Power (bearish bars) inside the window
  • Marks the bars that break above/below the channel bands with diamond symbols
  • Places a cross marker on the extreme bars
  • All graphical objects update in real time with every tick
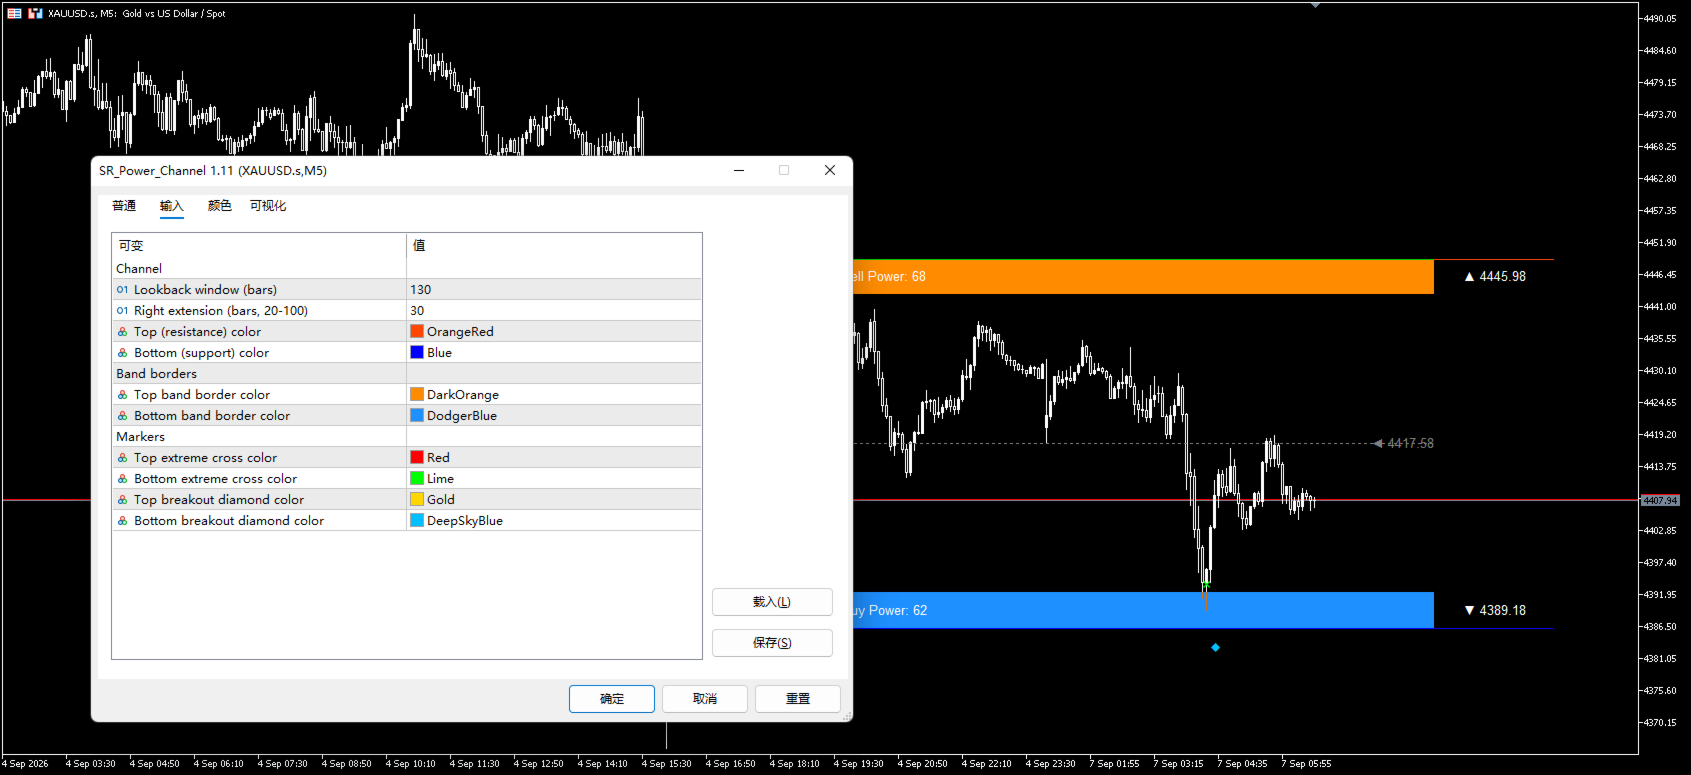
Input Parameters
Parameter
Description
Default
Lookback window (bars)
Length of the lookback window
130
Right extension (bars)
Bars to extend the levels to the right (20–100)
30
Top (resistance) color
Color of the upper (resistance) line
OrangeRed
Bottom (support) color
Color of the lower (support) line
Blue
Top band border color
Border color of the upper channel band
DarkOrange
Bottom band border color
Border color of the lower channel band
DodgerBlue
Top extreme cross color
Cross marker color at the top extreme
Red
Bottom extreme cross color
Cross marker color at the bottom extreme
Lime
Top breakout diamond color
Diamond color for upward breakouts
Gold
Bottom breakout diamond color
Diamond color for downward breakouts
DeepSkyBlue
How to Use
  1. Drag the indicator onto a chart of any timeframe
  2. Adjust the Lookback window according to the symbol's volatility — a smaller value suits ranging markets, a larger value suits trending markets
  3. Watch the Buy Power / Sell Power readouts to gauge the bullish/bearish balance inside the window
  4. When price breaks the channel band and a diamond marker appears, it can be used as a reference signal for attention
Risk Disclosure
This indicator is provided solely as a visual aid for technical analysis. The markers do not constitute trading advice. Actual performance depends on market conditions and the symbol traded. Users should apply their own money management and risk control strategy.

Plus de l'auteur
SweepReversalMap — Liquidity Sweep Reversal Zone Mapper Overview SweepReversalMap is a price-action-based custom indicator that detects "Liquidity Sweep" events and maps potential reversal zones once price reclaims the swept level. It works on any symbol and timeframe. Core Logic Pivot Detection : Identifies the most recent valid swing high/low based on user-defined Swing Length. Sweep Trigger : When price penetrates the swing high (or low) by at least the ATR-filtered minimum penetration thres
FREE
FibonacciSuite
Shi Yuan Wang
5 (1)
Title: Fibonacci Suite — Advanced Multi-Swing Confluence & Adaptive Fibonacci Indicator The Fibonacci Suite is a premium technical analysis indicator designed for MetaTrader 5. It automatically draws classic Fibonacci retracement and extension levels, and integrates multi-swing confluence detection, adaptive volatility adjustment, Golden Pocket highlighting, Fibonacci time zones, and a real-time status table. Whether you are a trend follower or a pullback trader, this tool provides clear, action
FREE
MACandleApprox — Moving-Average Approximate Candle Indicator MACandleApprox is a custom indicator that, on the main price chart, applies a selected type of moving average to the open, high, low, and close price series respectively, and replots them as "approximate candles". It does not modify the original candlesticks; instead, it overlays a smoothed candle view based on moving averages, helping traders observe the smoothed price movement and directional changes more intuitively. The indicator s
FREE
HubDynamicTrendLine This indicator identifies strict pivot highs and lows based on N bars to the left and right (default 15), connecting consecutive pivots of the same type to build a dynamic channel with upper and lower boundaries. Key Features Pivot Connections : Consecutive pivot highs and pivot lows are connected with solid trend lines, forming a visible channel structure. Slope Projection : When the price difference between two consecutive pivots of the same type is at least one 200-period
FREE
Daily trend strength (Daily Trend Strength) The Daily trend strength  is a visual analytical tool designed to track the relative strength of price movement compared to the daily opening price. It displays the percentage change of the current price from the daily open, using a color-coded line and area fill for instant trend recognition. Key Features Daily Percentage Change: Shows how far the price has moved from the daily open in percentage terms. Color-Coded Visualization: Green indicates price
FREE
Inverse probability distribution — Analytical Visualization Tool Based on Pivot Points & K-Means Clustering Overview This indicator is a pure technical-analysis visualization tool ​ for MetaTrader 5. It detects confirmed pivot highs/lows on historical bars, groups pivot prices using K-Means clustering, and builds a Inverse probability distribution  projected to the right of the chart — allowing traders to visually inspect how pivot points are statistically distributed across price levels. ️ Thi
FREE
High Time Candlestick Chart Visualize the current higher-timeframe candle directly on your lower-timeframe chart. This indicator projects the OHLC data of a selected higher timeframe ​ (M15, H1, H4, D1, or W1) onto your current chart as a graphical candlestick, offset to the right of the live price area. It helps you keep the bigger-picture candle structure in view without switching timeframes. Features Graphical HTF candle : Body, upper wick, and lower wick drawn as chart objects, colored by bu
FREE
Adaptive MACD - R² Based Adaptive MACD Indicator Overview Adaptive MACD is an innovative MetaTrader 5 indicator that improves upon the traditional MACD. By introducing the Pearson correlation coefficient to calculate the R² value of price trends, this indicator can adapt to market conditions and dynamically adjust its sensitivity. It helps traders capture trends more effectively while filtering out market noise. How It Works Traditional MACD uses a fixed difference between fast and slow EMAs. Ad
FREE
ZigZag Trader EA - Intelligent ZigZag Trading Assistant Introduction ZigZag Trader EA is a fully automated trading assistant based on the ZigZag indicator. It intelligently identifies previous highs and lows of the ZigZag indicator, combined with an advanced risk management system, to provide you with precise trading signals and automated trade execution. Whether you are a novice or experienced trader, ZigZag Trader EA can help you simplify trading decisions and achieve stable trading performa
FREE
# MASignalPanel — Multi-MA Signal Panel with Trend Filter ## Overview MASignalPanel is an all-in-one moving-average signal indicator designed for MetaTrader 5. It combines up to three moving averages (SMA, EMA, SMMA, LWMA) with four trade signal modes — Cross, Breakout, Pullback and Channel — and adds a higher-timeframe trend filter line (default EMA240) to keep you on the right side of the market. A fully interactive control panel lets you change MA type, MA count, periods, s MA indicator, movi
FREE
MACandleApproxPro — Advanced MA Candle Reconstruction & Multi-Dimensional Market Structure Indicator Overview MACandleApproxPro ​ is a comprehensive technical analysis tool designed for professional traders. It breaks through the limitations of traditional moving averages by reconstructing MA data into "MA Candles" ​ through complex algorithms. This unique visualization filters out market noise, allowing you to examine price trends, momentum shifts, and critical market structures from a more
JKTaurus
Shi Yuan Wang
JK-Taurus Expert Advisor EMA Trend & SAR Confirmation Grid Trading System Overview JK-Taurus is a fully automated trading system designed for the MetaTrader 5 platform. It combines multi-period EMA trend analysis, Parabolic SAR signal confirmation, and a dynamic grid adding strategy to capture sustained profits in trending markets. A built-in visual panel provides real-time account monitoring and manual control. Key Features Trend Filtering : Uses three EMAs (240, 680, 1100) to determine the mai
Dual Period Filter — Adaptive Dual-Period Coppock Momentum Indicator In one sentence : A trend-strength visualization indicator based on dual-period ROC summation, adaptive source filtering, and a 4-state momentum histogram, running in a separate MT5 window. How It Works The classic Coppock curve sums a long and a short Rate of Change (ROC) and then smooths the result with a WMA. This indicator enhances the classic formula in two ways: Adaptive source filtering : Before the price is fed into the
FREE
Adaptive filtering trend Overview Adaptive filtering trend is a multi-layer signal filtering indicator for the MetaTrader 5 platform, built on the Coppock curve. The indicator computes a long-period and a short-period Rate of Change (ROC) of the price, sums them, and smooths the sum with a Weighted Moving Average (WMA) to obtain the Coppock curve. A set of independently switchable filters is then applied to screen the signals, and bullish or bearish crossings are marked on the main chart throug
Filtrer:
Aucun avis
Répondre à l'avis