BBOscillator
- Indicateurs
-
Shi Yuan Wang
 Je développe des indicateurs personnalisés, des conseillers experts (EA), des scripts et des outils de trading
pour MetaTrader 4 et MetaTrader 5, ainsi que des indicateurs pour TradingView (PineScript).
Ce que je peux faire pour vous : - Version: 1.10
BBOscillator — Candle Coloring with Andean Oscillator States and ATR Stop Levels
Overview
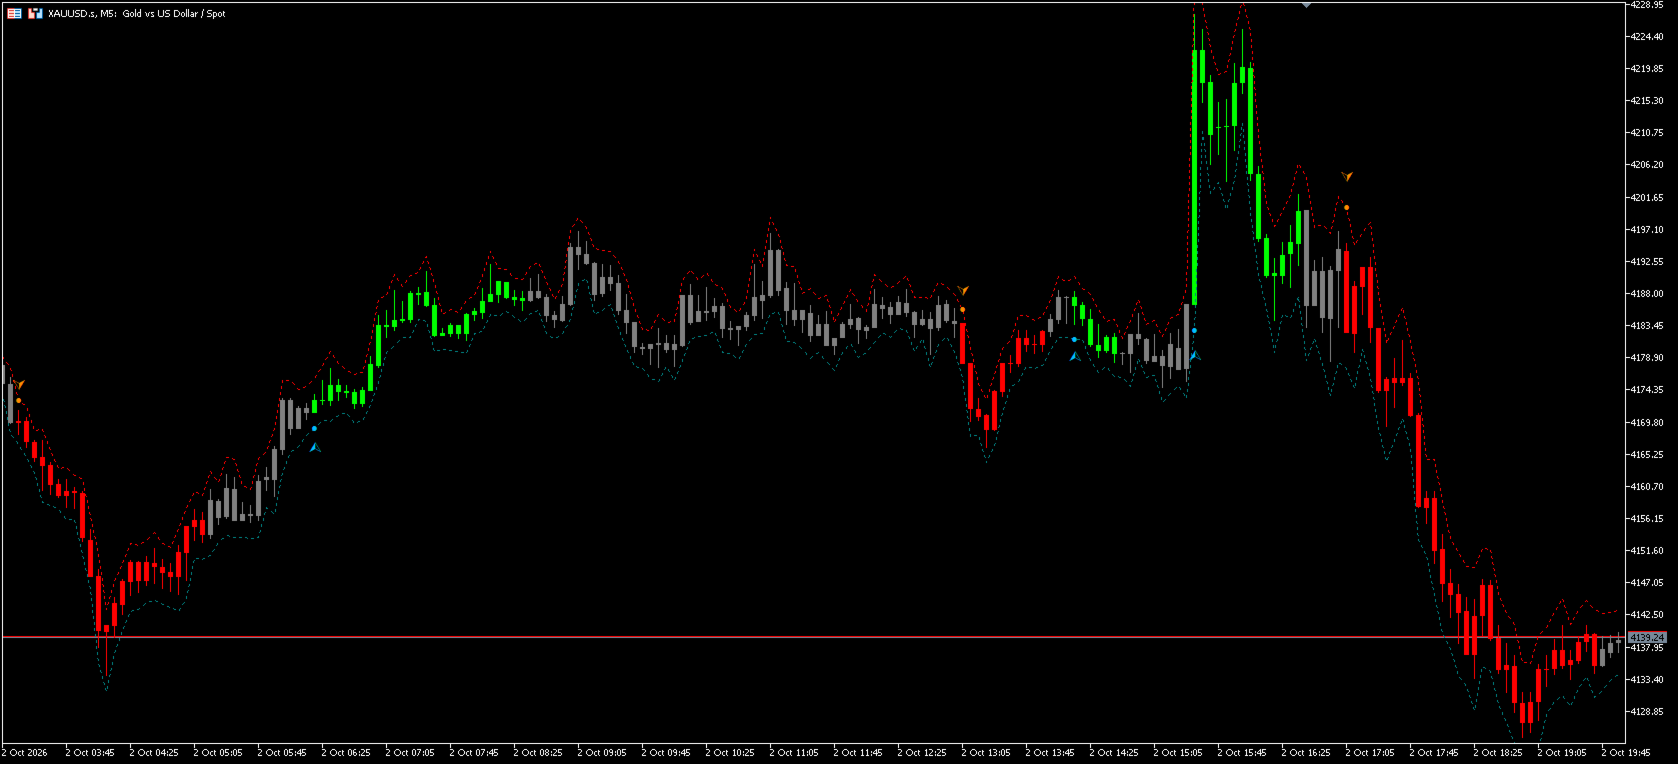
BBOscillator is a technical indicator for MetaTrader 5 that is drawn in the main chart window. It combines the Andean Oscillator state logic, candle coloring, dynamic ATR stop levels and state-change marks in a single visual layer, so that four questions can be answered by looking at one chart: whether the direction is defined, which side it leans to, where the direction state started, and where a stop reference level sits under the current volatility.
The indicator does not open, close or modify any orders and does not connect to any external service. It only displays price state in a more readable form. All trading decisions remain with the user.
Key Features
- Three-color candles. Each candle is painted in one of three colors according to the current state, replacing the standard candle colors of the chart.
- Direction state detection. The Andean Oscillator logic applies recursive smoothing to the first and second statistical moments of the close price, compares the bullish and bearish components, and compares both with a signal line to produce a three-state result.
- Dynamic ATR stop levels. Two reference lines are drawn above and below each candle. Their distance from the candle extremes is derived from the current ATR value and a user-defined multiplier, so the levels widen when volatility rises and contract when it falls.
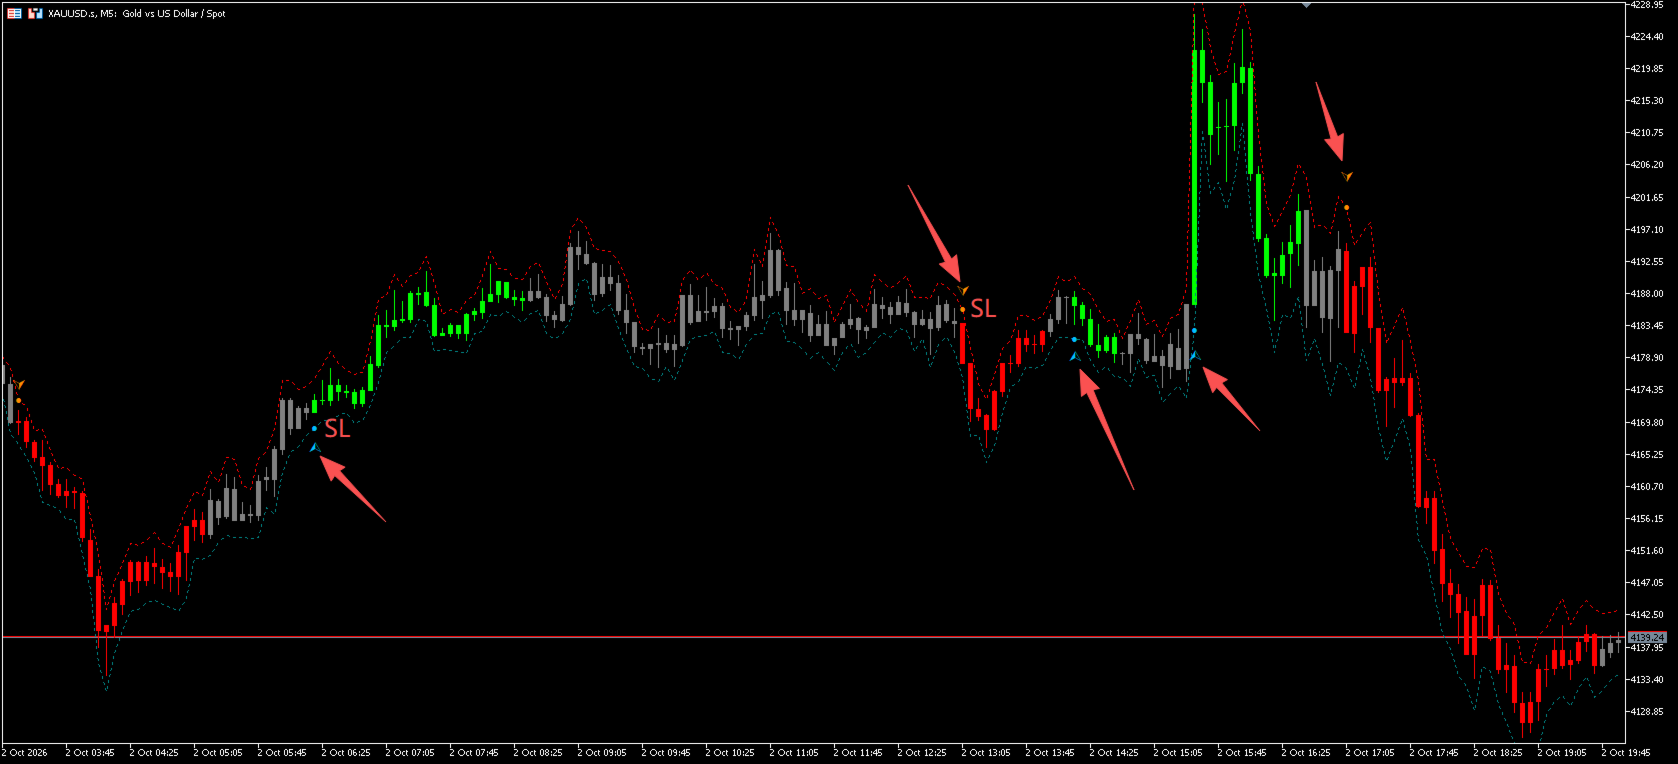
- State-change arrows. When the state switches from undefined to a defined direction, an arrow is placed on that candle to mark the beginning of the new state.
- Stop-level marks. On the same candle where an arrow appears, the stop reference level for that direction is marked, so the arrow and the level are always read together.
- Independent display switches. Stop lines, arrows and stop-level marks can be switched on and off separately, which makes it possible to reduce the chart to candle coloring alone.
Reading the Chart
- Green candle: the bullish component dominates the bearish one with the signal line between them, which corresponds to an upward-leaning state.
- Red candle: the bearish component dominates the bullish one with the signal line between them, which corresponds to a downward-leaning state.
- Gray candle: the relative position of the two components does not meet either condition, which corresponds to an undefined direction.
- Red dotted line: placed above the candle high, it is the stop reference level for a short-side view.
- Teal dotted line: placed below the candle low, it is the stop reference level for a long-side view.
- Blue up arrow: appears below the first candle that turns from gray to green and marks the start of the upward state; the stop-level mark is placed on the same candle.
- Orange down arrow: appears above the first candle that turns from gray to red and marks the start of the downward state; the stop-level mark is placed on the same candle.
Arrows are drawn only when the state changes from gray to a defined direction. While a state continues, no further arrows are added, so the chart does not get filled with repeated marks.
Input Parameters
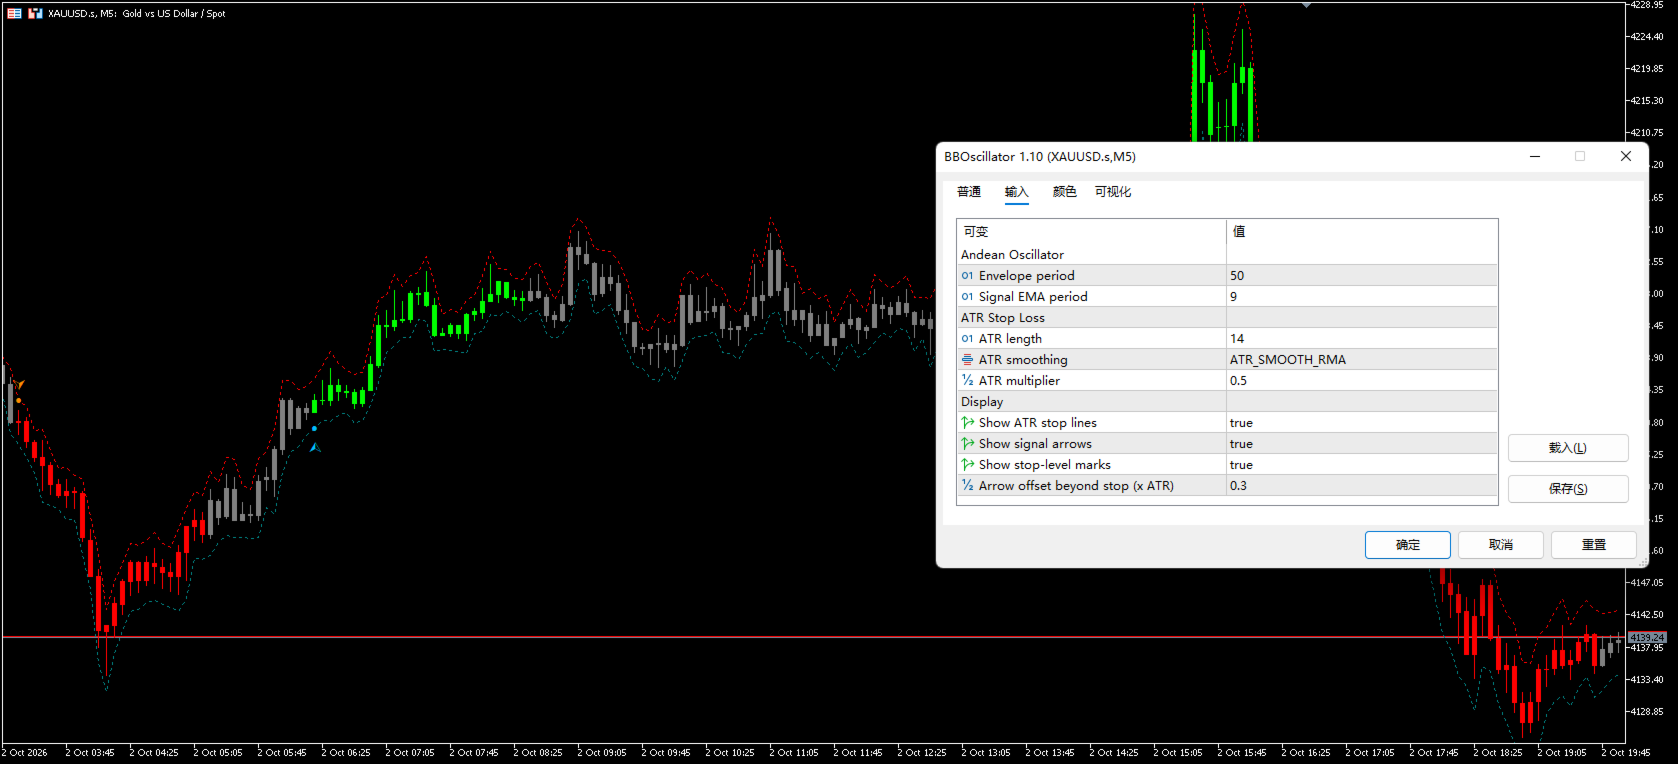
Andean Oscillator
- Envelope period (default 50): the calculation period behind the state detection. A larger value gives more stable states with fewer switches; a smaller value reacts faster to price changes and switches more often.
- Signal EMA period (default 9): the smoothing period of the signal line. Together with the parameter above, it defines how often the candle color changes.
ATR Stop Loss
- ATR length (default 14): the period used for the volatility calculation.
- ATR smoothing (default RMA): the calculation method for volatility. Four options are available: RMA, SMA, EMA and WMA. RMA and EMA are recursive methods, SMA and WMA recalculate over the window.
- ATR multiplier (default 0.5): the distance between the stop lines and the candle extremes, expressed in ATR units. A larger value places the levels further from price and makes them harder to reach; a smaller value keeps them close to price.
Display
- Show ATR stop lines (default true): draw the two stop reference lines.
- Show signal arrows (default true): draw the state-change arrows.
- Show stop-level marks (default true): draw the stop-level marks.
- Arrow offset beyond stop (default 0.3): the offset of the arrow from the stop level, expressed in ATR units. Increase it when arrows overlap the candle bodies.
How to Use
- Place the indicator file into the MQL5/Indicators folder of the terminal, then restart the terminal or refresh the Navigator.
- Find BBOscillator in the Navigator and drop it onto the chart of any symbol and any timeframe.
- While the indicator is attached, it takes over the candle colors of the chart and applies its own three-color scheme. When the indicator is removed, the original chart colors are restored automatically.
- Start with the default settings and observe the result, then adjust the parameters to the symbol and timeframe you work with. Increase the calculation period to reduce state switching, increase the ATR multiplier to widen the stop levels.
- The stop lines can be read directly as price levels for stop placement. The actual stop distance still depends on the money management rules of the user.
The indicator works with any symbol available in the terminal, including currency pairs, metals, indices and cryptocurrencies, and with any timeframe. It is recommended to review its output on a demo account or in the visual mode of the Strategy Tester before using it on a live chart.
Usage Notes
- On the candle that is still forming, the color, the stop lines and the arrow update on every tick and may change until the candle closes. The state of a candle becomes final only after that candle is closed, so state transitions are best confirmed on closed candles.
- While the indicator is attached, it temporarily modifies the candle and border colors of the chart and restores them on removal. If another program on the same chart also manages chart colors, the settings may overwrite each other.
- Once a candle is closed, its state and marks are fixed and are not redrawn by later price action.
- The indicator is a display tool only. It has no order placement, position management or money management functions.
Availability
The indicator is currently distributed free of charge via the MQL5 Market. According to the release plan of the author, once the number of downloads exceeds 100, the product will be switched to a subscription-based distribution model. After the switch, the product page shows the subscription options available at that time. Copies added to an account before the switch remain in the Market section of that account.
Risk Disclaimer
This product is a technical analysis display tool. It presents the direction state of price and volatility-based reference levels. It does not provide investment advice and does not guarantee or promise any trading result. Trading financial markets involves risk, and all trading decisions and their consequences remain the responsibility of the user.