SRPowerChannel
- Indicadores
-
Shi Yuan Wang
 Desenvolvo indicadores personalizados, Expert Advisors (EAs), scripts e ferramentas de trading para MetaTrader 4 e MetaTrader 5, e indicadores para TradingView (Pine Script).
O que posso fazer por si: - Versão: 1.11
- Ativações: 5
SR Power Channel — Support & Resistance Power Channel Indicator
Overview
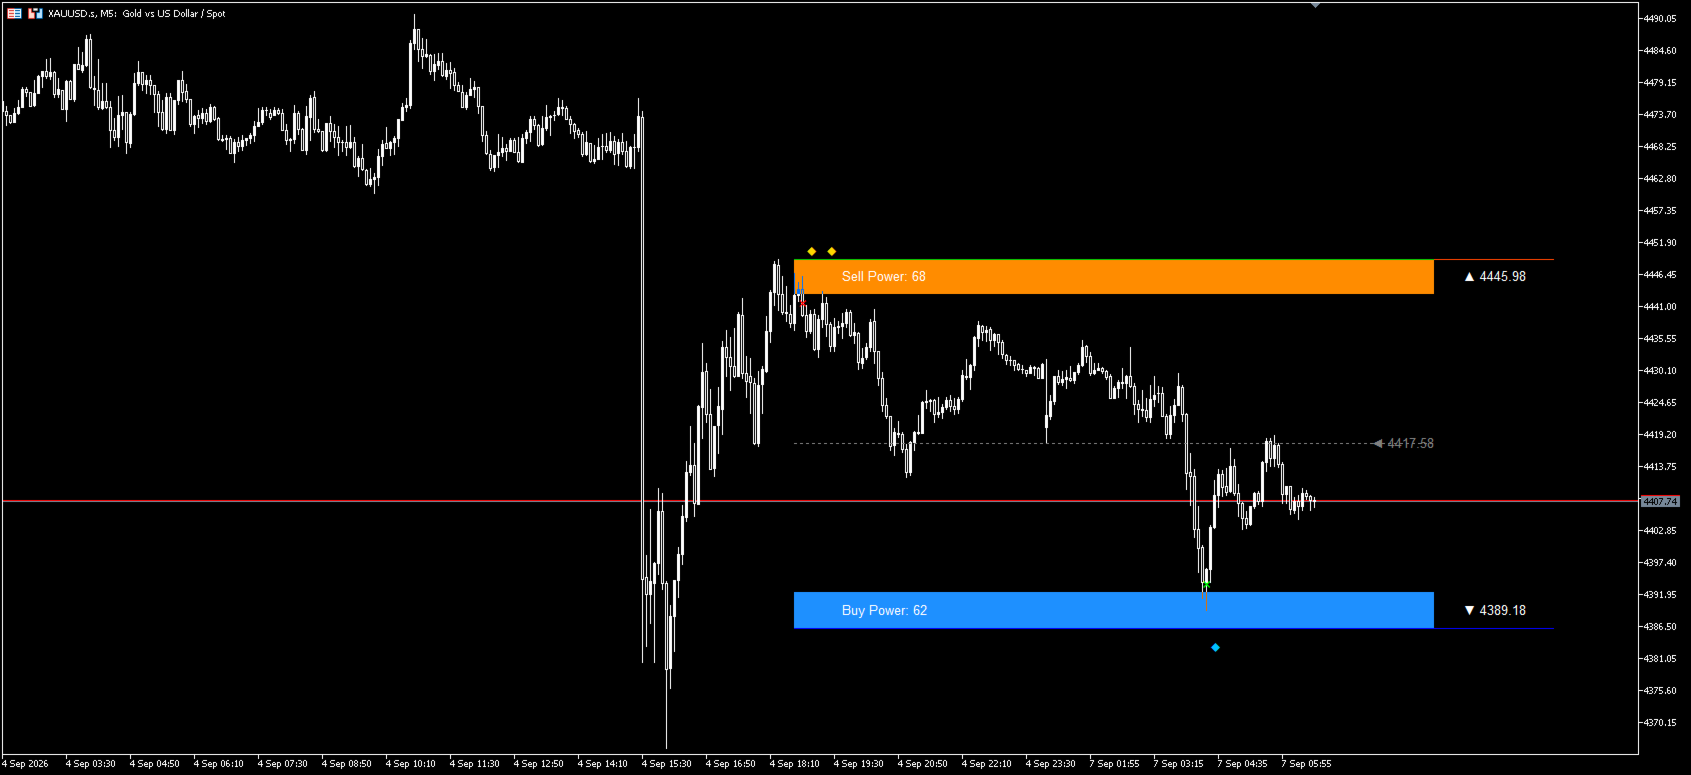
SR Power Channel is a main-chart visual indicator built on price extremes and ATR. It locates the highest high (resistance) and the lowest low (support) within a configurable lookback window, extends those two levels to the right, and wraps them into ATR-based channel bands. The indicator also counts bullish and bearish bars inside the window and marks the moments when price breaks above or below the channel bands with diamond symbols.
Because the drawing is anchored to the current (forming) bar, all levels, bands and markers refresh tick by tick.
Key Features
- Automatically identifies the highest high (resistance) and lowest low (support) within the lookback window
- Builds ATR-based channel bands around the extremes, with adjustable band width
- Counts Buy Power (bullish bars) and Sell Power (bearish bars) inside the window
- Marks the bars that break above/below the channel bands with diamond symbols
- Places a cross marker on the extreme bars
- All graphical objects update in real time with every tick
Input Parameters
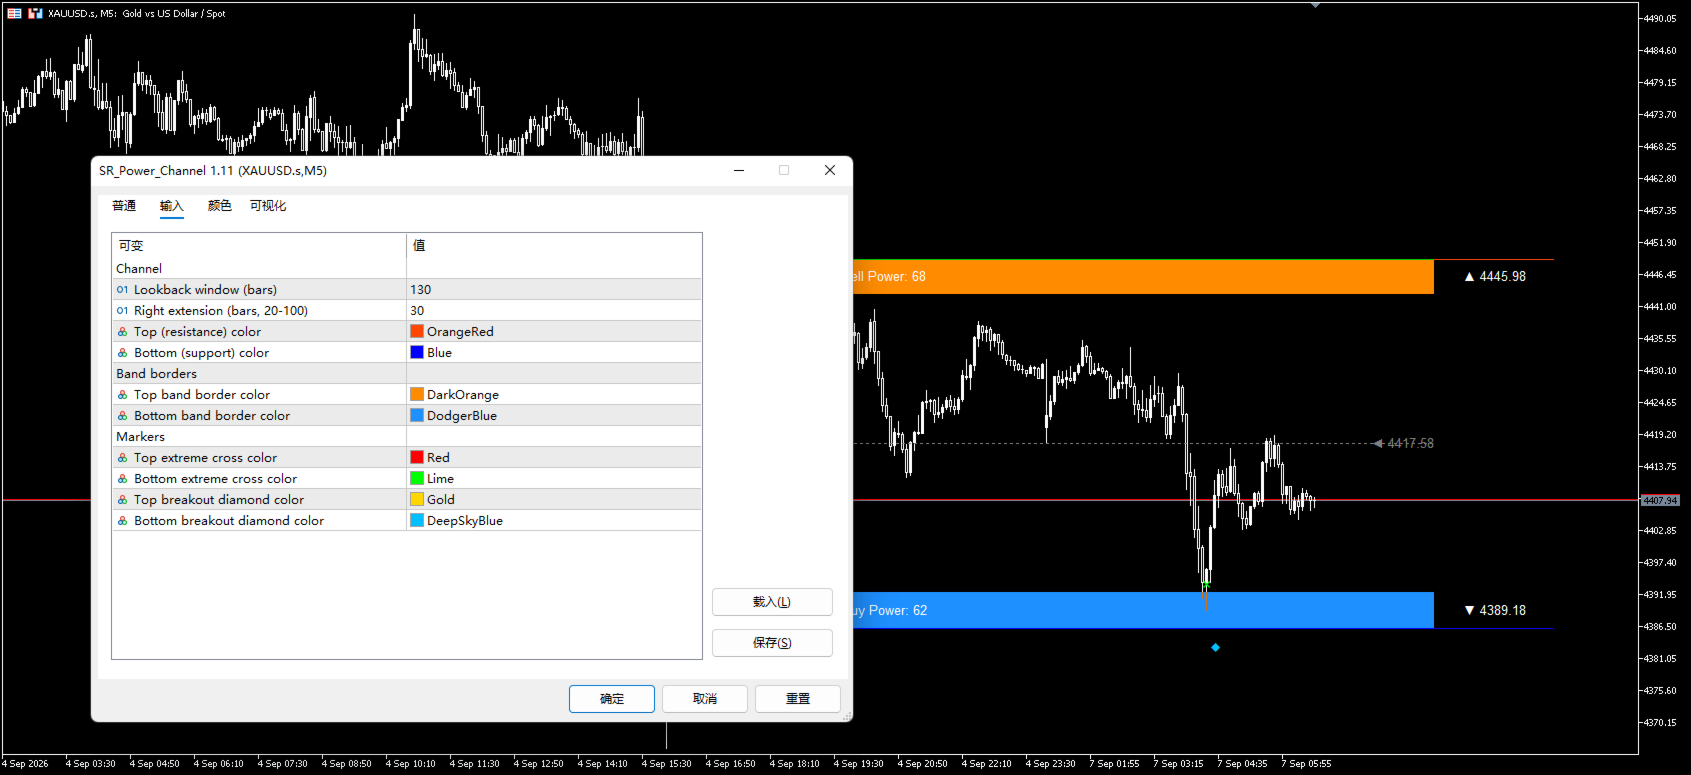
Parameter | Description | Default |
|---|---|---|
Lookback window (bars) | Length of the lookback window | 130 |
Right extension (bars) | Bars to extend the levels to the right (20–100) | 30 |
Top (resistance) color | Color of the upper (resistance) line | OrangeRed |
Bottom (support) color | Color of the lower (support) line | Blue |
Top band border color | Border color of the upper channel band | DarkOrange |
Bottom band border color | Border color of the lower channel band | DodgerBlue |
Top extreme cross color | Cross marker color at the top extreme | Red |
Bottom extreme cross color | Cross marker color at the bottom extreme | Lime |
Top breakout diamond color | Diamond color for upward breakouts | Gold |
Bottom breakout diamond color | Diamond color for downward breakouts | DeepSkyBlue |
How to Use
- Drag the indicator onto a chart of any timeframe
- Adjust the Lookback window according to the symbol's volatility — a smaller value suits ranging markets, a larger value suits trending markets
- Watch the Buy Power / Sell Power readouts to gauge the bullish/bearish balance inside the window
- When price breaks the channel band and a diamond marker appears, it can be used as a reference signal for attention
Risk Disclosure
This indicator is provided solely as a visual aid for technical analysis. The markers do not constitute trading advice. Actual performance depends on market conditions and the symbol traded. Users should apply their own money management and risk control strategy.
It will switch to a subscription service after exceeding 100 downloads.