TrendfFollowingLine
- Indicateurs
-
Shi Yuan Wang
 Je développe des indicateurs personnalisés, des conseillers experts (EA), des scripts et des outils de trading
pour MetaTrader 4 et MetaTrader 5, ainsi que des indicateurs pour TradingView (PineScript).
Ce que je peux faire pour vous : - Version: 1.0
Trendfollowingline(ATR Based Trend Following Indicator)
Overview
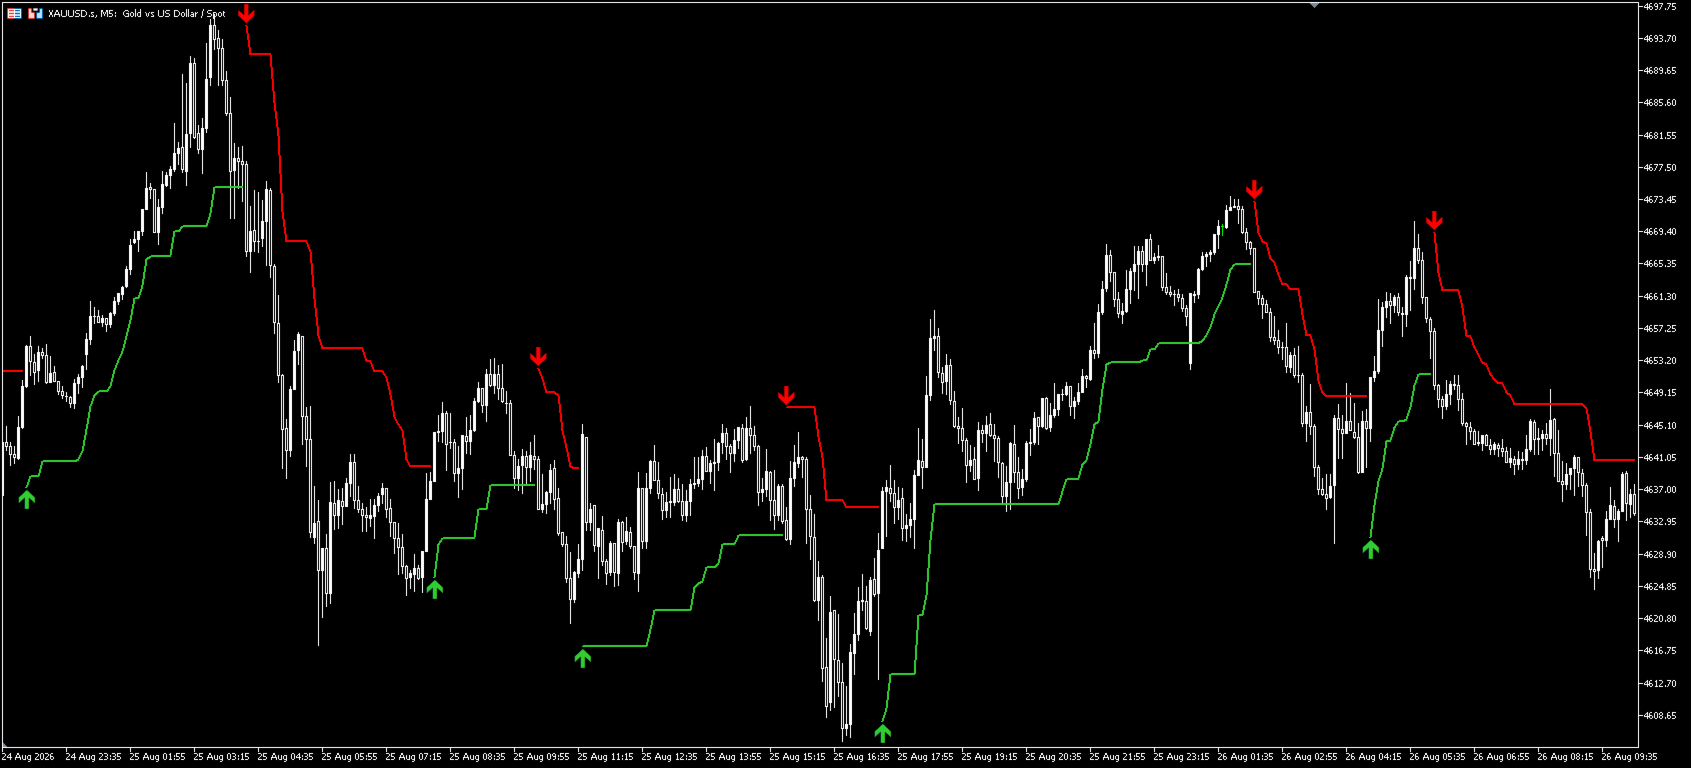
Trendfollowingline is a trend following indicator drawn in the main chart window. It uses the Average True Range (ATR) as a measure of market volatility and plots a band around the price: while the direction is up, the band is placed below the price and moves upwards; when the direction turns down, the band switches above the price and moves downwards. An arrow marker is drawn on the band each time the direction changes.
The indicator contains no trading logic. It does not place or modify orders and is intended for chart analysis only.
Features
- Trend direction display: a green line marks the up direction and a red line marks the down direction. Only one of them is displayed at a time.
- Trailing band: in an up state the band only moves up, in a down state it only moves down, which reduces switching caused by minor price fluctuations.
- Direction change markers: a green up arrow appears when the direction turns up, a red down arrow appears when it turns down. Markers can be switched off.
- Volatility adaptation: the band width is derived from ATR, so it widens when volatility increases and narrows when volatility decreases. There is no need to adjust a fixed point value for each symbol.
- Two ATR methods: Wilder smoothing or a simple moving average of the true range.
- Seven price sources: (High+Low)/2, (High+Low+Close)/3, (Open+High+Low+Close)/4, Close, Open, High and Low.
- No restrictions: no time limits, no account limits and no symbol limits. The indicator can be attached to any symbol and to any timeframe.
Chart elements
Element | Color and style | Description |
|---|---|---|
Up Trend | Green solid line | Band below the price in an up direction |
Down Trend | Red solid line | Band above the price in a down direction |
Buy | Green up arrow | Drawn below the band when the direction turns up |
Sell | Red down arrow | Drawn above the band when the direction turns down |
Input parameters
Parameter | Default | Description |
|---|---|---|
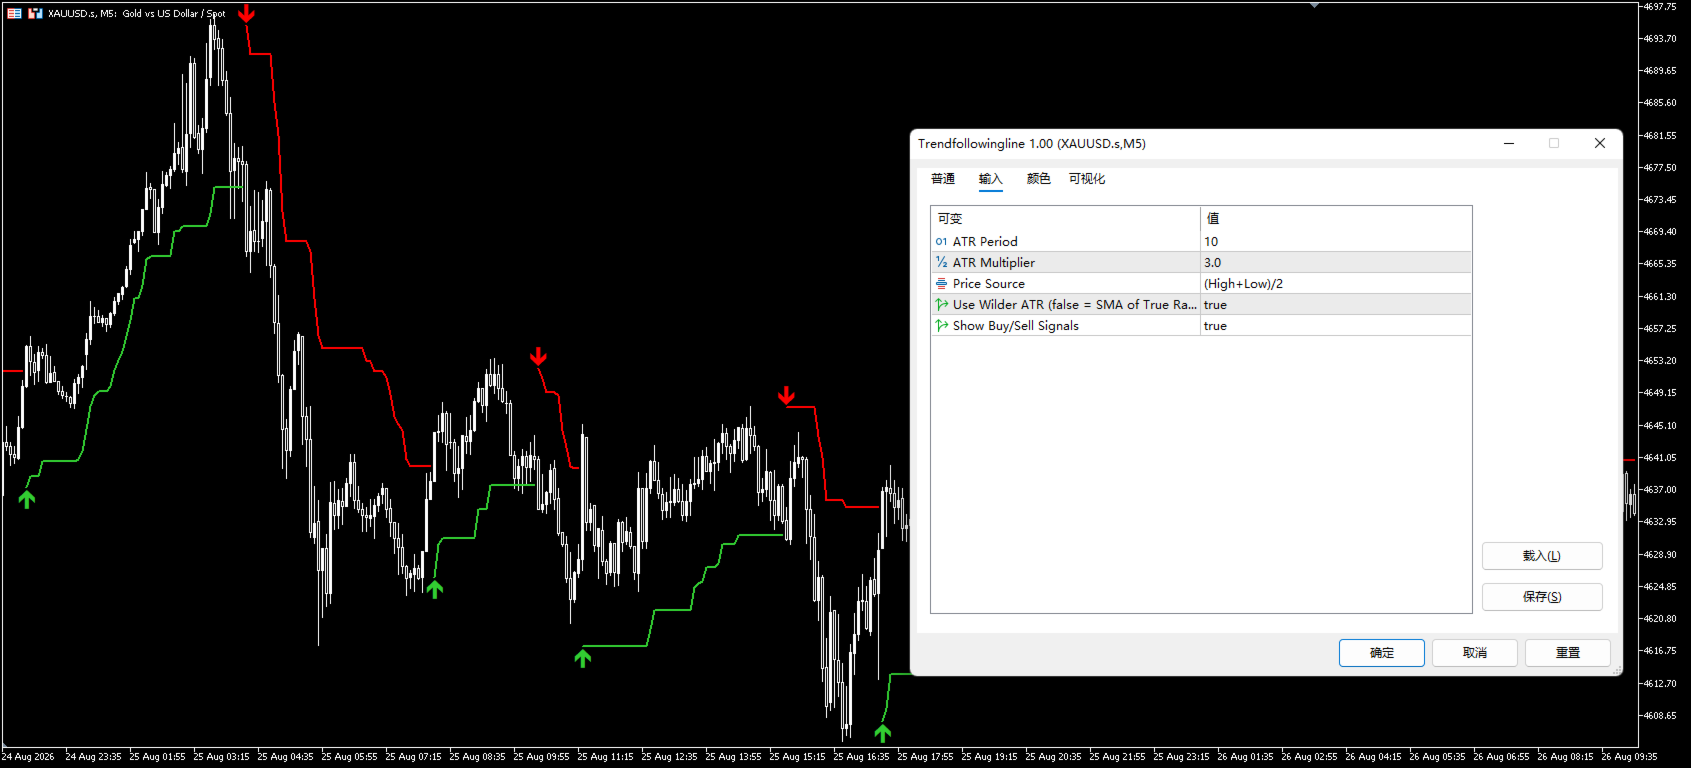
ATR Period | 10 | Period used to calculate the average true range, minimum value is 2 |
ATR Multiplier | 3.0 | Band factor; a larger value places the band further away from the price |
Price Source | (High+Low)/2 | Price used to build the center of the band |
Use Wilder ATR | true | true applies Wilder smoothing; false applies a simple moving average of the true range |
Show Buy/Sell Signals | true | Enables or disables the direction change arrows |
Parameter notes
- A larger ATR Period makes the band less sensitive to short term fluctuations, so the direction changes less often.
- A larger ATR Multiplier moves the band further away from the price, so a larger price move is required to change the direction.
- Smaller values of both parameters keep the band closer to the price and produce more frequent direction changes.
- Volatility differs between symbols. Spend some time observing the indicator on the symbol and timeframe you intend to use before deciding on the values.
- The default price source of (High+Low)/2 is suitable in most cases. Switch to Close if you prefer a band that follows closing prices more closely.
How to use
- Installation: copy the indicator file into the MQL5/Indicators folder of the terminal data directory, then restart the terminal or refresh the Navigator.
- Attaching: double click the indicator in the Navigator or drag it onto the chart of any symbol. The indicator is drawn in the main price window.
- Reading the chart: while the price is above the green line the direction is considered up, while the price is below the red line the direction is considered down. The corresponding arrow is drawn when the direction changes.
- Combining with other tools: the indicator can be used together with other trend or oscillator indicators and with manually drawn support and resistance levels, for example as a reference for direction or for a trailing stop level.
- Unclosed bars: on the bar that is still forming, the band and the arrow follow the latest price. The line and the marker become fixed only after that bar is closed. Values on closed bars are not redrawn.
- Data requirement: the chart must contain enough bars, at least the ATR period plus two bars, otherwise the indicator returns no values.
Intended use
- Manual trading: to observe the current price direction and to locate the point where a directional move ends.
- Automated use: the indicator provides four plot buffers, namely the up band, the down band, the up direction marker and the down direction marker. They can be read by other indicators or by an Expert Advisor in the standard way.
Risk notice
Technical indicators are calculations based on past prices and cannot predict future market movement. This indicator does not provide any guarantee of profit and does not constitute investment advice. Please spend sufficient time observing it on a demo account or in the Strategy Tester before using it, and take responsibility for your own trading decisions and results.
It will switch to a subscription service after exceeding 100 downloads.