TrendView
- Indicateurs
- Version: 1.0

📌 TrendView — Clear Trend Visualization for Confident Trading
TrendView is a free trend indicator designed to give traders a clean and reliable view of market direction. It displays clear trendlines in three colors, making it easy to identify bullish, bearish, and neutral phases without cluttering the chart with unnecessary elements.
Whether you are monitoring long-term market structure or short-term price action, TrendView helps you keep your focus on the bigger picture. For traders who also want trade signals, statistics, charts, and alerts, there is TrendView Ultimate, which builds on the same foundation with extra tools for decision support.
✅ Core Features
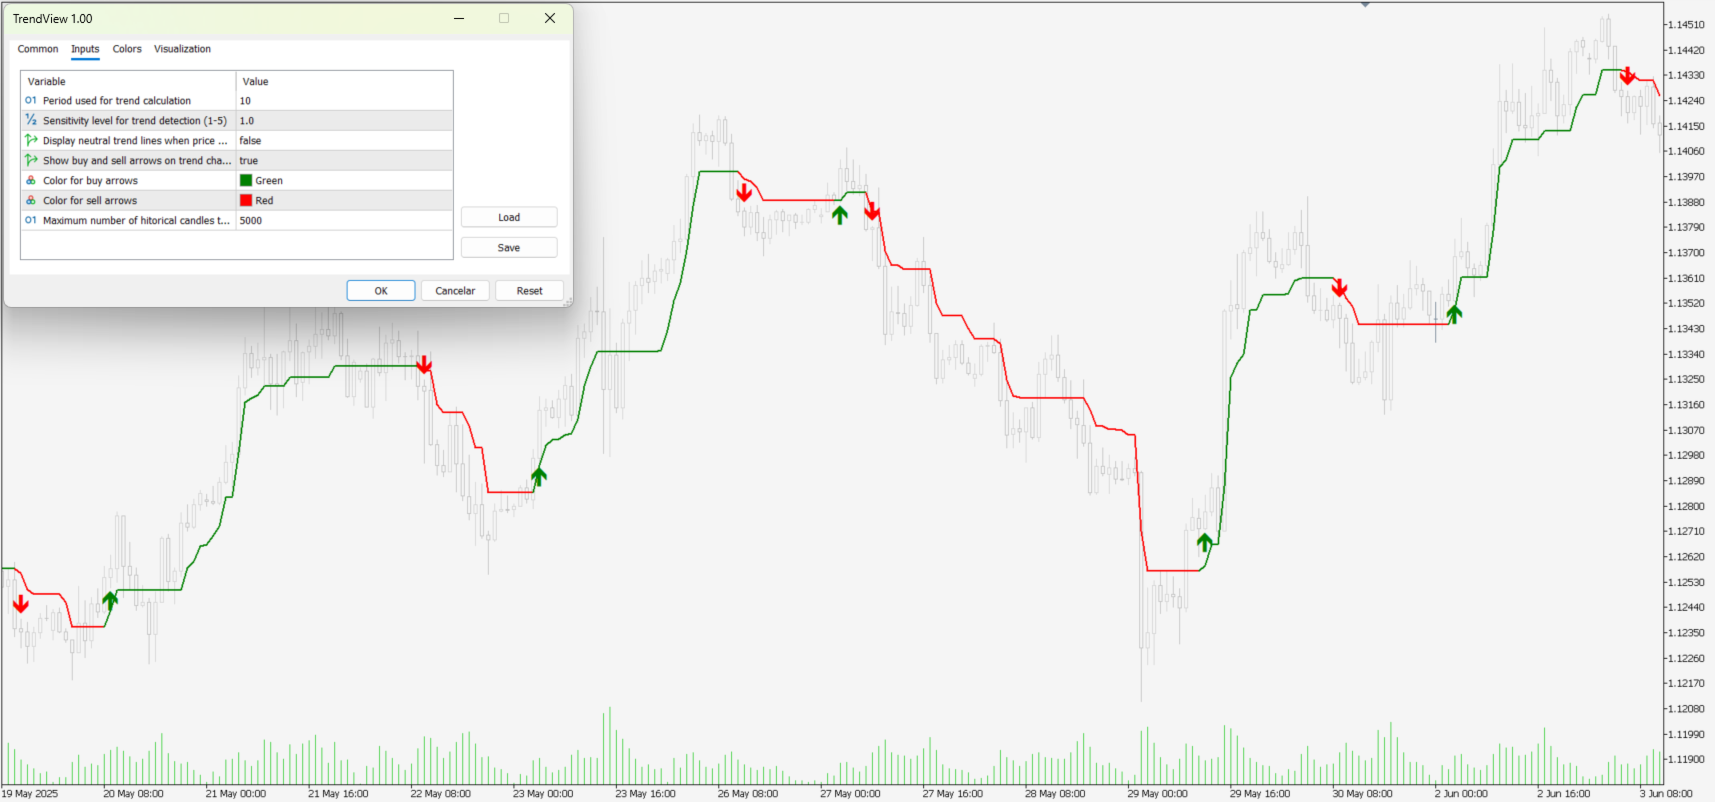
- 100% Non-repainting — All trendlines and signals are confirmed on candle close, they never disappear or move, ensuring accuracy and trust in both historical and real-time analysis
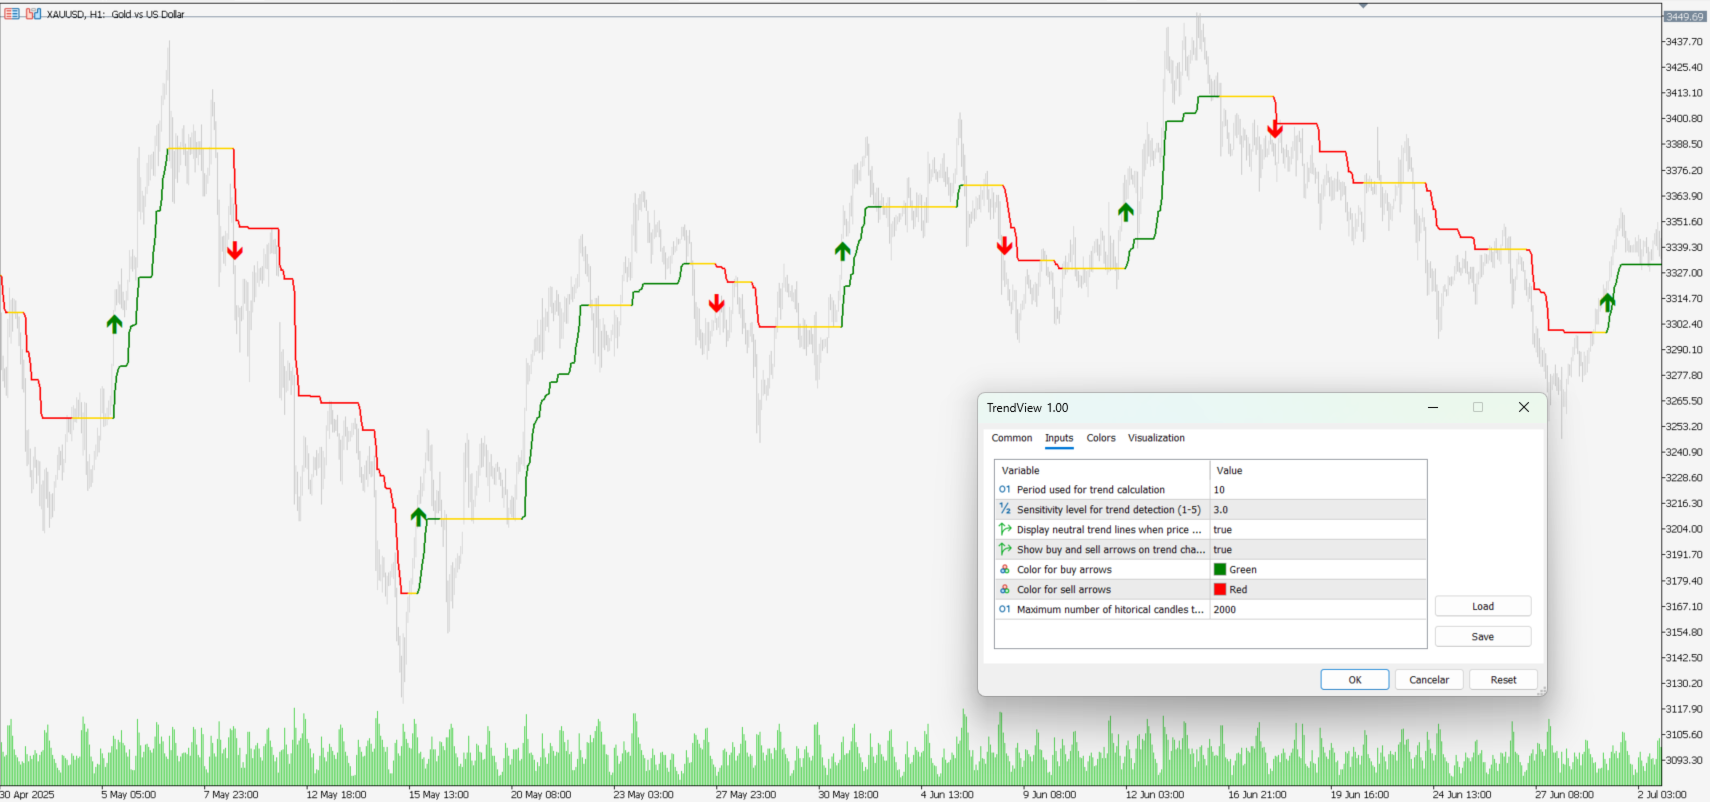
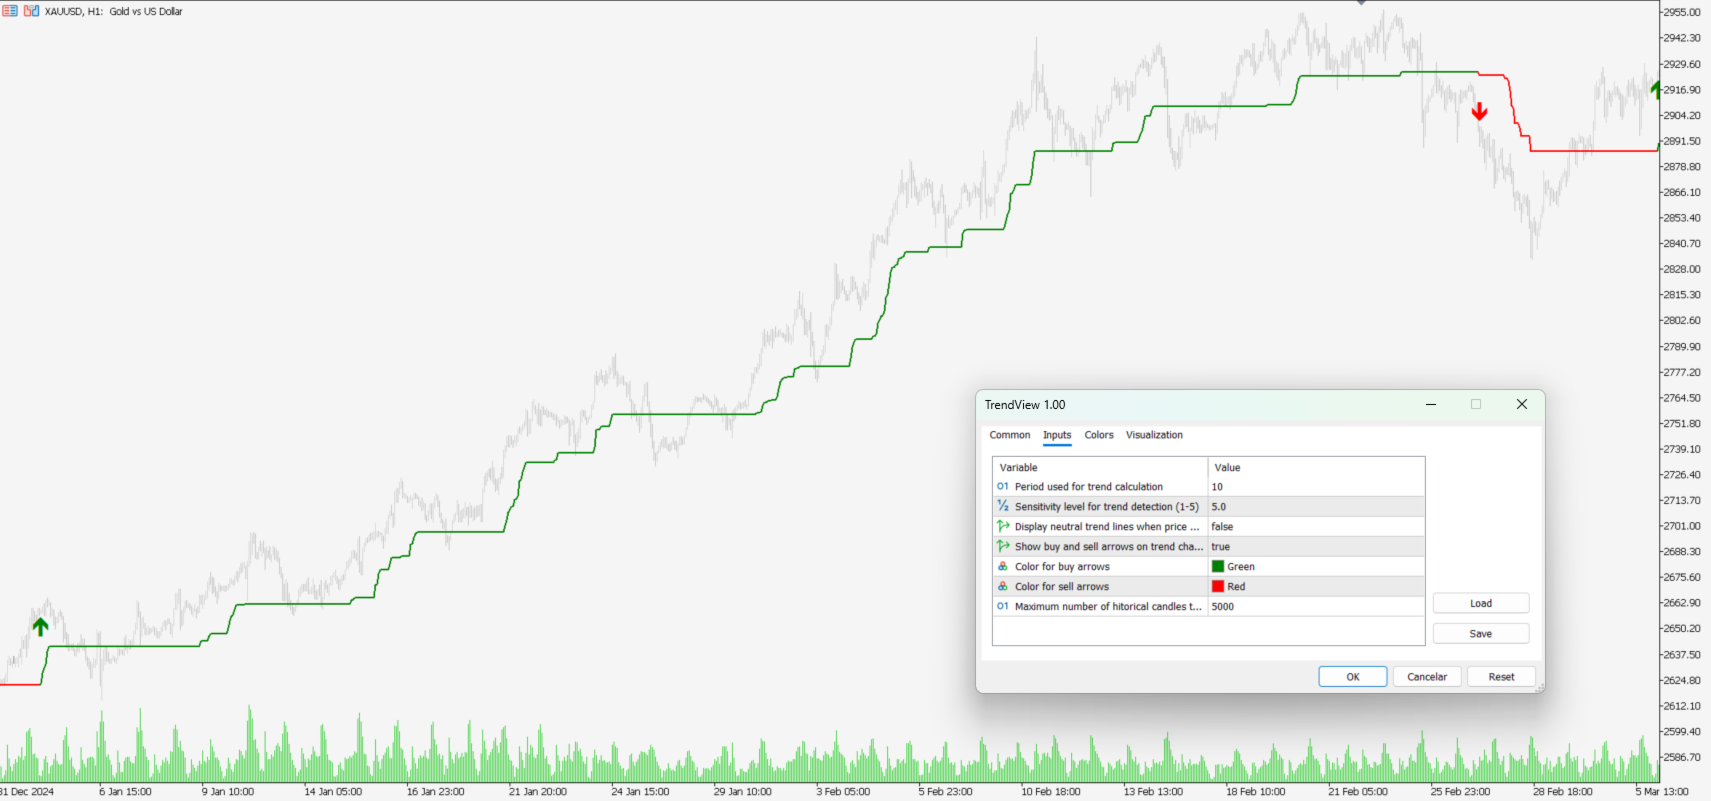
- Clear Three-Phase Trend Display:
- Green for bullish trends
- Red for bearish trends
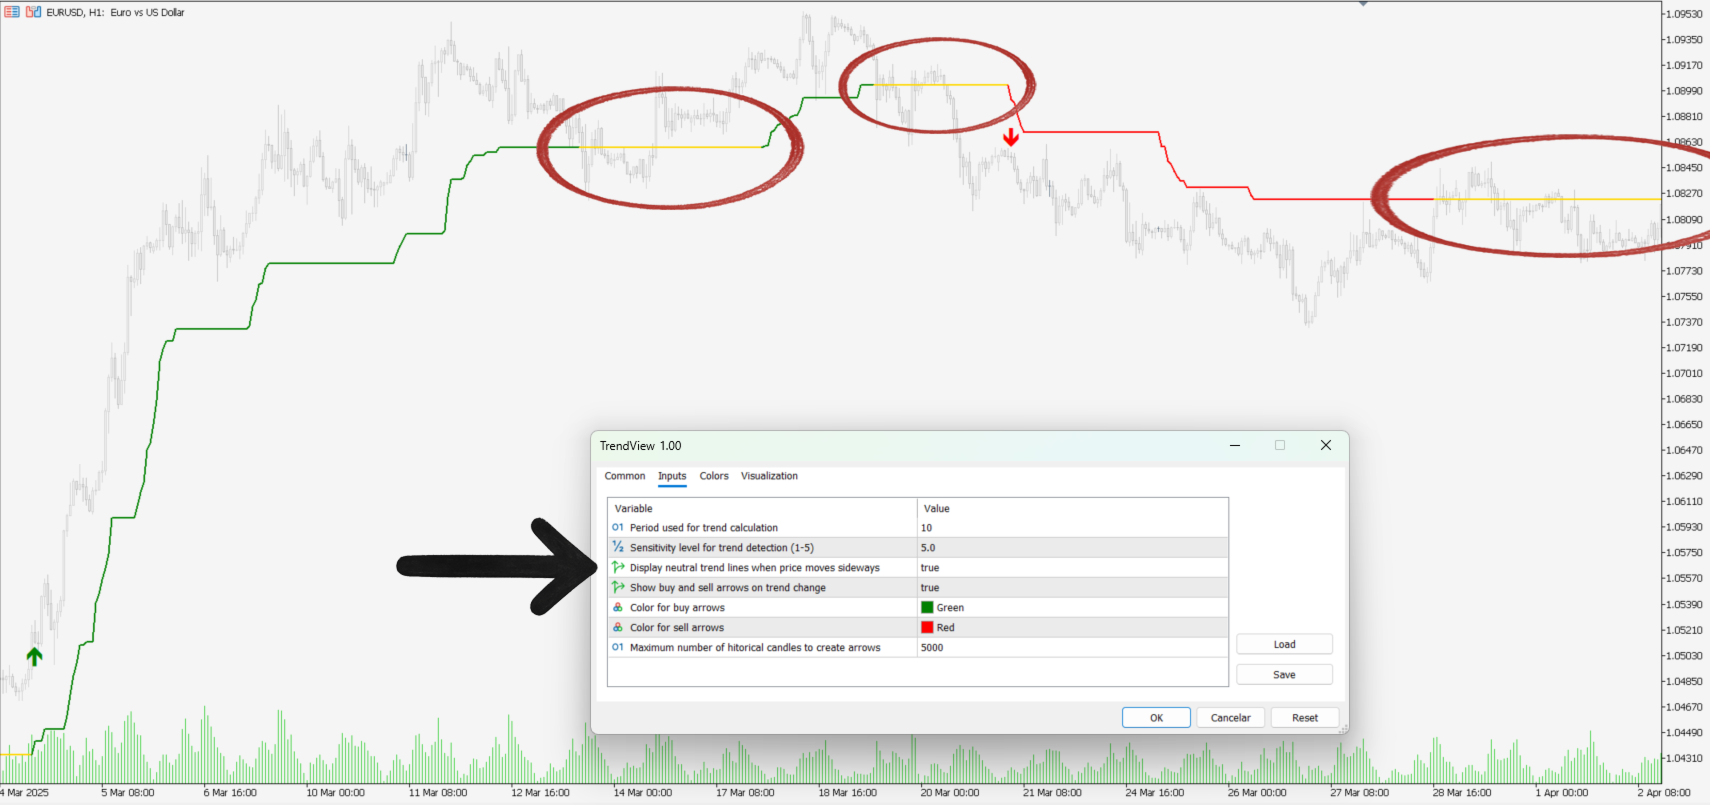
- Yellow for neutral or consolidation periods (optional)
- Customizable Parameters — Adjust the calculation period and sensitivity to suit your trading style, select whether to display the neutral trend phase, and customize colors for all lines
- Lightweight and Fast — Optimized for smooth performance even on lower timeframes and extended chart history
📊 How It Works
TrendView analyzes price action using advanced algorithms to identify trend direction changes. When a new trend is detected, it draws a colored line that extends until the trend reverses. This provides traders with a clear visual reference of current market structure.
The indicator automatically adapts to different market conditions and timeframes, ensuring reliable trend identification across various trading instruments and market environments.
💡 Pro Tip
For best results, use TrendView as your primary trend reference and combine it with other analysis tools such as support/resistance levels, volume analysis, or momentum indicators. This combination approach increases the probability of successful trend-following trades.
🚀 Looking for More Tools for Trend Management?
If you want to complement your trend analysis with additional resources, explore TrendView Ultimate, which includes:
- Entry and exit signals based on trend changes
- Simulated profit lines for strategy evaluation
- Full statistics panel with real-time analytics
- The exclusive Ultimate System for real-time trade simulation and historical strategy testing
TrendView Ultimate combines trend visualization with integrated tools for trade planning and management.
⚙️ Parameters
- Period used for trend calculation (default: 10)
- Sensitivity level for trend detection (1–5, default: 3.0)
- Display neutral trend lines (yellow) (default: true) — shows yellow lines when price enters sideways consolidation
- Customize colors for all trend phases• Maximum number of historical candles to create arrows
👤 Best For
- Traders who want to quickly identify market direction without distractions
- Anyone looking to maintain chart clarity for better decision making
- Traders who prefer a reliable and easy-to-read trend reference
- Beginners learning about trend analysis and market structure
- Traders who want to combine trend analysis with their own entry/exit methods
---
TrendCore Labs — Professional Trading Tools for Modern Traders
L'utilisateur n'a laissé aucun commentaire sur la note