DTFX Algo Zones Indicator MT5
- Indicateurs
- Eda Kaya
- Version: 1.6
DTFX Algo Zones Indicator for MetaTrader 5
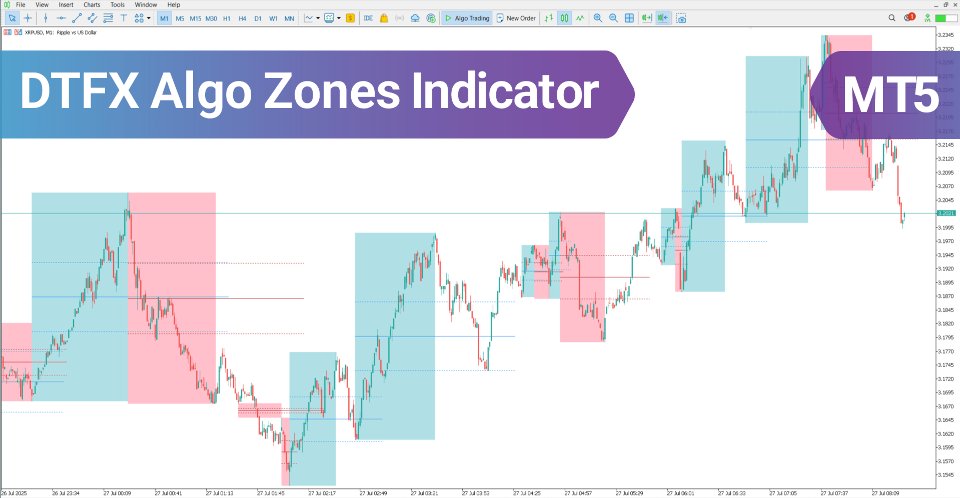
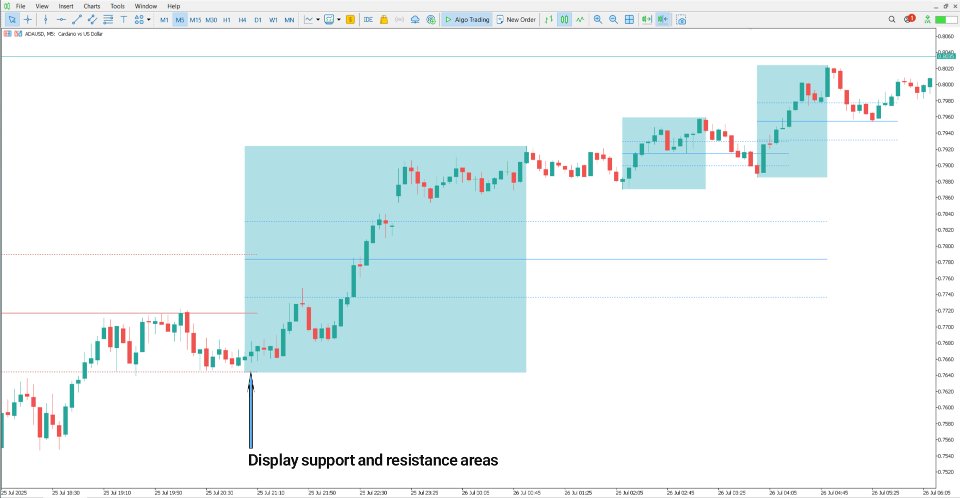
The DTFX Algo Zones Indicator is a sophisticated market analysis solution that automatically maps out supply and demand areas. Its main purpose is to locate high-probability reversal points by combining Swing Point detection with Fibonacci-based calculations.
Unlike standard indicators that issue straightforward buy or sell alerts, this tool serves as a visual reference for interpreting market structure, dynamically illustrating vital support and resistance areas as color-coded zones (green for demand, red for supply).
«Indicator Installation & User Guide»
DTFX Algo Zones Indicator Overview Table
| Category | Levels & Zones – Trading Tool – Support and Resistance |
| Platform | MetaTrader 5 |
| Skill Level | Intermediate |
| Indicator Type | Breakout – Reversal |
| Timeframe | Multi-timeframe |
| Trading Style | Intraday Trading |
| Trading Market | All Markets |
DTFX Algo Zones Key Highlights
The colored zones within the DTFX Algo Zones Indicator merge critical market metrics with advanced computational logic, outlined as:
- Swing Point Recognition – Identifying supply and demand regions from legitimate price turning points.
- Fibonacci Alignment – Strengthening zones by matching them with 50%, 61.8%, and 78.6% Fibonacci retracement levels on price swings.
- Price Action Confirmation – Verifying the reliability of zones through candlestick reversal signals, momentum strength, and reaction behavior.
- Algorithmic Filtering – Automatically excluding weaker zones for improved accuracy.
- Adaptive Visual Display – Presenting zones with varied color brightness and opacity according to their significance.
Example: Indicator in an Uptrend
On the 15-minute chart, the AUD/CHF pair is trending upward.
A trade setup becomes attractive when price reaches a DTFX demand zone and bullish indications appear, such as strong green candles or long lower wicks. Extra confirmation factors, like a breakout of a descending trendline or high trading volume, further support the case for a long trade and help identify a potential sustained rally.
Example: Indicator in a Downtrend
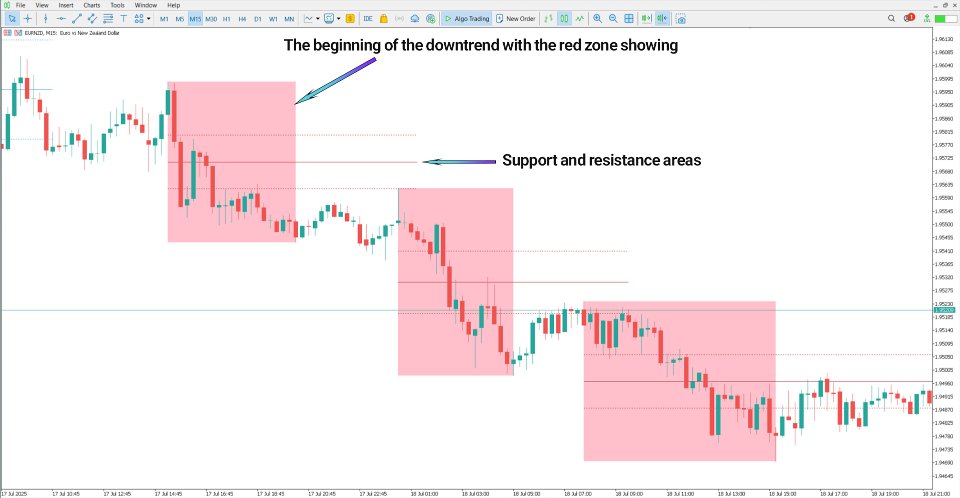
For the EUR/CAD pair in a 15-minute timeframe, a downtrend scenario occurs when price moves into a DTFX supply zone.
This typically triggers selling momentum and potential short setups. Bearish reversal formations — like engulfing patterns or pronounced upper wicks within a red zone — indicate that downward pressure is likely to persist. If these signs align with Fibonacci retracement levels or a falling trendline, the probability of a successful trade increases, offering an optimal short entry.
DTFX Algo Zones Indicator Settings Panel
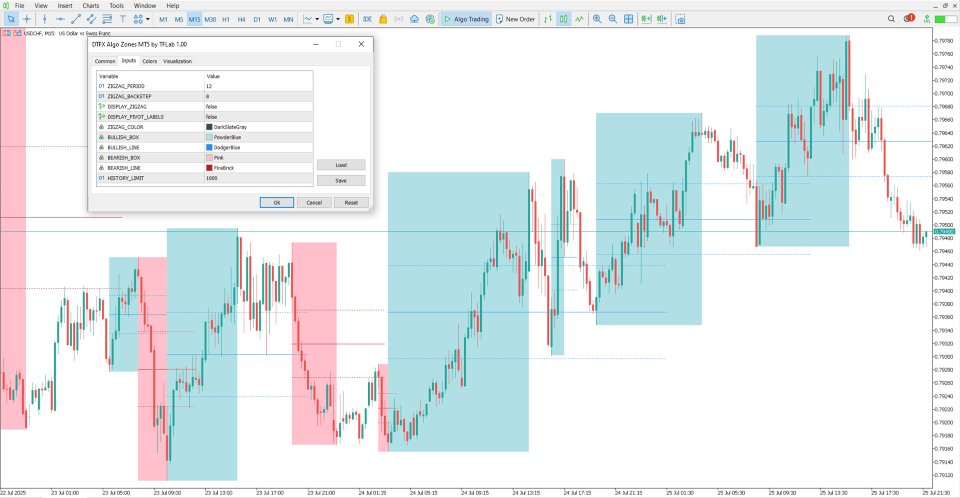
- ZIGZAG PERIOD – Controls the Zigzag Period
- ZIGZAG BACKSTEP – Adjusts the Zigzag Backstep
- DISPLAY ZIGZAG – On/Off for Zigzag display
- DISPLAY PIVOT LABELS – On/Off for Pivot labels
- ZIGZAG COLOR – Set Zigzag color
- BULLISH BOX – Define Bullish Box appearance
- BULLISH LINE – Set Bullish Line style
- BEARISH BOX – Define Bearish Box appearance
- BEARISH LINE – Set Bearish Line style
- HISTORY LIMIT – Limit historical zone display
Conclusion
The DTFX Algo Zones Indicator offers traders an effective way to identify supply and demand areas with high reversal potential by blending market structure, Fibonacci confluence, and price action principles. Thanks to its clear visual presentation and intelligent filtering, it isolates the most relevant trading zones without overcrowding the chart.
