KT Supply and Demand MT4
- Indicateurs
-
KEENBASE SOFTWARE SOLUTIONS
 Keenbase Trading développe des indicateurs professionnels et des Expert Advisors pour MetaTrader 4 et MetaTrader 5 afin d'aider les traders à prendre des décisions de trading plus éclairées.
 - Version: 1.0
- Activations: 10
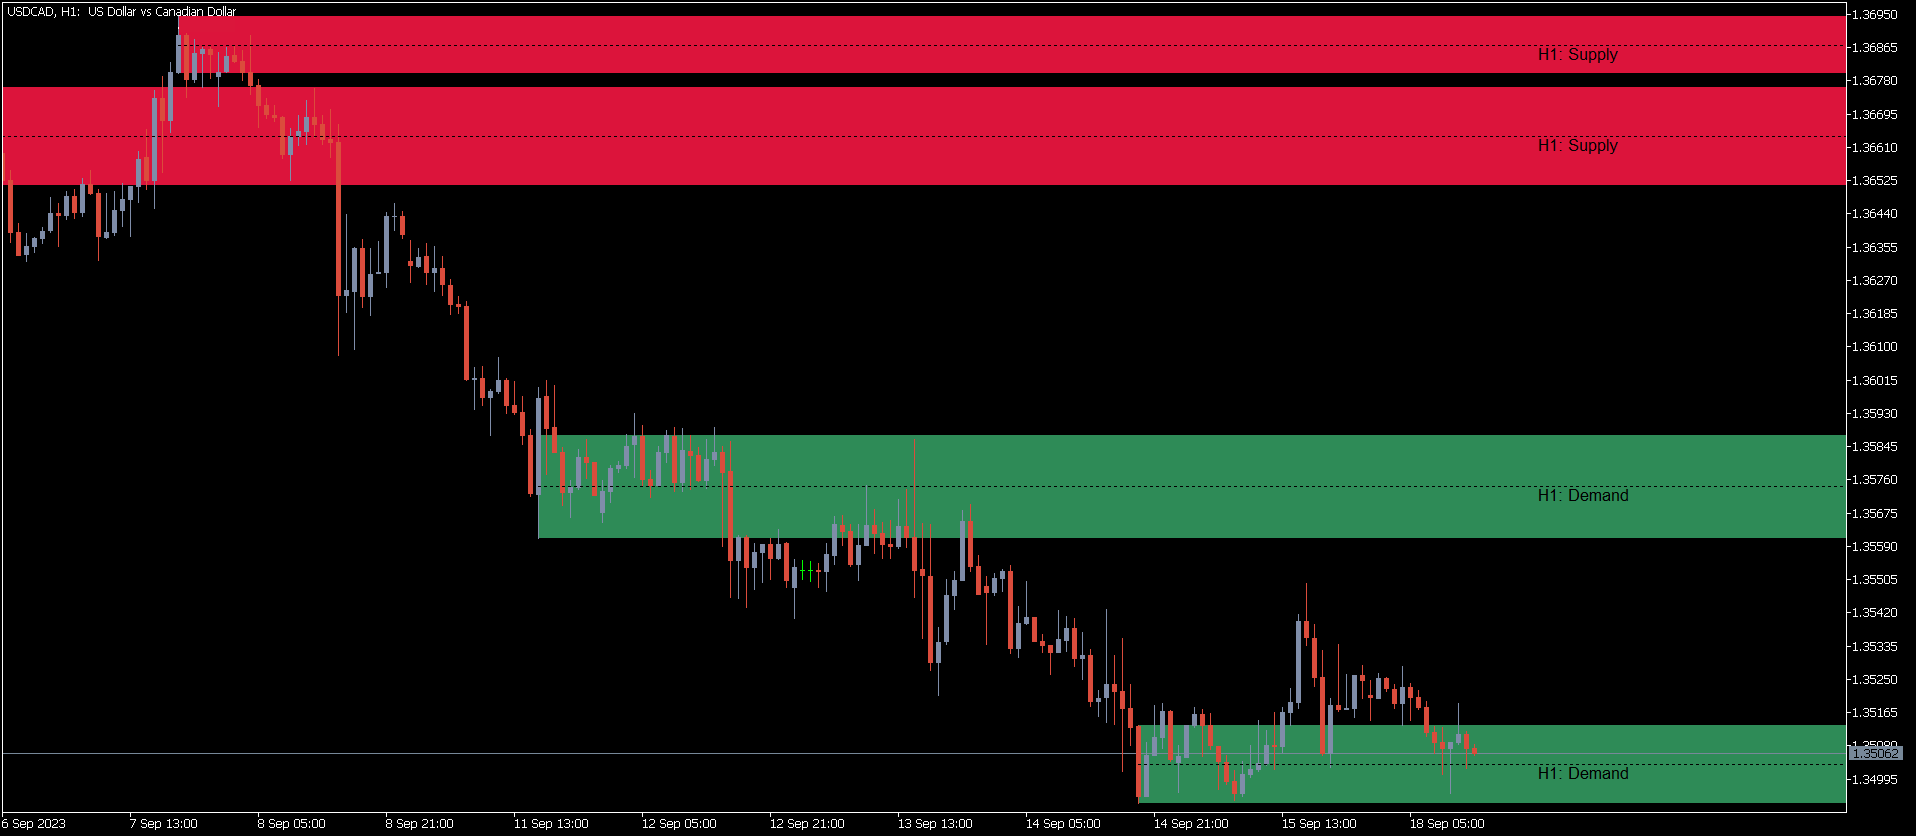
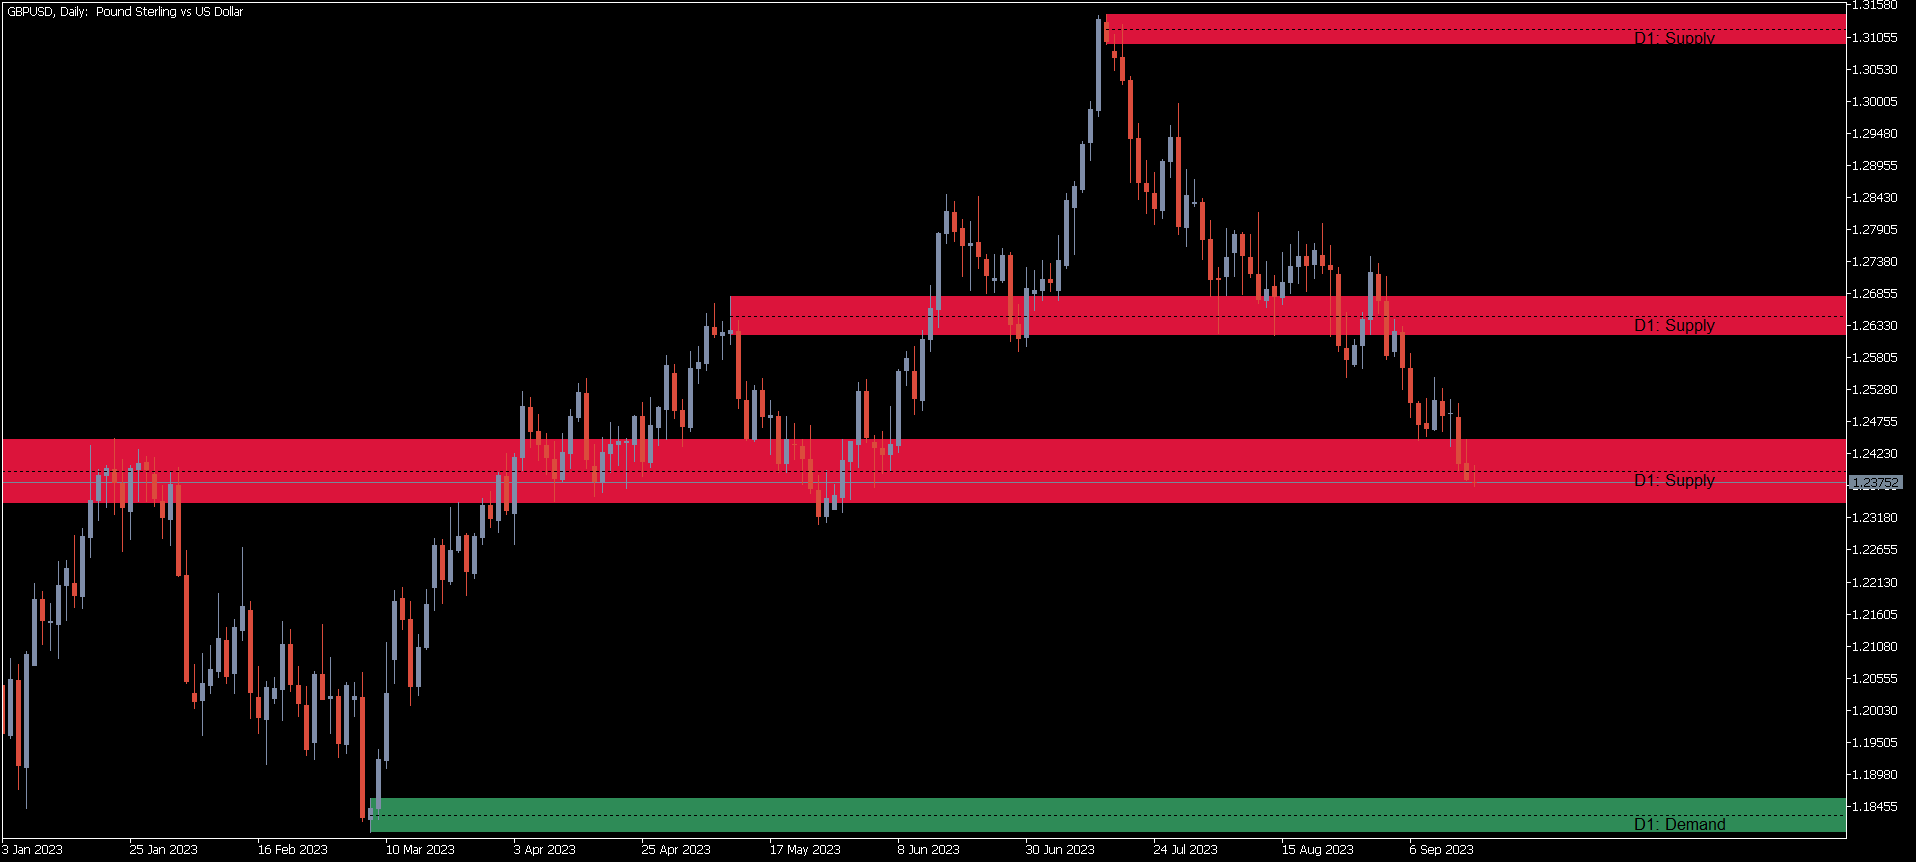
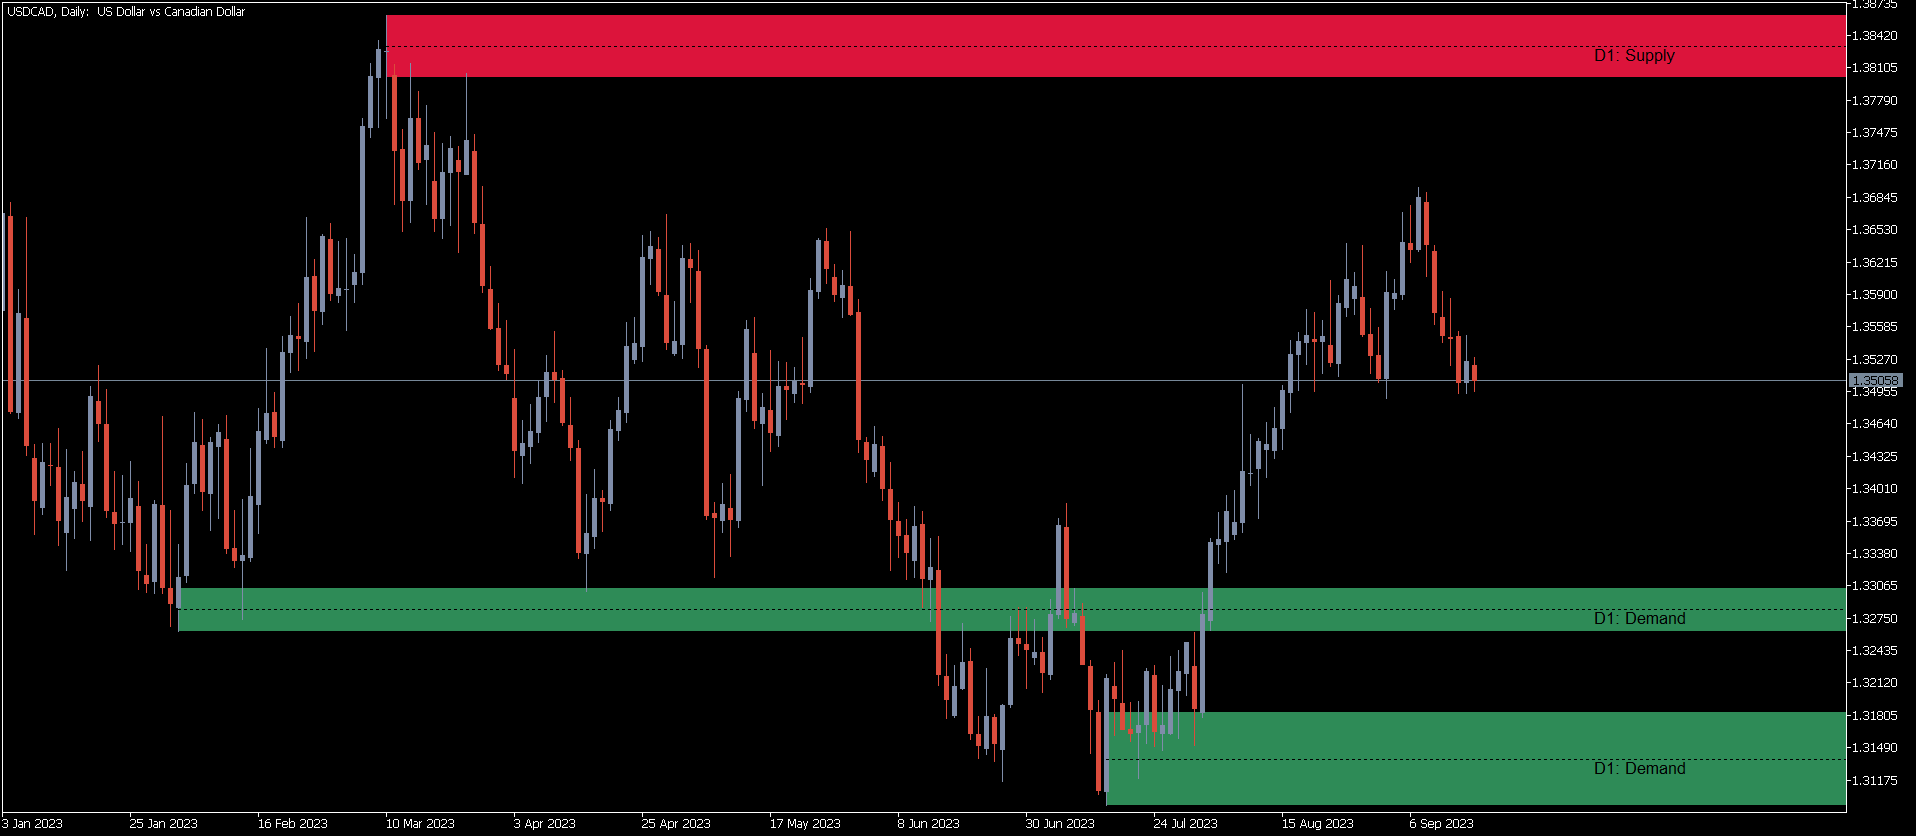
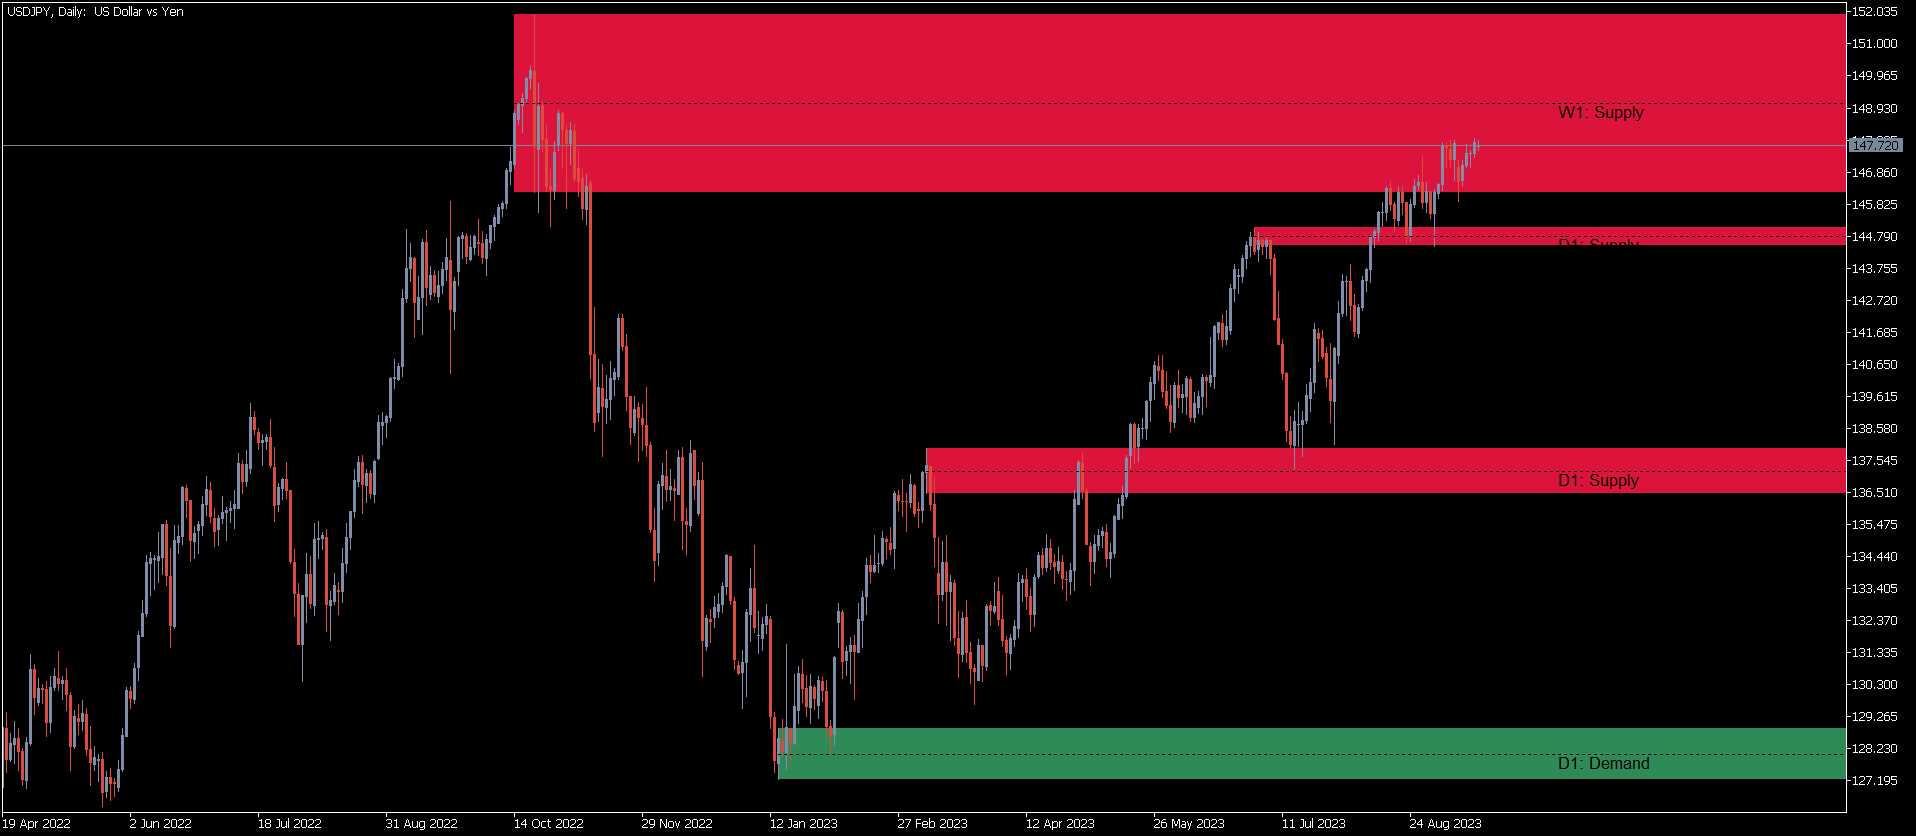
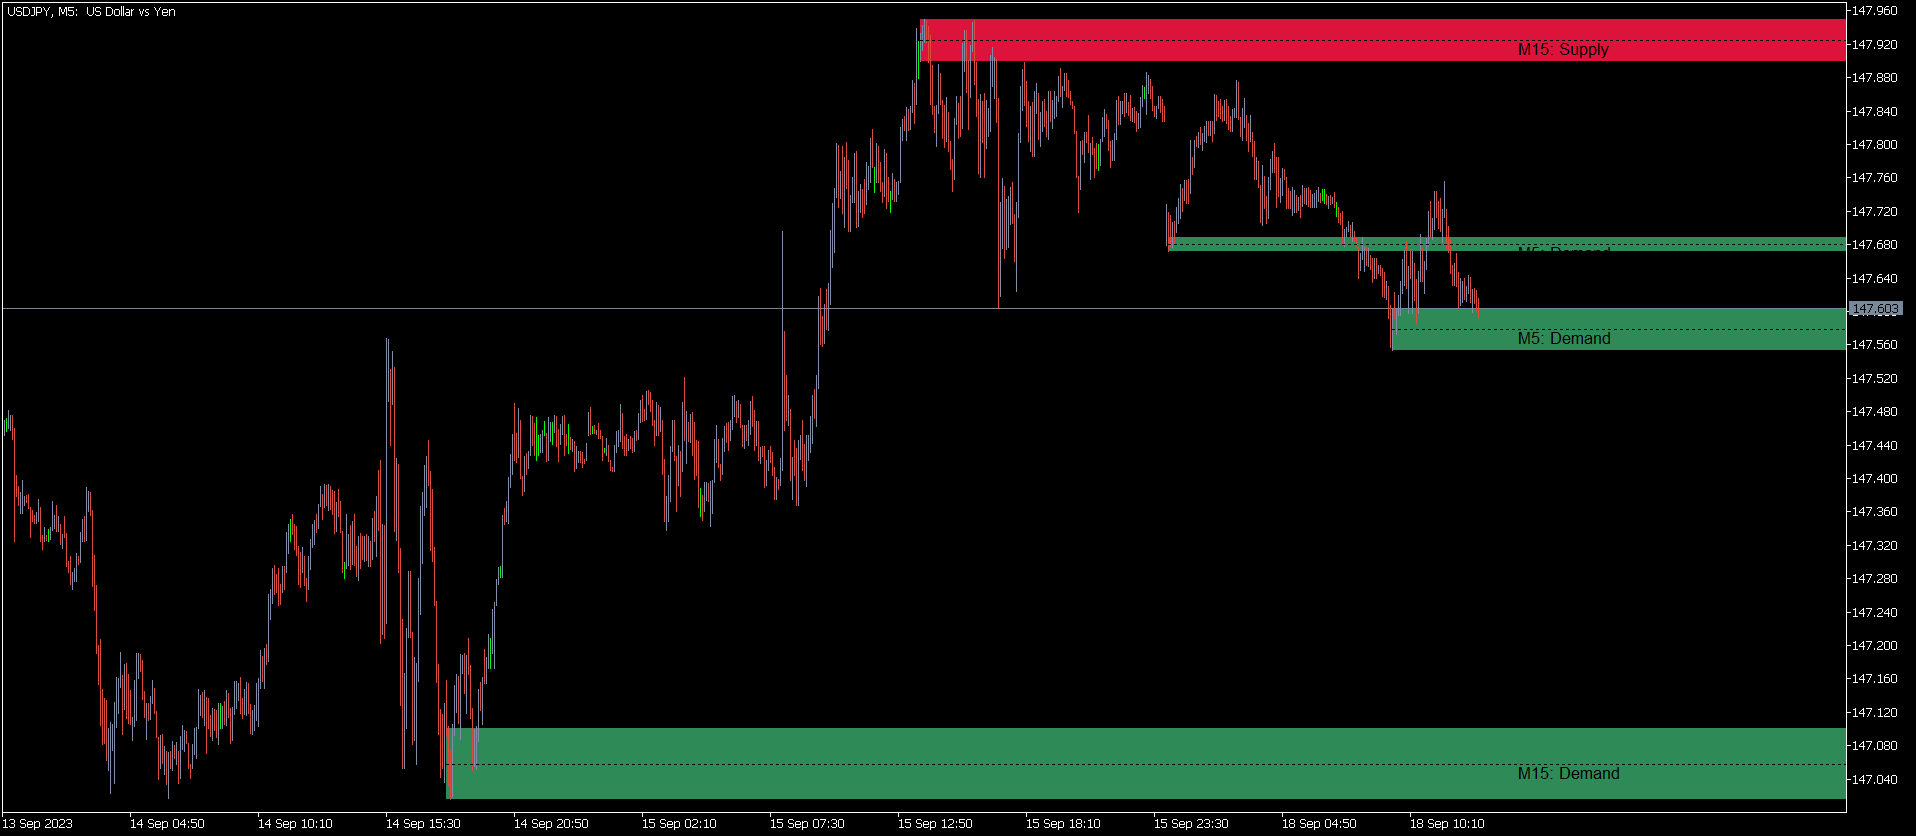
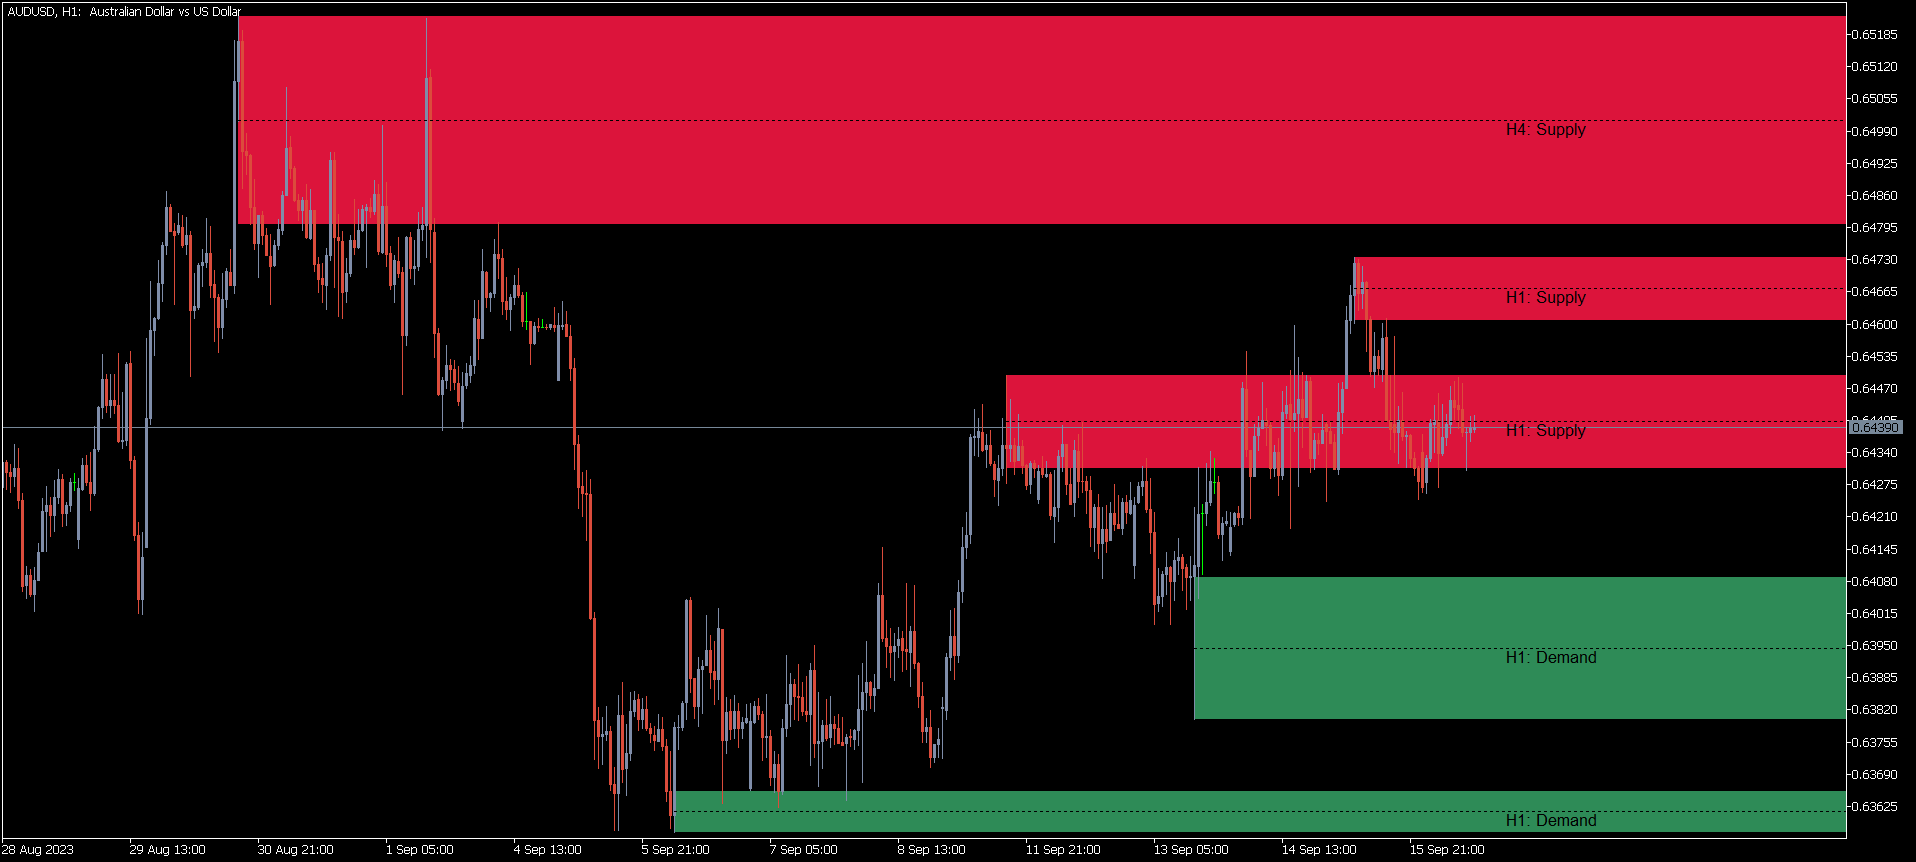
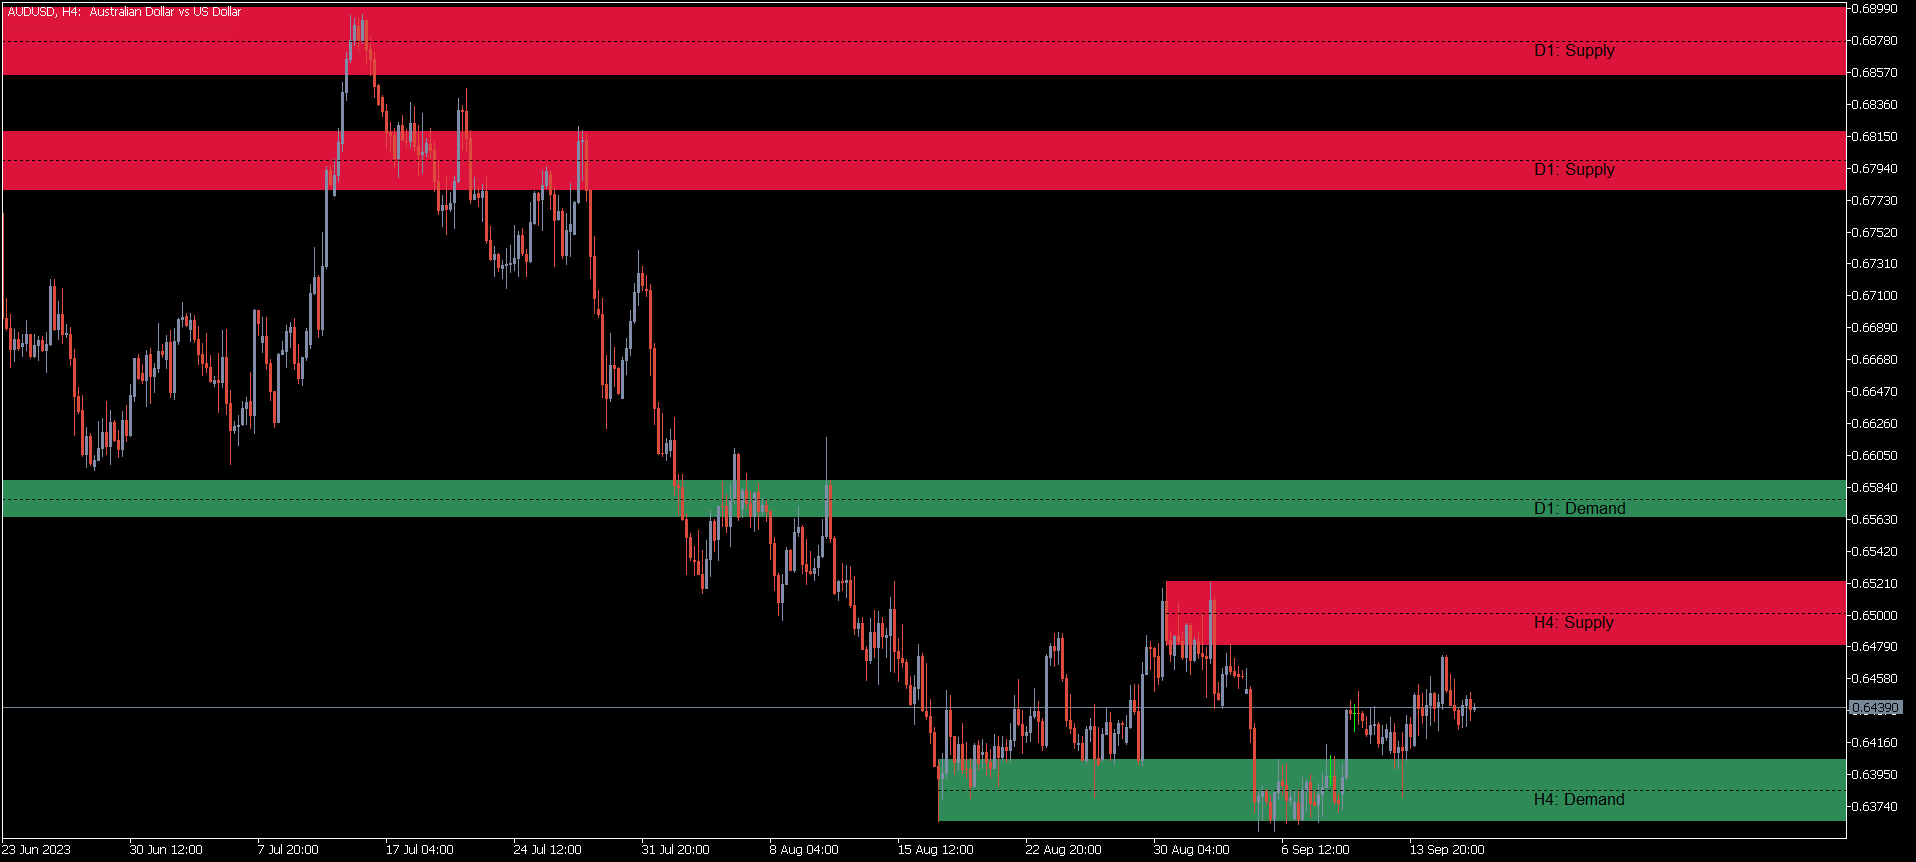
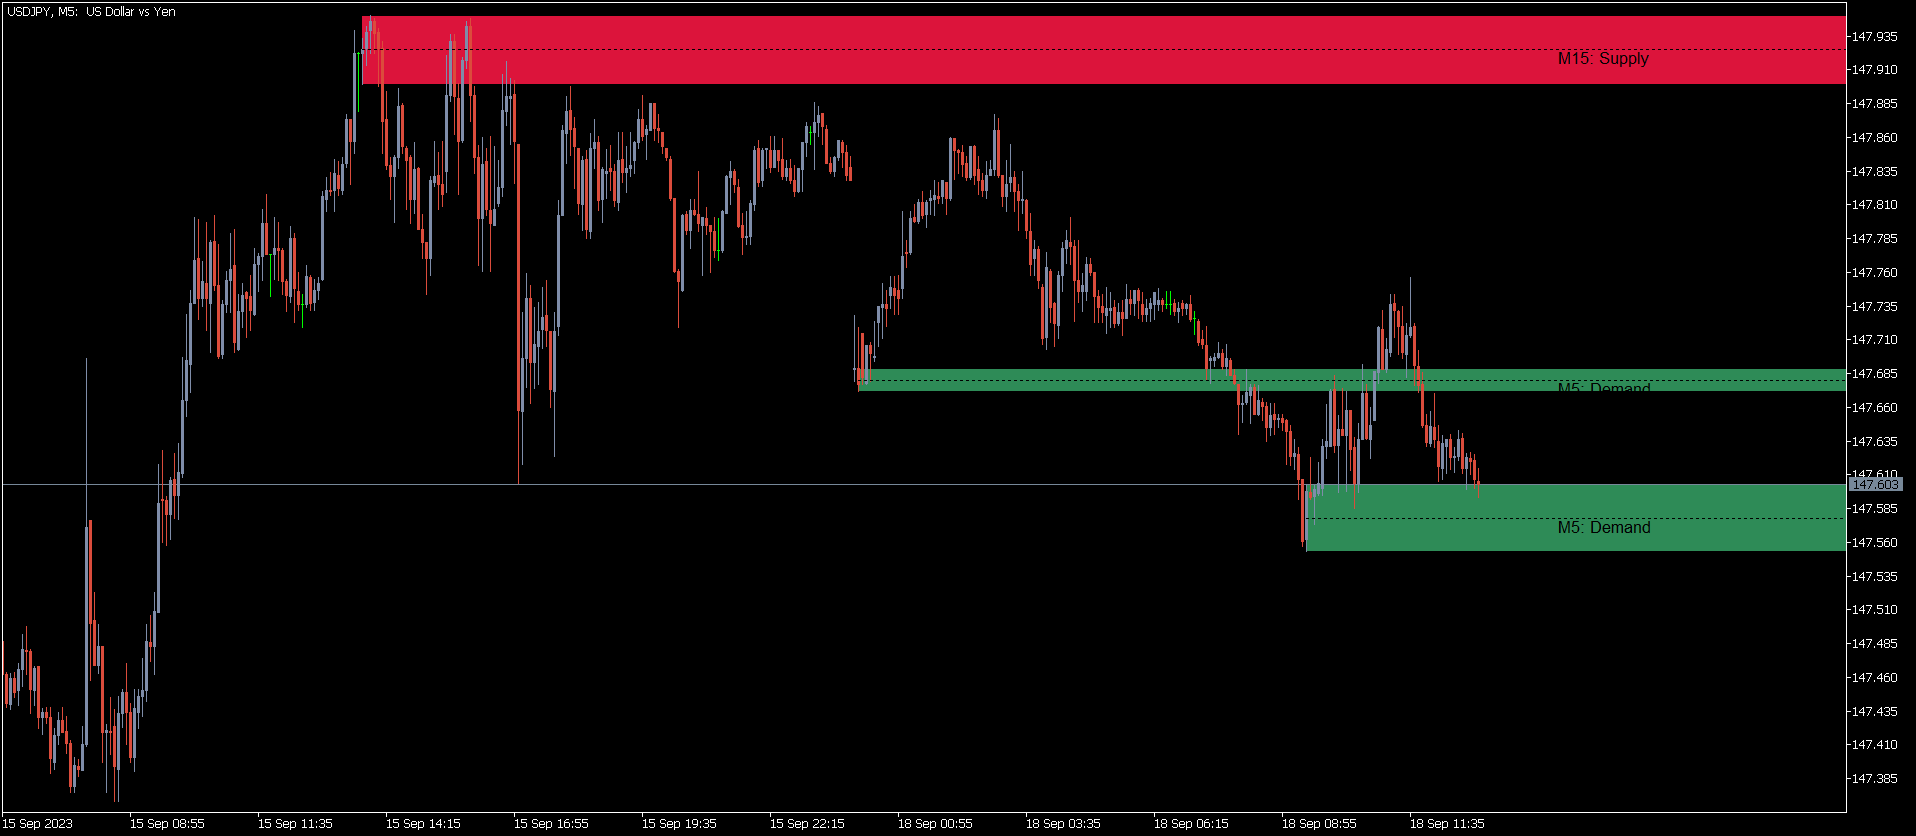
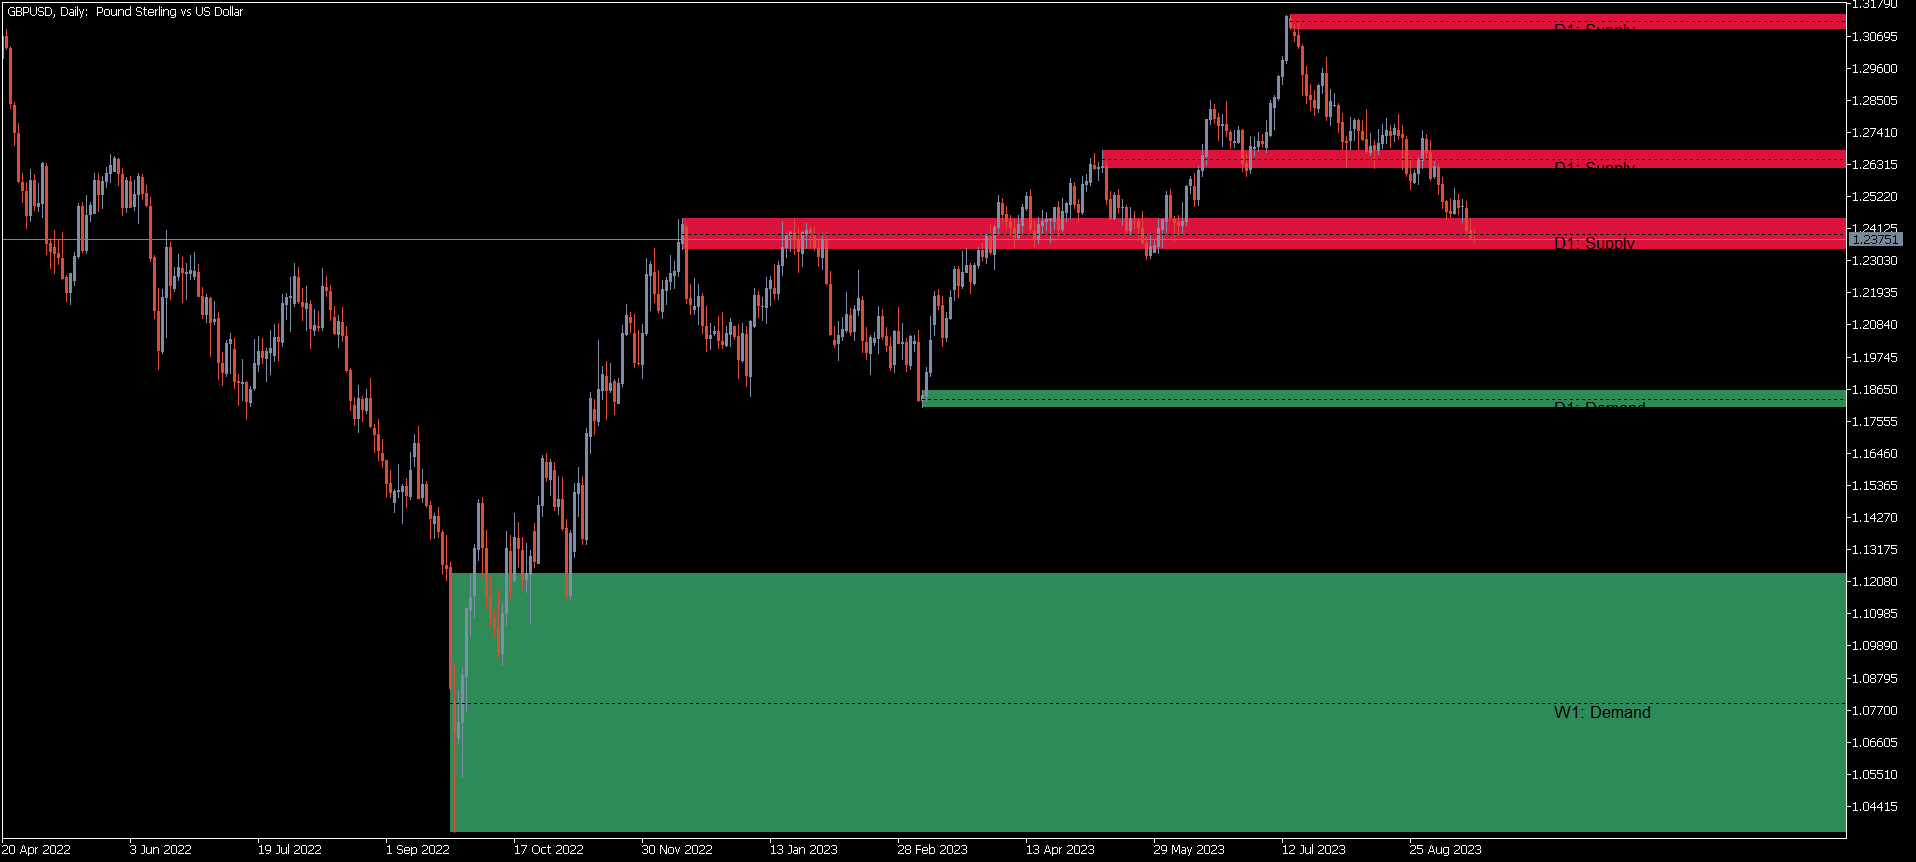
L’indicateur KT Supply and Demand repère et trace les principales zones d’offre et de demande. Il analyse les points de retournement et intègre une lecture multi-unités de temps afin de ne mettre en évidence que les zones vraiment décisives.
Cette approche avancée souligne les régions où le prix est susceptible de se retourner, issues des déséquilibres récents entre offre et demande.
Fonctionnalités
- Analyse précise : L’algorithme amélioré détecte avec exactitude les zones essentielles, souvent annonciatrices de grands mouvements.
- Vue complète du marché : Affiche les zones sur trois unités de temps maximum pour une perspective globale.
- Graphique épuré : Évite le chevauchement des zones et garde le graphique lisible.
- Template intégré : Un modèle de graphique préconfiguré s’associe parfaitement à l’indicateur.
- Puissance prédictive : Une marque distinctive dans chaque zone aide à anticiper les retournements potentiels.
- Couleurs adaptatives : Les couleurs des zones s’ajustent facilement au mouvement du prix.
- Personnalisation : Large choix sur l’intensité, la couleur et l’épaisseur des zones.
- Alertes actives : Pop-ups, notifications mobiles, emails et sons se déclenchent lorsque le prix s’approche d’une zone.
Applications
Maîtrise du timing : Exploitez l’indicateur pour cibler les zones clés et, grâce aux alertes, soignez l’exécution des entrées et sorties.
Renforcement de l’analyse technique : Les zones nettes servent de repères pour supports, résistances, stops, objectifs et cassures.
Gestion du risque : Identifier les zones d’achats ou ventes intenses aide à affiner les paramètres de risque et à filtrer le bruit.
Stratégies variées : Convient aux traders de tendance comme de swing en améliorant la prévisibilité des mouvements à court et moyen terme.
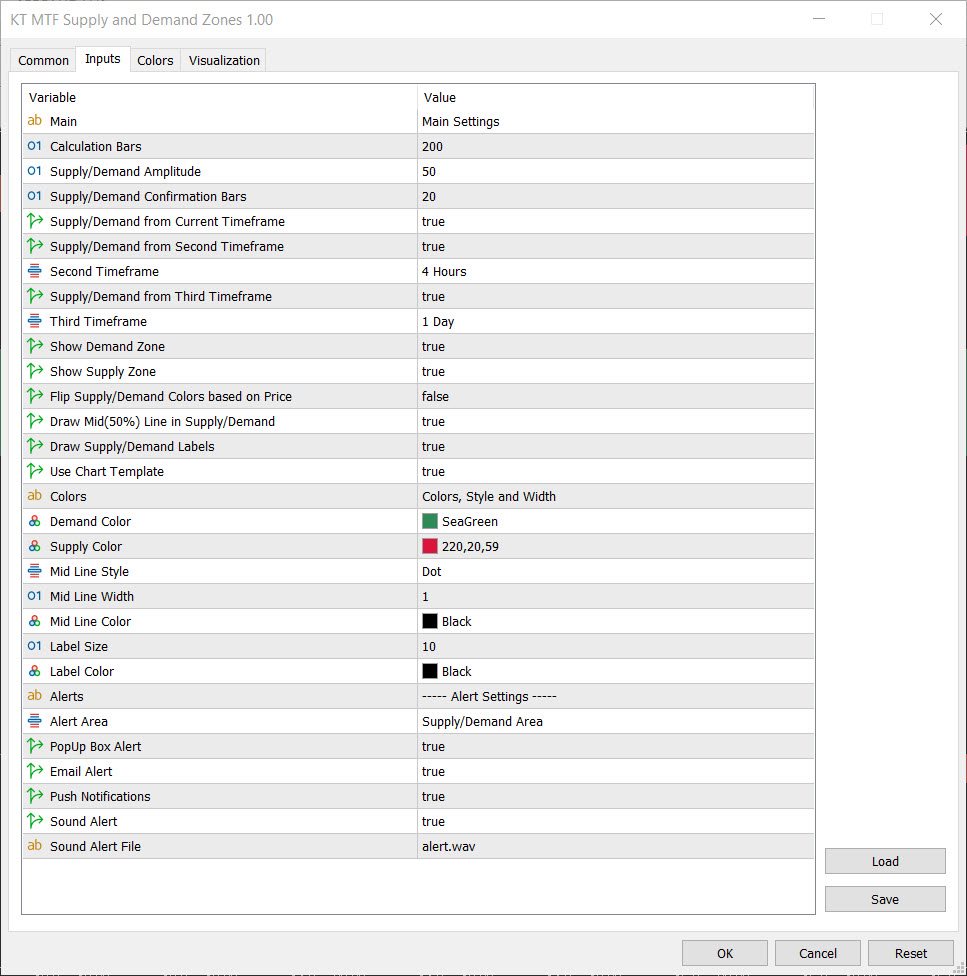
Paramètres d’entrée
- Barres de calcul : Nombre de barres analysées ; les plus récentes pèsent davantage.
- Amplitude offre/demande : Grande valeur = moins de zones mais plus nettes.
- Barres de confirmation : Plus de barres = zone plus forte.
- Zones de l’unité actuelle : Afficher celles du graphique en cours.
- Zones d’une deuxième ou troisième unité : Afficher celles d’autres unités choisies.
- Afficher offre ou demande : Choisir le type de zone.
- Inverser les couleurs selon le prix : Les couleurs évoluent avec le prix.
- Ligne médiane 50 % : Tracer la ligne centrale de chaque zone.
- Utiliser le template : Appliquer le modèle spécialement conçu pour cet indicateur.