KT Supply and Demand MT4

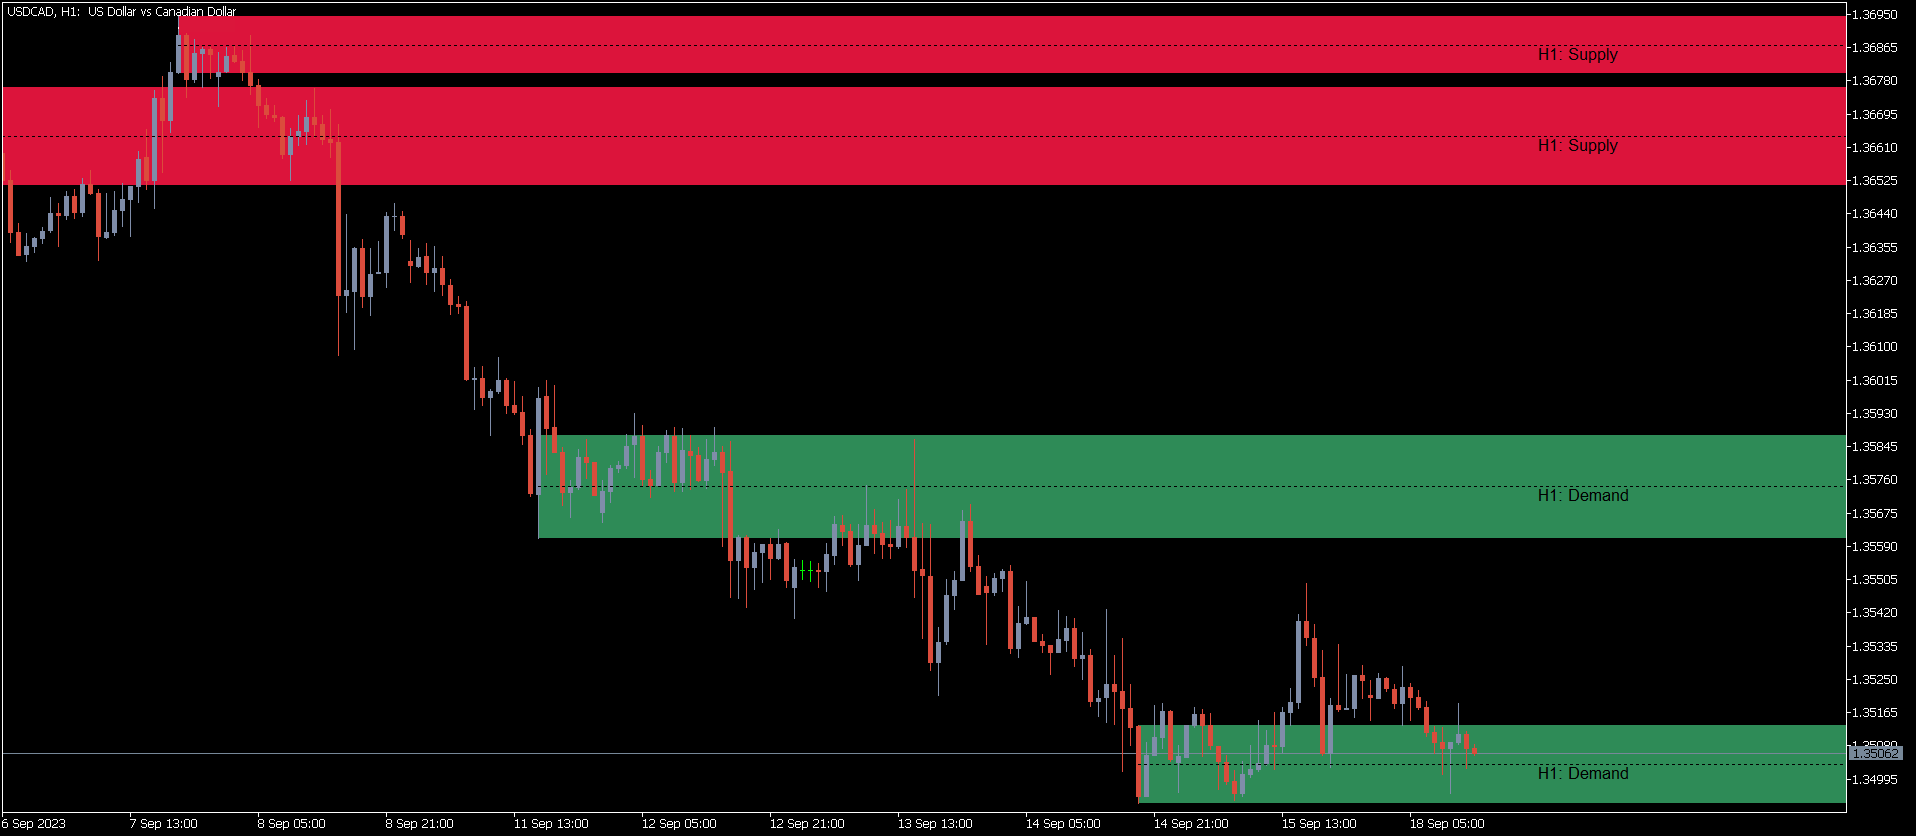
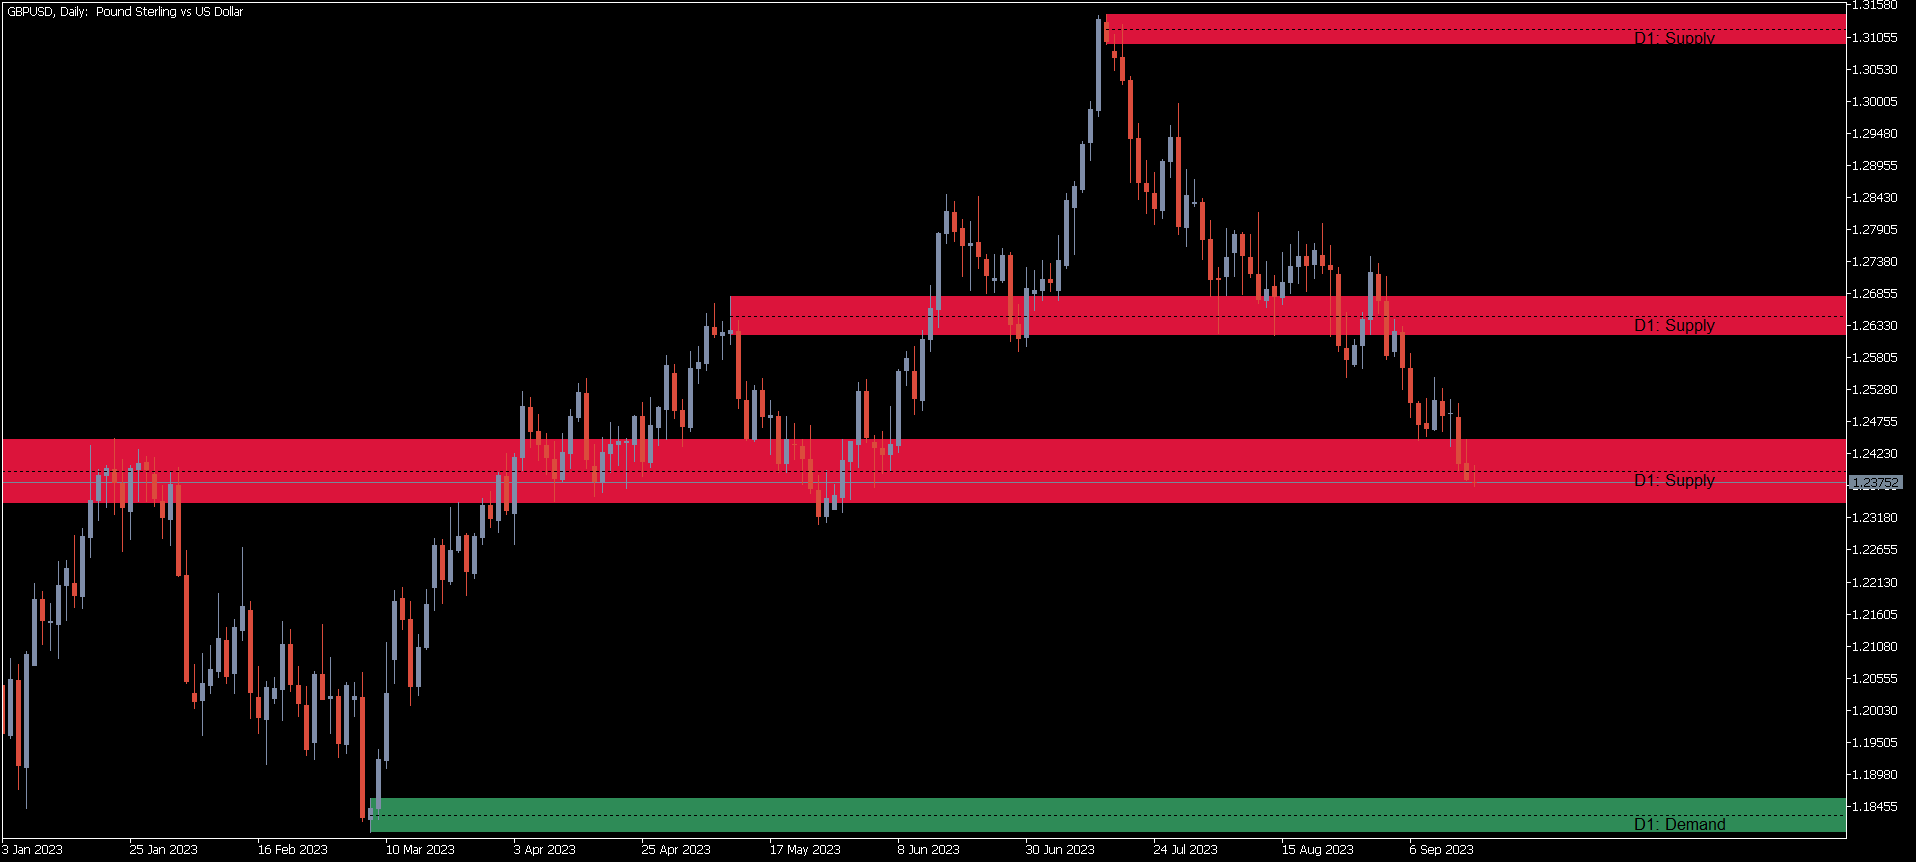
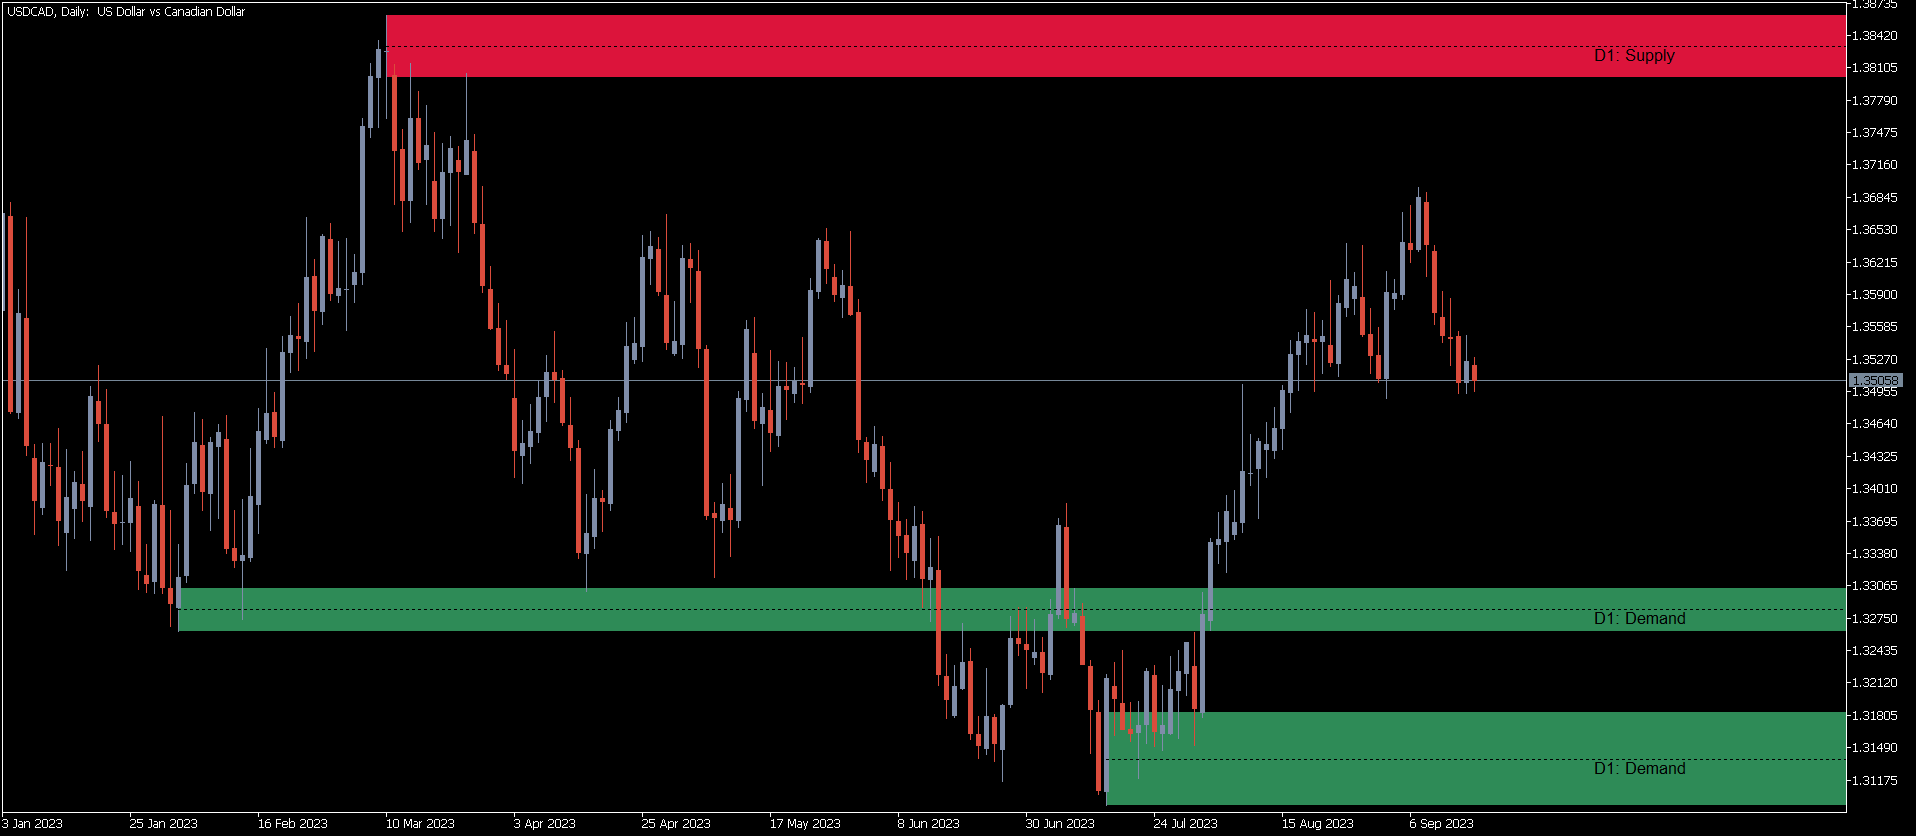
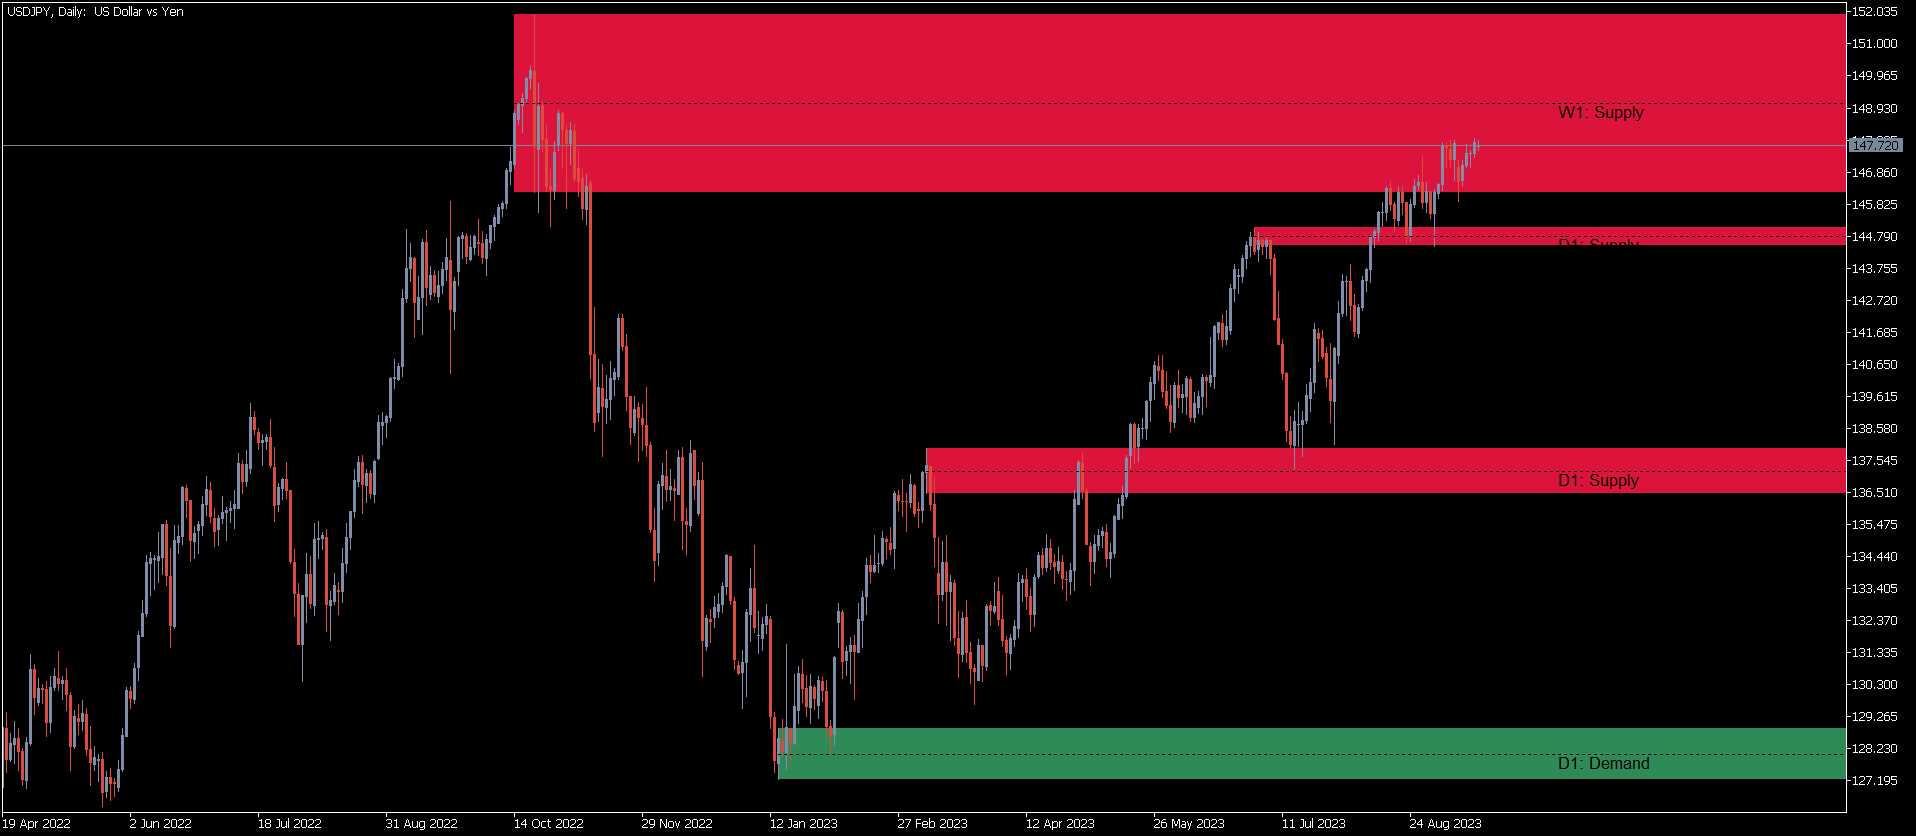
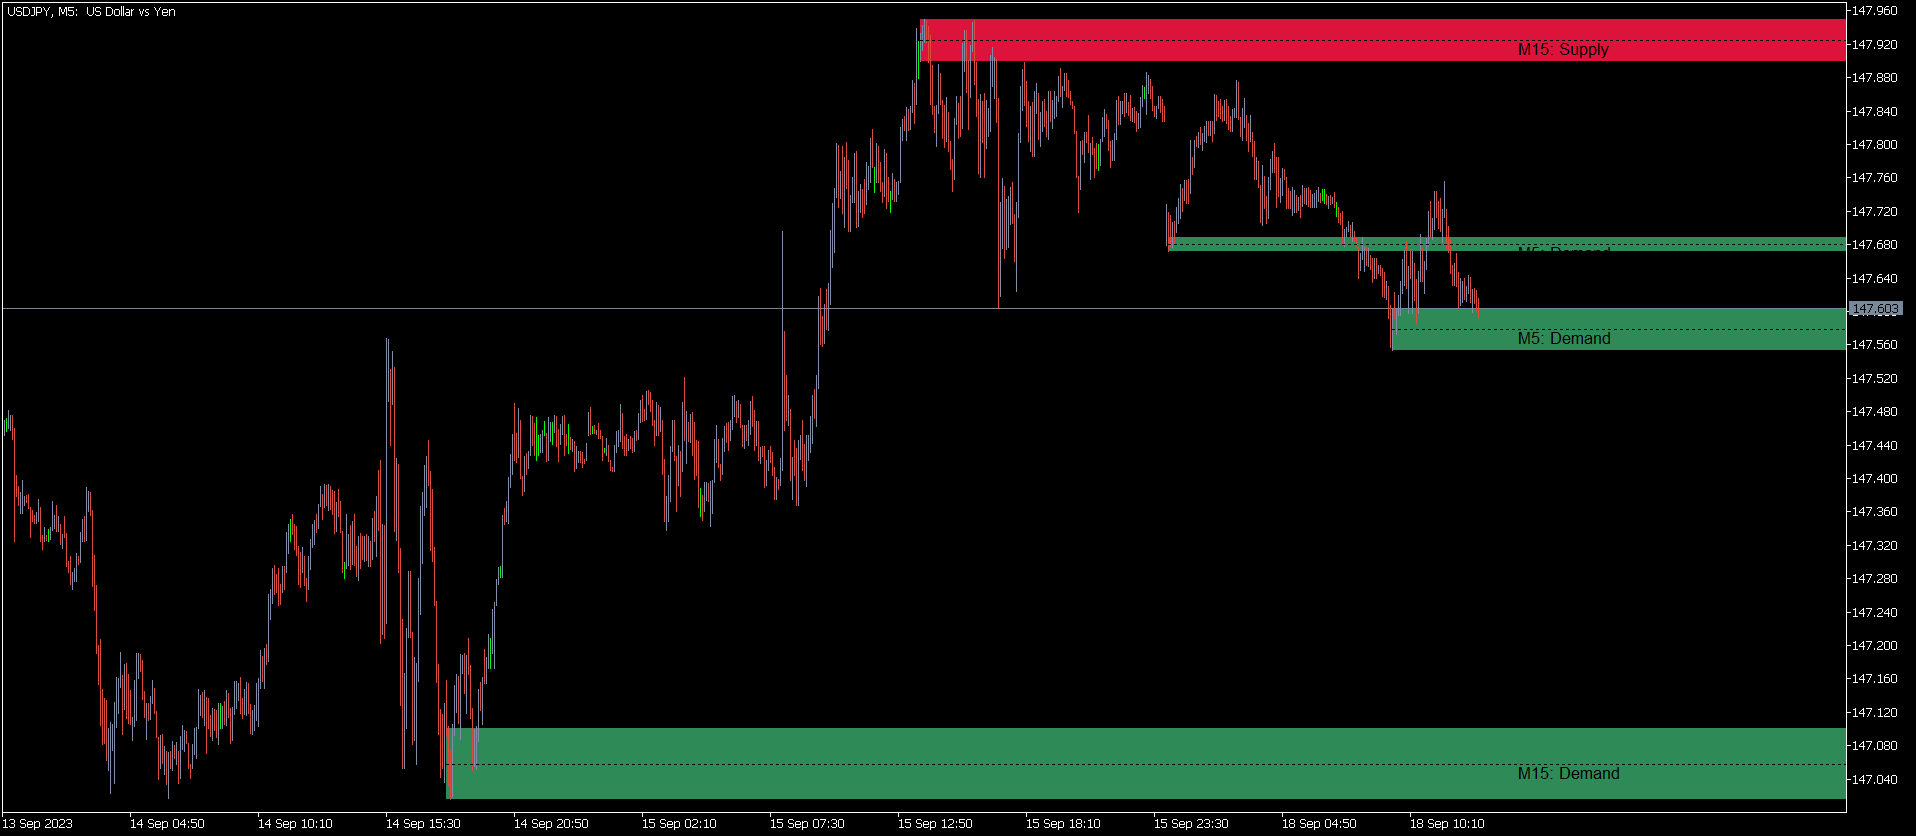
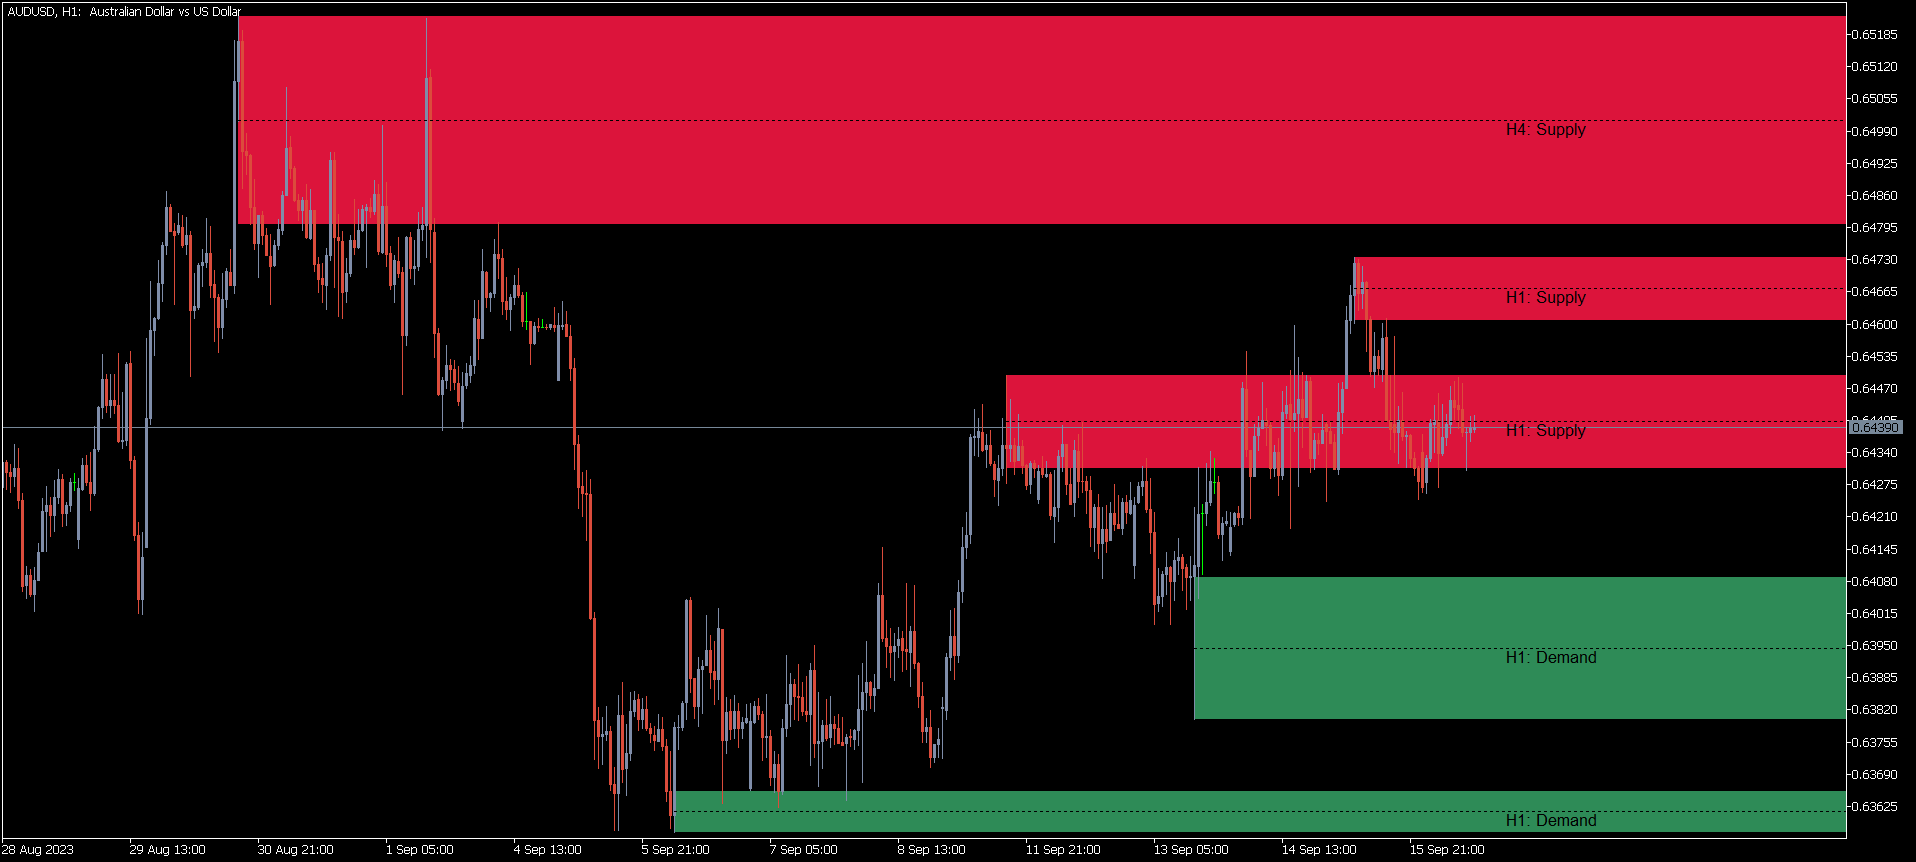
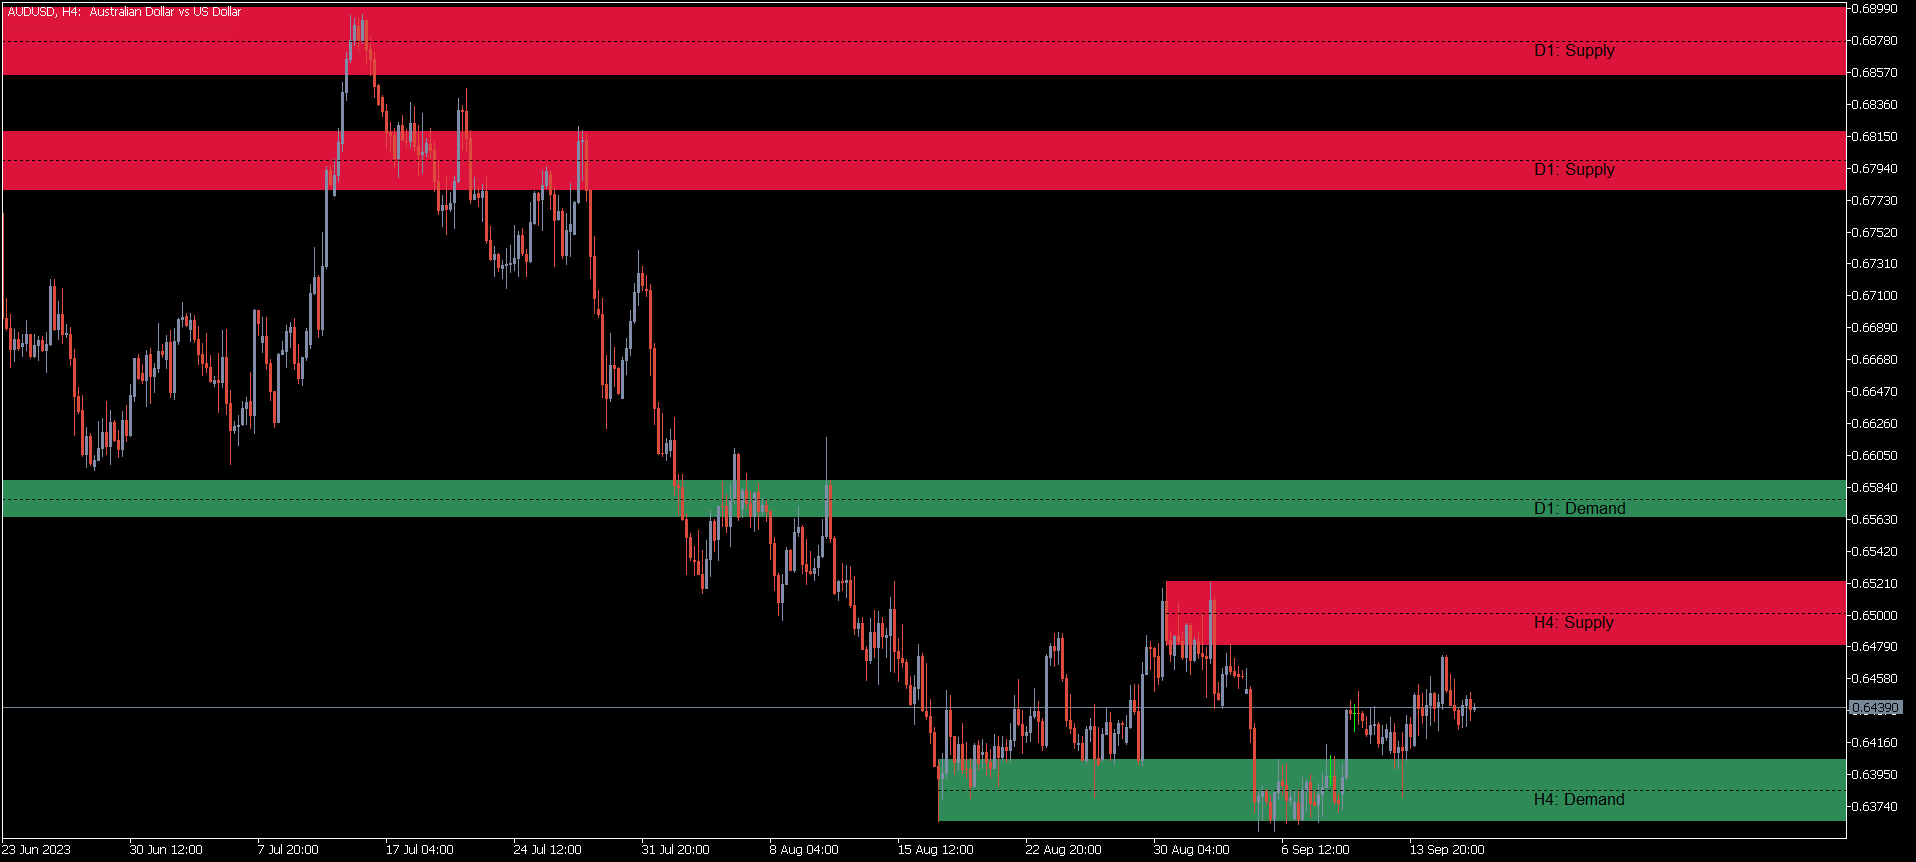
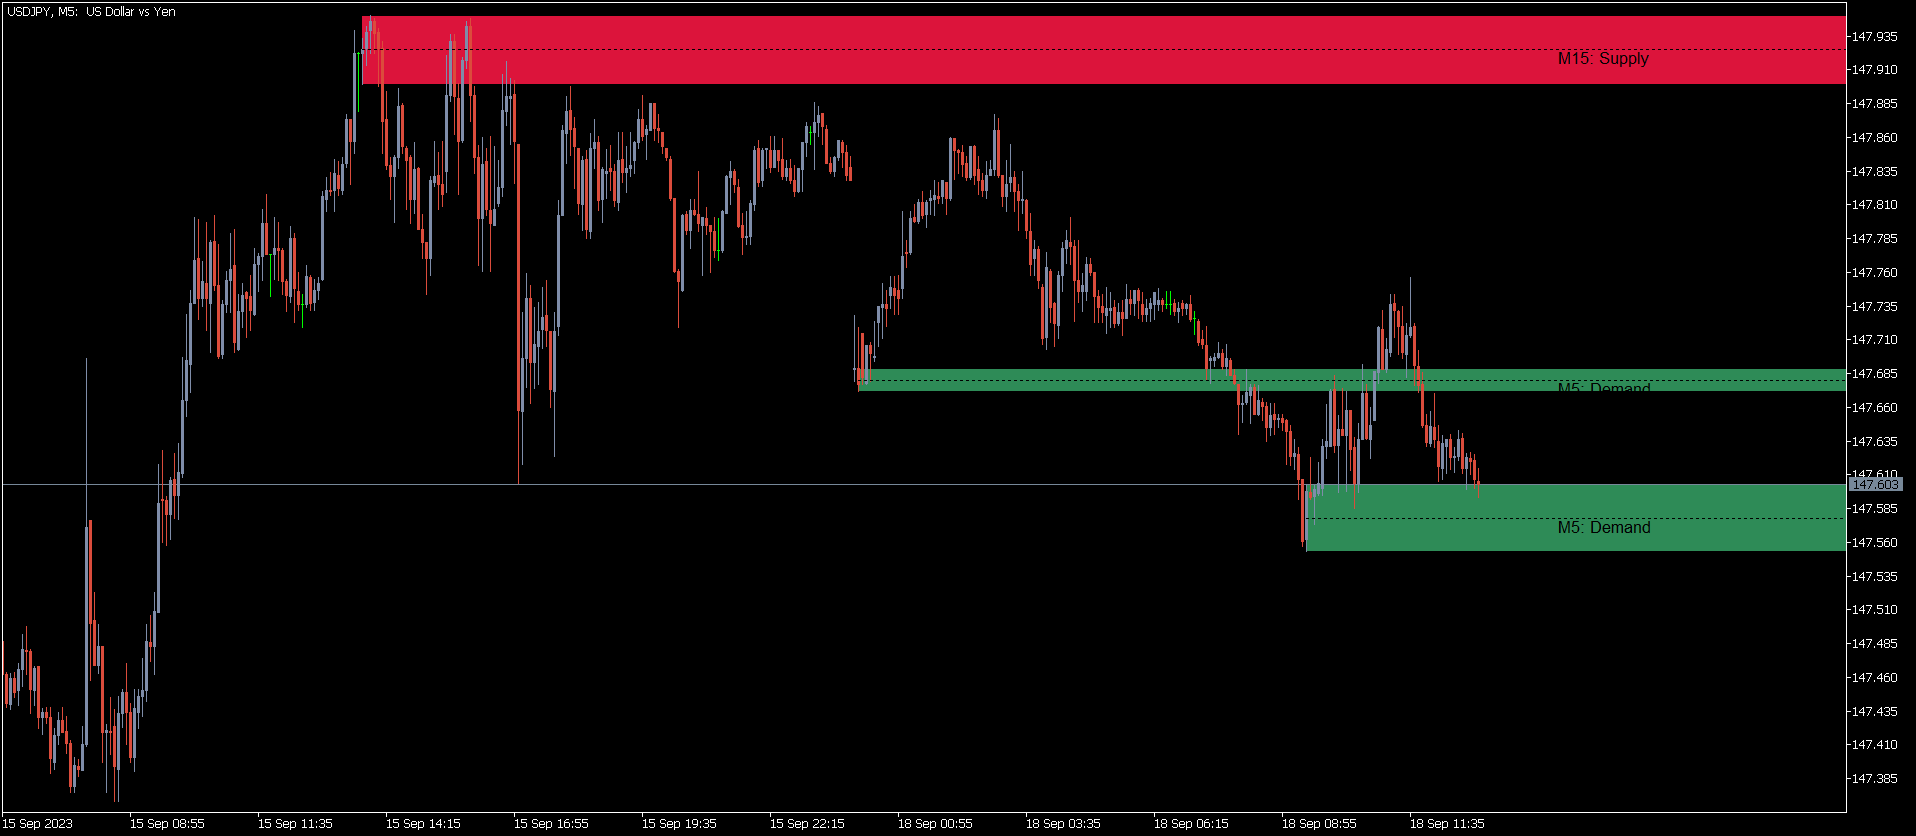
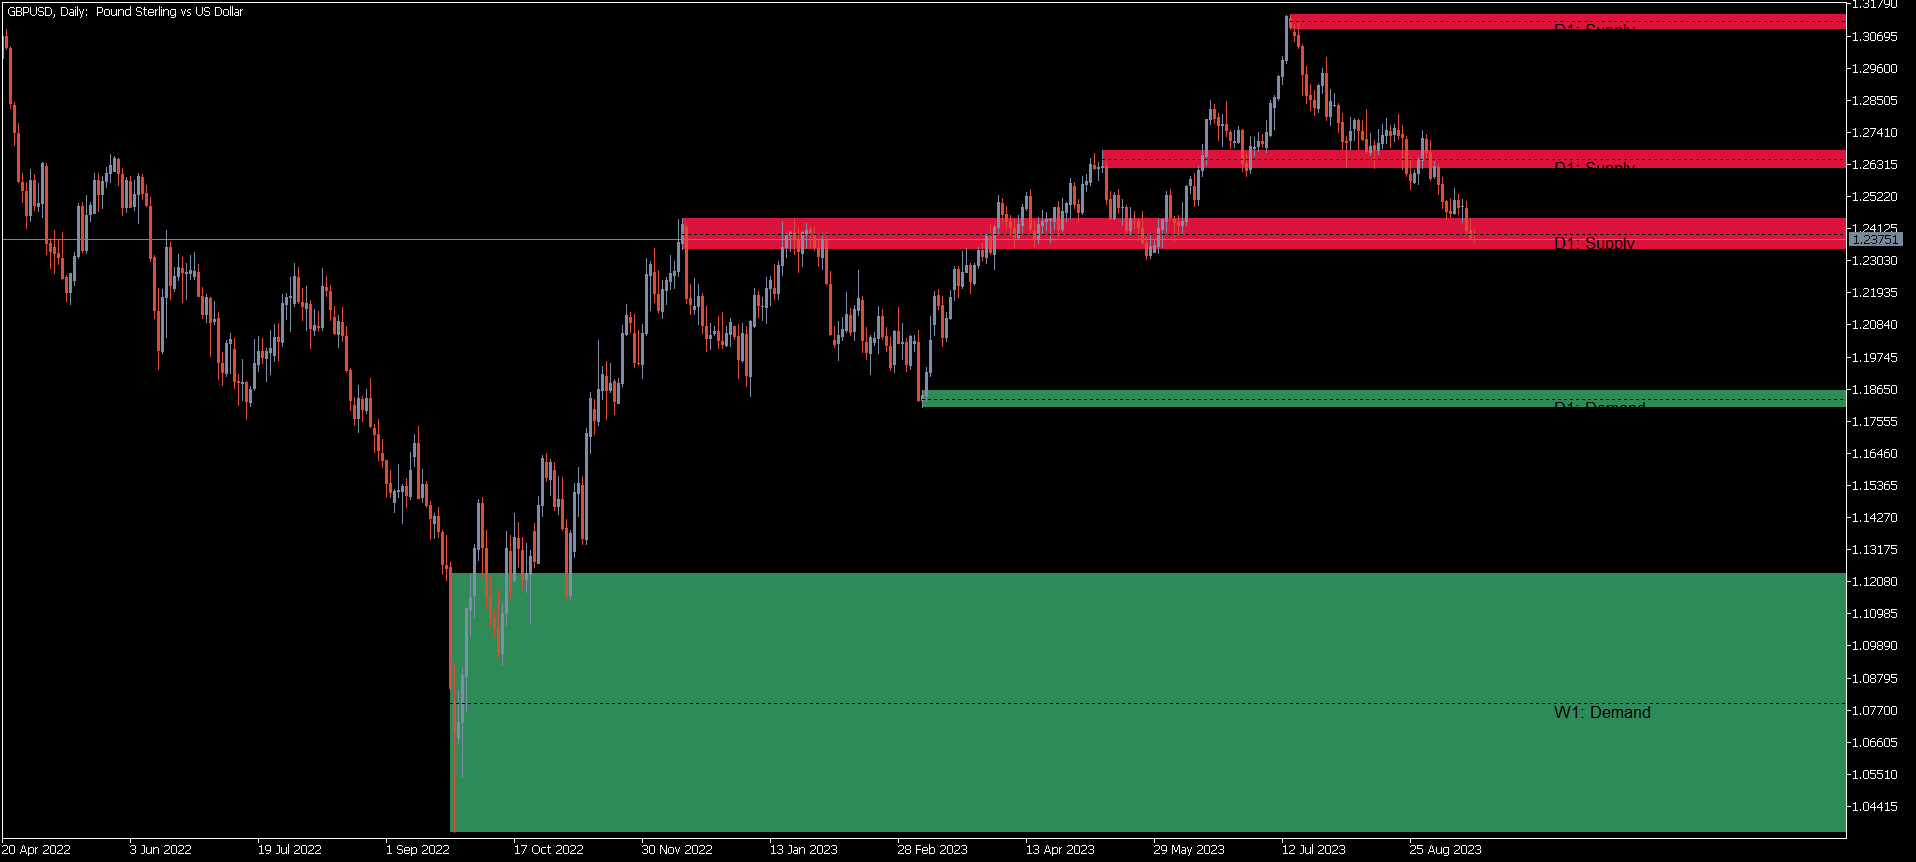
KT Supply and Demand göstergesi, kritik arz ve talep bölgelerini tespit edip çizer. Swing noktalarını analiz eder ve çoklu zaman dilimi incelemesiyle birleştirerek yalnızca en önemli bölgeleri vurgular.

Bu gelişmiş yöntem, son fiyat hareketlerinin oluşturduğu belirgin arz-talep dengesizliğinden kaynaklanan muhtemel dönüş bölgelerini öne çıkarır.

Özellikler

  • Keskin analiz: Geliştirilmiş algoritma, büyük fiyat hareketlerini işaret eden kritik bölgeleri tam isabetle saptar.
  • Kapsamlı piyasa bakışı: Üç zaman dilimine kadar bölgeleri gösterir, böylece çoklu TF perspektifi sunar.
  • Düzenli grafik: Bölgelerin çakışmasını önler ve grafiği temiz tutar.
  • Entegre şablon: Göstergenin özellikleriyle uyumlu hazır bir grafik şablonu sunar.
  • Öngörü gücü: Her bölgede benzersiz bir işaret, olası fiyat dönüşlerini önceden ima eder.
  • Uyarlanabilir renkler: Bölgelerin renklerini fiyat hareketine göre esnek şekilde değiştirir.
  • Kişisel ayarlar: Bölge yoğunluğu, renk ve kalınlık gibi pek çok özelleştirme seçeneği sunar.
  • Aktif bildirimler: Ekran, mobil, e-posta ve ses uyarıları; fiyat bölgeye yaklaştığında tetiklenir.

Uygulamalar

Kesin işlem ve zamanlama: Bölgeleri takip edin, uyarılar sayesinde giriş-çıkış kararlarını en iyi anda verin.

Teknik analizi güçlendirme: Bölgeler destek-direnç, stop-loss, hedef ve dengesiz alıcı-satıcı durumlarında breakout tahmini için referanstır.

Risk ve işlem yönetimi: Yoğun alım-satım bölgelerini bilmek riski ayarlamayı kolaylaştırır.

Çeşitli stratejilere katkı: Trend ya da swing fark etmeksizin, gösterge kısa-orta vadeli hareketlerin öngörülebilirliğini ve kârlılığını artırır.

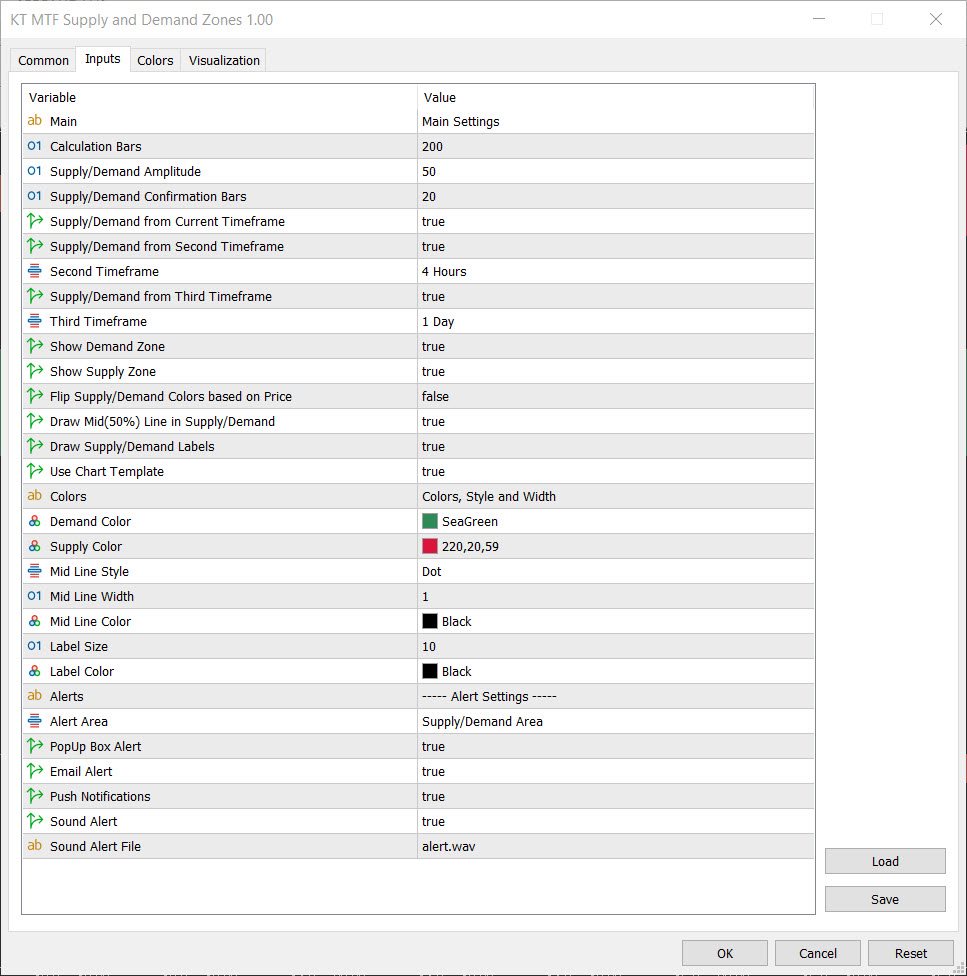
Göstergenin girişleri

  • Hesaplama çubukları: Bölgeleri bulmak için dikkate alınan çubuk sayısı; son çubuklar daha etkili.
  • Arz/Talep Genliği: Büyük değerler daha az ama net, küçük değerler daha çok bölge verir.
  • Onay çubukları: Çubuk sayısı arttıkça bölge gücü artar.
  • Mevcut zaman dilimi bölgeleri: Açık grafiğin bölgelerini göster.
  • İkinci/Üçüncü zaman dilimi bölgeleri: Seçilen diğer TF bölgelerini göster.
  • Sadece arz veya talep bölgeleri: Yalnızca istediğiniz türü görün.
  • Fiyata göre renk çevir: Açıkken, bölge renkleri fiyatla değişir.
  • Bölge ortası %50 çizgisi: Her bölgede orta çizgiyi çiz.
  • Grafik şablonunu kullan: Göstergeyle uyumlu özel şablonu uygula.
Önerilen ürünler
The Th3Eng PipFinite indicator is based on a very excellent analysis of the right trend direction with perfect custom algorithms. It show the true direction and the best point to start trading. With StopLoss point and Three Take Profit points. Also it show the right pivot of the price and small points to order to replace the dynamic support and resistance channel, Which surrounds the price. And Finally it draws a very helpful Box on the left side on the chart includes (take profits and Stop loss
Infinity Trend Pro
Yaroslav Varankin
1 (1)
This is a trend indicator without redrawing Developed instead of the binary options strategy (by the color of the Martingale candlestick) Also works well in forex trading When to open trades (binary options) A signal will appear in the place with a candle signaling the current candle It is recommended to open a deal for one candle of the current timeframe M1 and M5 When a blue dot appears, open a deal up When a red dot appears, open a trade down. How to open trades on Forex. When a signal is rec
Noize Absorption Index MT4
Ekaterina Saltykova
5 (1)
Noize Absorption Index - is the manual trading system that measures the difference of pressure between bears forces and bulls forces. Green line - is a noize free index that showing curent situation. Zero value of index shows totally choppy/flat market.Values above zero level shows how powerfull bullish wave is and values below zero measures bearish forces.Up arrow appears on bearish market when it's ready to reverse, dn arrow appears on weak bullish market, as a result of reverse expectation. S
SMC Venom Model BPR göstergesi, Akıllı Para (SMC) konseptinde çalışan yatırımcılar için profesyonel bir araçtır. Fiyat grafiğinde iki temel modeli otomatik olarak belirler: FVG   (Adil Değer Açığı), ilk ve üçüncü mum arasında boşluk bulunan üç mumun birleşimidir. Hacim desteğinin olmadığı seviyeler arasında bir bölge oluşturur ve bu da sıklıkla fiyat düzeltmesine yol açar. BPR   (Dengeli Fiyat Aralığı), bir "köprü" oluşturan iki FVG modelinin birleşimidir - bir kırılma bölgesi ve fiyatın düşük
Bu, bir mumun kapanış fiyatını tahmin eden bir göstergedir. Gösterge öncelikle D1 çizelgelerinde kullanılmak üzere tasarlanmıştır. Bu gösterge hem geleneksel forex ticareti hem de ikili opsiyon ticareti için uygundur. Gösterge, bağımsız bir ticaret sistemi olarak kullanılabilir veya mevcut ticaret sisteminize ek olarak hareket edebilir. Bu gösterge, mevcut mumu analiz ederek mumun gövdesi içindeki belirli güç faktörlerini ve önceki mumun parametrelerini hesaplar. Böylece gösterge, piyasa hareket
Super Reversal Pattern
Parfait Mujinga Ndalika
Super Reversal Pattern Indicator Unlock the power of advanced pattern recognition with our Super Reversal Pattern Indicator. Designed for traders seeking precision and reliability, this indicator identifies one of the most effective reversal patterns in technical analysis, offering a significant edge in your trading strategy. Key Features: Non-Repainting Accuracy: Enjoy the confidence of non-repainting technology. Once a Super Reversal Pattern is detected, it remains static, providing consiste
VR Cub
Vladimir Pastushak
VR Cub , yüksek kaliteli giriş noktaları elde etmenin bir göstergesidir. Gösterge, matematiksel hesaplamaları kolaylaştırmak ve bir pozisyona giriş noktalarının aranmasını basitleştirmek için geliştirildi. Göstergenin yazıldığı ticaret stratejisi uzun yıllardan beri etkinliğini kanıtlamaktadır. Ticaret stratejisinin basitliği, acemi yatırımcıların bile başarılı bir şekilde ticaret yapmasına olanak tanıyan büyük avantajıdır. VR Cub, pozisyon açılış noktalarını ve Kâr Al ve Zararı Durdur hedef sev
Trendiness Index
Libertas LLC
5 (3)
"The trend is your friend" is one of the best known sayings in investing, because capturing large trendy price movements can be extremely profitable. However, trading with the trend is often easier said than done, because many indicators are based on price reversals not trends. These aren't very effective at identifying trendy periods, or predicting whether trends will continue. We developed the Trendiness Index to help address this problem by indicating the strength and direction of price trend
Alpha Trend sign has been a very popular trading tool in our company for a long time. It can verify our trading system and clearly indicate trading signals, and the signals will not drift. Main functions: Based on the market display of active areas, indicators can be used to intuitively determine whether the current market trend belongs to a trend market or a volatile market. And enter the market according to the indicator arrows, with green arrows indicating buy and red arrows indicating se
Trend Osilatörü - gelişmiş bir özel Crypto_Forex göstergesi, etkili bir ticaret aracıdır! - Gelişmiş yeni hesaplama yöntemi kullanılır - "Hesaplama için fiyat" parametresi için 20 seçenek. - Şimdiye kadar geliştirilen en akıcı osilatör. - Yükselen trendler için yeşil renk, düşen trendler için kırmızı renk. - Aşırı satım değerleri: 5'in altında, Aşırı alım değerleri: 95'in üzerinde. - Bu göstergeyle standart stratejileri bile yükseltmek için birçok fırsat vardır. - PC ve Mobil uyarılarla. Yüksek
EZZ Elite Zig Zag is an indicator for the MetaTrader 4 terminal. This indicator traces the peak of the trend based on the market reversal, thus showing various opportunities in the financial market. EZZ Elite Zig Zag is a visual tool, intuitive, and easy to understand and use.  Test it Yourself by Downloading it for Free. Author Paulo Rocha all rights reserved
Fibonacci retracement and extension line drawing tool Fibonacci retracement and extended line drawing tool for MT4 platform is suitable for traders who use  golden section trading Advantages: There is no extra line, no too long line, and it is easy to observe and find trading opportunities Trial version: https://www.mql5.com/zh/market/product/35884 Main functions: 1. Multiple groups of Fibonacci turns can be drawn directly, and the relationship between important turning points can be seen
TWO PAIRS SQUARE HEDGE METER INDICATOR Try this brilliant 2 pairs square indicator It draws a square wave of the relation between your two inputs symbols when square wave indicates -1 then it is very great opportunity to SELL pair1 and BUY Pair2 when square wave indicates +1 then it is very great opportunity to BUY pair1 and SELL Pair2 the inputs are : 2 pairs of symbols         then index value : i use 20 for M30 charts ( you can try other values : 40/50 for M15 , : 30 for M30 , : 10 for H1 ,
Wave Wolf MT4
Andrei Salanevich
Forex Dalga Kurt MT4 göstergesi, Wolf dalgalarını aramak ve mevcut ticaret terminali penceresinde görüntülemek için tasarlanmıştır. Ticarette Wolfe dalgalarını kullanan tüccarlar için mükemmel bir gösterge. Ticaret stratejilerinde kullanımı, verimliliğini ve karlılığını önemli ölçüde artıracaktır. GÖSTERGE BİLGİSİ Diğer Wolf dalga göstergelerinin aksine, forex Wave Wold MT4 göstergesinin etkinliğini önemli ölçüde artıran birçok özelliği vardır: Birincisi, Açık Windows 5Point (true) ayarı bilg
Heiken Ashi candle chart is an improved version of The Japanese candle chart, which can effectively filter the market "noise" of the Japanese candle chart. It is favored by many traders for its simplicity and intuition. For trend traders, the HA candle chart is a magic tool. Unlike the traditional Japanese candle chart, Heikenashi does not reflect the opening price, high price, low price and closing price of the market. Instead, Heikenashi calculates the value of a single K line in the dominant
Phase Analytics Pro: Advanced Cyclic Market Analyzer Phase Analytics Pro is a sophisticated technical tool designed for traders who prioritize mathematical precision over lag-heavy traditional indicators. Based on the principles of digital signal processing, this indicator decomposes price action into phase and quadrature components to identify the dominant market cycle. How it works: The algorithm calculates the instantaneous phase of the market, allowing it to distinguish between trending and
This is a new strategy for SUPPLY DEMAND areas It is based on a calculation using the tick volume to detect the big price action in market for both bear /bull actions this smart volume action candles are used to determine the supply and demand areas prices in between main supply and demand lines indicate sideway market  up arrows will be shown when prices moves above the main supply and the secondary supply lines Down arrows will be shown when prices moves below the main demand and the secondary
PipFinite Trend PRO
Karlo Wilson Vendiola
4.88 (2251)
Breakthrough Solution For Trend Trading And Filtering With All Important Features Built Inside One Tool! Trend PRO's smart algorithm detects the trend, filters out market noise and gives entry signals with exit levels. The new features with enhanced rules for statistical calculation improved the overall performance of this indicator. Important Information Revealed Maximize the potential of Trend Pro, please visit www.mql5.com/en/blogs/post/713938 The Powerful Expert Advisor Version Automatin
An indicator of pattern #31 ("Long Island") from Encyclopedia of Chart Patterns by Thomas N. Bulkowski. The second gap is in the opposite direction. Parameters: Alerts - show alert when an arrow appears   Push - send a push notification when an arrow appears (requires configuration in the terminal) GapSize - minimum gap size in points ArrowType - a symbol from 1 to 17 ArrowVShift - vertical shift of arrows in points   ShowLevels - show levels ColUp - color of an upward line ColDn - color of a
Crypto_Forex Göstergesi MT4 için "Sabah Yıldızı deseni". - "Sabah Yıldızı deseni" göstergesi Fiyat Hareketi ticareti için çok güçlü bir göstergedir: Yeniden boyama yok, gecikme yok. - Gösterge grafikte boğa Sabah Yıldızı desenlerini algılar: Grafikte mavi ok sinyali (resimlere bakın). - PC, Mobil ve E-posta uyarılarıyla. - Ayrıca kardeşi - ayı "Akşam Yıldızı deseni" göstergesi mevcuttur (aşağıdaki bağlantıyı takip edin). - "Sabah Yıldızı deseni" göstergesi Destek/Direnç Seviyeleriyle birleştir
RSI Speed mp
DMITRII GRIDASOV
Crypto_Forex Göstergesi "RSI SPEED" MT4 için - harika bir tahmin aracı, Yeniden Boyama Yok. - Bu göstergenin hesaplanması fizik denklemlerine dayanmaktadır. RSI SPEED, RSI'nin kendisinin 1. türevidir. - RSI SPEED, ana trend yönündeki girişleri scalping için iyidir. - Uygun trend göstergesiyle birlikte kullanın, örneğin HTF MA (resimlerdeki gibi). - RSI SPEED göstergesi, RSI'nin yönünü ne kadar hızlı değiştirdiğini gösterir - çok hassastır. - Momentum ticaret stratejileri için RSI SPEED gösterg
Title : Market Bias Indicator - Oscillator-Based Trading Tool Introduction : Discover the potential of the "Market Bias Indicator," a revolutionary oscillator-based trading tool designed for precise market analysis. If you're in search of a robust alternative to traditional bias indicators, your quest ends here. Market Bias Indicator offers unparalleled accuracy in identifying market sentiment and is your gateway to confident trading decisions. Recommended Trading Pairs : Market Bias Indicator i
Akendicator X is a Non-repainting Indicator for trading at 5-15 minutes Timeframe.  Akendicator X extimates with clear arrows, in which direction the next candlestick will move. Pratically, when the length of the last candle reaches and exceeds a particular value (called Candle Power) immediately, after its closing, an arrow appears indicating whether the next candle could be Bullish or Bearish. I created a manual in pdf where you should learn exactly how to use AKENDICATOR X correctly; I will s
Cosmic Diviner X Planet
Olena Kondratenko
4 (2)
This unique multi-currency strategy simultaneously determines the strength of trends and market entry points, visualizing this using histograms on the chart. The indicator is optimally adapted for trading on the timeframes М5, М15, М30, Н1. For the convenience of users, the indicator renders the entry point (in the form of an arrow), recommended take profit levels (TP1, TP2 with text labels) and the recommended Stop Loss level. The take profit levels (TP1, TP2) are automatically calculated for
Point61 Indicator
Evgeniy Machok
5 (1)
The Point61 indicator is the result of many years of monitoring of price behavior of currency pairs and metals. It is not a secret, that in times of uncertainty, traders are looking for possible levels of support and resistance - the point, where price should stop its movement. There are 2 possible scenarios at these points: 1. Reverse (correction) to the opposite direction; 2. Breakthrough to continue movement. Very often these points are used to set stop orders - TakeProfit or StopLoss
WaveTrend Oscillator MT4 güçlü bir ticaret göstergesidir ve piyasa analizlerinizi momentum değişimlerini ve potansiyel trend dönüşlerini belirleyerek geliştirmek için tasarlanmıştır. Her seviyeden tüccar için ideal olan bu araç, forex, kripto para birimleri ve emtialar dahil olmak üzere çeşitli piyasalarda aşırı alım ve aşırı satım koşulları hakkında değerli bilgiler sunar. Doğru alım ve satım sinyalleri üretebilme yeteneği ile WaveTrend Oscillator MT4, tüccarların bilinçli kararlar almasını sağ
PZ Harmonacci Patterns
PZ TRADING SLU
3.17 (6)
Trade smarter, not harder: Empower your trading with Harmonacci Patterns This is arguably the most complete harmonic price formation auto-recognition indicator you can find for the MetaTrader Platform. It detects 19 different patterns, takes fibonacci projections as seriously as you do, displays the Potential Reversal Zone (PRZ) and finds suitable stop-loss and take-profit levels. [ Installation Guide | Update Guide | Troubleshooting | FAQ | All Products  ] It detects 19 different harmonic pric
QuantumEdge Trader
Hossam Ali Ahmed Ali
QuantumEdge Trader v1.0 AI-Powered Precision Signals for Serious Traders QuantumEdge Trader is a smart and reliable indicator that delivers accurate BUY and SELL signals using advanced market analysis and trend detection. Designed for M1 to M60 timeframes, it's ideal for scalping and intraday strategies. --- Key Features: No Repaint – Signals never change after appearing Smart trend filters to reduce noise Adjustable sensitivity and alerts Perfect for XAUUSD, EURUSD, and m
URGENCY “Limited launch pricing” “Price increases after version 2.0” Currencies Gold Momentum Flow Dashboard  — See Market Strength Instantly A powerful all-in-one dashboard that shows real-time momentum across multiple timeframes (M5–D1) for forex and gold. Multi-timeframe ROC analysis Built-in trade signals (alignment & momentum shifts) Currency strength meter Heatmap for instant trend recognition Alerts + one-click pair switching Stop switching charts — see the entire market in
HMA Trend Professional MT4
Pavel Zamoshnikov
4.57 (7)
Improved version of the free HMA Trend indicator (for MetaTrader 4) with statistical analysis. HMA Trend is a trend indicator based on the Hull Moving Average (HMA) with two periods. HMA with a slow period identifies the trend, while HMA with a fast period determines the short-term movements and signals in the trend direction. The main differences from the free version: Ability to predict the probability of a trend reversal using analysis of history data. Plotting statistical charts for analyzi
Bu ürünün alıcıları ayrıca şunları da satın alıyor
Neuro Poseidon MT4
Daria Rezueva
4.94 (34)
Neuro Poseidon is a new indicator by Daria Rezueva. It combines precise trading signals with adaptive TP/SL levels - creating best possible trades as a result! Message me and get  Neuro Poseidon Assistant  as a gift to automize your trading process! What makes it stand out? 1. Proven profitability on all assets and timeframes 2. Only confirmed BUY and SELL signals present on the chart 3. Adaptive TP & SL levels generated by the software for each trade 4. Easy to understand - suitable for all
Gann Made Easy
Oleg Rodin
4.84 (165)
Gann Made Easy , bay teorisini kullanarak ticaretin en iyi ilkelerine dayanan, profesyonel ve kullanımı kolay bir Forex ticaret sistemidir. WD Gann. Gösterge, Zararı Durdur ve Kâr Al Seviyeleri dahil olmak üzere doğru SATIN AL ve SAT sinyalleri sağlar. PUSH bildirimlerini kullanarak hareket halindeyken bile işlem yapabilirsiniz. Satın alma işleminden sonra, alım satım talimatlarını ve harika ek göstergeleri ücretsiz olarak almak için lütfen benimle iletişime geçin! Muhtemelen Gann ticaret yöntem
M1 Sniper
Oleg Rodin
5 (24)
M1 SNIPER kullanımı kolay bir işlem göstergesi sistemidir. M1 zaman dilimi için tasarlanmış bir ok göstergesidir. Gösterge, M1 zaman diliminde scalping için bağımsız bir sistem olarak kullanılabilir ve mevcut işlem sisteminizin bir parçası olarak kullanılabilir. Bu işlem sistemi özellikle M1'de işlem yapmak için tasarlanmış olsa da, diğer zaman dilimleriyle de kullanılabilir. Başlangıçta bu yöntemi XAUUSD ve BTCUSD ticareti için tasarladım. Ancak bu yöntemi diğer piyasalarda işlem yaparken de ya
Dynamic Forex28 Navigator
Bernhard Schweigert
4.43 (7)
Dynamic Forex28 Navigator - Yeni Nesil Forex Ticaret Aracı. ŞU ANDA %49 İNDİRİM. Dynamic Forex28 Navigator, uzun zamandır popüler olan göstergelerimizin evrimidir ve üçünün gücünü tek bir göstergede birleştirir: Gelişmiş Döviz Gücü28 Göstergesi (695 inceleme) + Gelişmiş Döviz İMPULS ve UYARI (520 inceleme) + CS28 Kombo Sinyalleri (Bonus). Gösterge hakkında ayrıntılar https://www.mql5.com/en/blogs/post/758844 Yeni Nesil Güç Göstergesi Ne Sunuyor?  Orijinallerde sevdiğiniz her şey, şimdi yeni
Trend Catcher ind
Ramil Minniakhmetov
5 (2)
TREND YAKALAYICI GÖSTERGE Trend Yakalayıcı Gösterge, yazarın tescilli ve özelleştirilmiş uyarlanabilir trend analiz göstergelerinin bir kombinasyonunu kullanarak piyasa fiyat hareketlerini analiz eder. Kısa vadeli gürültüyü filtreleyerek ve temel momentum gücüne, volatilite genişlemesine ve fiyat yapısı davranışına odaklanarak gerçek piyasa yönünü belirler. Ayrıca, hareketli ortalamalar, RSI ve volatilite filtreleri gibi yumuşatma ve trend filtreleme özelleştirilmiş göstergelerinin bir kombina
Bu gösterge, pratik ticaret için mükemmel olan otomatik dalga analizine yönelik bir göstergedir! Dava... Not:   Dalga sınıflandırması için Batılı isimleri kullanmaya alışkın değilim. Tang Lun'un (Tang Zhong Shuo Zen) adlandırma kuralının etkisiyle, temel dalgayı   kalem   , ikincil dalga bandını ise   segment   olarak adlandırdım. aynı zamanda segmentin trend yönü vardır. Adlandırma   esas olarak trend segmentidir   (bu adlandırma yöntemi gelecekteki notlarda kullanılacaktır, öncelikle söyleyey
KT Alpha Hunter Arrows MT4
KEENBASE SOFTWARE SOLUTIONS
Çoğu ok göstergesi size yalnızca bir sinyal verir ve geri kalan her şeyi sizin çözmenizi bekler. KT Alpha Hunter Arrows ise size eksiksiz bir işlem planı sunar. Her sinyal oku, grafikte hazır bir planla birlikte görünür: giriş çizgisi, stop loss, dört take profit seviyesi ve bu sembol ile zaman diliminin o anda işlem yapmaya değer olup olmadığını gösteren canlı edge kararı. Pakete dahil olan Trade Manager EA, siz işleme girdikten sonra yönetimi üstlenir. Böylece piyasa hareketli ve duygusal açıd
Scalper Inside PRO
Alexey Minkov
4.74 (68)
Scalper Inside PRO Scalper Inside PRO is an intraday trend and scalping indicator for MetaTrader 4 that uses an exclusive algorithm to quickly detect market direction and key target levels. It automatically calculates entry, exit and multiple profit targets, and shows detailed performance statistics so you can see how different instruments and strategies performed. This helps you choose the most suitable trading instruments for the current market conditions. Additionally, you can easily integrat
Advanced Supply Demand
Bernhard Schweigert
4.91 (300)
Özel Ticaret –%30 İndirim Yeni Başlayanlar veya Uzman Yatırımcılar İçin En İyi Çözüm! Bu gösterge, bir dizi özel özellik ve yeni bir formül içerdiği için benzersiz, yüksek kaliteli ve uygun fiyatlı bir işlem aracıdır. Bu güncelleme ile çift zaman dilimi bölgeleri gösterebileceksiniz. Sadece daha yüksek bir zaman dilimini değil, hem grafik zaman dilimini hem de daha yüksek zaman dilimini gösterebileceksiniz: İÇ İÇE GEÇMİŞ BÖLGELER GÖSTERİYOR. Tüm Arz Talep yatırımcıları buna bayılacak. :) Önem
PRO Renko Sistemi, RENKO grafikleri ticareti için özel olarak tasarlanmış son derece hassas bir ticaret sistemidir. Bu, çeşitli ticaret araçlarına uygulanabilen evrensel bir sistemdir. Sistemi etkin piyasa sana doğru ters sinyallerine erişim hakkı denilen ses nötralize eder. Göstergenin kullanımı çok kolaydır ve sinyal üretiminden sorumlu tek bir parametreye sahiptir. Aracı, seçtiğiniz herhangi bir ticaret aracına ve renko çubuğunun boyutuna kolayca uyarlayabilirsiniz. Yazılımımla karlı bir
Current event:  https://c.mql5.com/1/326/A2SR2025_NoMusic.gif A. A2SR nedir ?   * Önde gelen bir teknik göstergedir (yeniden boyama yok, gecikme yok). -- Rehberlik : -- https://www.mql5.com/en/blogs/post/734748/page4#comment_16532516 adresinde -- ve https://www.mql5.com/en/users/yohana/blog A2SR, Destek (talep) ve Direnç (arz) seviyelerini belirlemede özel bir tekniğe sahiptir. İnternette gördüğümüz sıradan yoldan farklı olarak A2SR, gerçek SR seviyelerini belirlemede özgün bir konsepte sahi
MetaBands M4
Vahidreza Heidar Gholami
3.5 (6)
MetaBands uses powerful and unique algorithms to draw channels and detect trends so that it can provide traders with potential points for entering and exiting trades. It’s a channel indicator plus a powerful trend indicator. It includes different types of channels which can be merged to create new channels simply by using the input parameters. MetaBands uses all types of alerts to notify users about market events. Features Supports most of the channel algorithms Powerful trend detection algorith
Genesis Matrix Pro is a professional multi-timeframe trend detection indicator designed to help traders identify high-quality market alignment with clarity and structure. It combines 12 different technical indicators into one visual alignment matrix, allowing traders to quickly see when market conditions are bullish, bearish, or neutral. A signal is generated only when the selected strategies are aligned, helping reduce noise and improve decision-making. PLEASE CONTACT ME AFTER PURCHASE TO GET
Bu ürün 2026 piyasası için güncellendi ve en son MT5 sürümleri için optimize edildi. FİYAT GÜNCELLEME BİLDİRİMİ: Smart Trend Trading System şu anda $99 fiyatıyla sunulmaktadır. Sonraki 30 satın alma işleminden sonra fiyat $199 olacaktır. ÖZEL TEKLİF: Smart Trend Trading System satın aldıktan sonra bana özel mesaj gönderin, Smart Universal EA’yı ÜCRETSİZ olarak alın ve Smart Trend sinyallerinizi otomatik işlemlere dönüştürün. Smart Trend Trading System, daha temiz sinyaller, daha iyi trend yönü
Breakout Arrows Mt4
Michael Oko Oboh
5 (1)
Trend Breakout Arrows Indicator The Trend Breakout Arrows Indicator is a momentum-based signal tool designed to identify potential bullish and bearish breakout opportunities. It displays clear arrow signals directly on the price chart, helping traders quickly recognize possible trend changes and continuation setups. Up Arrow (Buy Signal) A magenta up arrow appears below a candle when bullish momentum begins to strengthen. This signal indicates that buying pressure may be overtaking selling press
IQ FX Gann Levels a precision trading indicator based on W.D. Gann’s square root methods . It plots real-time, non-repainting support and resistance levels to help traders confidently spot intraday and scalping opportunities with high accuracy. William Delbert Gann (W.D. Gann) was an exceptional market analyst, whose trading technique was based on a complex blend of mathematics, geometry, astrology, and ancient mathematics which proved to be extremely accurate. Setup & Guide:  Download  MT5 Ver
PZ Swing Trading
PZ TRADING SLU
5 (3)
Protect against whipsaws: revolutionize your swing trading approach Swing Trading is the first indicator designed to detect swings in the direction of the trend and possible reversal swings. It uses the baseline swing trading approach, widely described in trading literature. The indicator studies several price and time vectors to track the aggregate trend direction and detects situations in which the market is oversold or overbought and ready to correct. [ Installation Guide | Update Guide | Tro
Scalper Vault
Oleg Rodin
5 (37)
Scalper Vault , başarılı bir scalping için ihtiyacınız olan her şeyi size sağlayan profesyonel bir scalping sistemidir. Bu gösterge, forex ve ikili opsiyon tüccarları tarafından kullanılabilecek eksiksiz bir ticaret sistemidir. Önerilen zaman çerçevesi M5'tir. Sistem size trend yönünde doğru ok sinyalleri sağlar. Ayrıca size üst ve alt sinyaller ve Gann piyasa seviyeleri sağlar. Göstergeler, PUSH bildirimleri dahil her türlü uyarıyı sağlar. Göstergeyi satın aldıktan sonra lütfen benimle iletişim
Neo Wave PRO
Nikolay Raykov
5 (1)
Price & Time Market Structure Indicator A professional market structure tool that analyzes waves through both price and time — not price alone. Main Description NeoWave PRO is a professional market structure indicator for MetaTrader 4 designed for traders who want to move beyond traditional one-dimensional wave tools such as ZigZag, swing indicators, and basic high/low systems. Most wave indicators analyze only one thing: Price. But a real market wave is not only a price movement. A true wave de
GOLD Impulse with Alert
Bernhard Schweigert
4.67 (12)
Bu gösterge, 2 ürünümüz Advanced Currency IMPULSE with ALERT  +   Currency Strength Exotics  'in süper bir kombinasyonudur. Tüm zaman dilimleri için çalışır ve 8 ana para birimi artı bir Sembol için grafiksel olarak güç veya zayıflık dürtüsünü gösterir! Bu Gösterge, Altın, Egzotik Çiftler, Emtialar, Endeksler veya Vadeli İşlemler gibi herhangi bir sembol için para birimi gücü ivmesini göstermek için uzmanlaşmıştır. Türünün ilk örneğidir, Altın, Gümüş, Petrol, DAX, US30, MXN, TRY, CNH vb. içi
Market Structure Order Block Dashboard MT4, piyasa yapısını ve fiyatın ana tepki bölgelerini doğrudan grafikte okumak isteyen yatırımcılar için tasarlanmış bir MetaTrader 4 göstergesidir. BOS, ChoCH, Order Blocks, Fair Value Gaps (FVG), Likidite, Kill Zones, Volume Profile ve hızlı analiz için kompakt bir gösterge panelini birleştirir. Bu gösterge, piyasa yapısı, ICT ve Smart Money kavramlarını karar çerçevesi olarak kullanan yatırımcılara yöneliktir. Trend devamlarını, olası dönüşleri, fiyat de
" Dynamic Scalper System " göstergesi, trend dalgaları içinde işlem yapmak için scalping yöntemi için tasarlanmıştır. Başlıca döviz çiftleri ve altın üzerinde test edilmiştir, diğer işlem araçlarıyla uyumluluğu mümkündür. Ek fiyat hareketi desteğiyle trend boyunca pozisyonların kısa vadeli açılması için sinyaller sağlar. Göstergenin prensibi. Büyük oklar trend yönünü belirler. Küçük oklar şeklinde scalping için sinyaller üreten bir algoritma trend dalgaları içinde çalışır. Kırmızı oklar yüksel
MT5 sürümü de mevcuttur https://www.mql5.com/tr/market/product/170916 M30/H1/H4 Swing versiyonu mevcut Büyük hareketleri yakalamak mı istiyorsunuz? Gold Signal Swing Pro (M30/H1/H4). Hedef: işlem başına $20-$80+. https://www.mql5.com/en/market/product/177643 KURAMA GOLD SIGNAL PRO (MT4) — 7 Katmanlı Filtre, Otomatik TP/SL ve Kalite Puanı ile Komple XAUUSD Trading Sistemi REPAINT YOK. YENİDEN ÇİZİM YOK. GECİKME YOK. H
PZ 123 Pattern
PZ TRADING SLU
1 (1)
Unlock powerful breakout opportunities The 123 Pattern is one of the most popular, powerful and flexible chart patterns. The pattern is made up of three price points: a bottom, a peak or valley, and a Fibonacci retracement between 38.2% and 71.8%. A pattern is considered valid when the price breaks beyond the last peak or valley, moment at which the indicator plots an arrow, rises an alert, and the trade can be placed. [ Installation Guide | Update Guide | Troubleshooting | FAQ | All Products  ]
Apollo SR Master , Destek/Direnç bölgelerinde alım satımı daha kolay ve güvenilir hale getiren özelliklere sahip bir Destek/Direnç göstergesidir. Gösterge, yerel fiyat zirvelerini ve diplerini tespit ederek Destek/Direnç bölgelerini herhangi bir gecikme olmadan gerçek zamanlı olarak hesaplar. Ardından, yeni oluşan Destek/Direnç bölgesini doğrulamak için, Destek/Direnç bölgesinin dikkate alınabileceğini ve gerçek bir SAT veya AL sinyali olarak kullanılabileceğini gösteren özel bir sinyal gösterir
Sismograf Marketquake Dedektörü. Description in English : https://www.mql5.com/en/market/product/113869?source=Site+Market+Product+Page#description How to use the Seismograph : https://www.mql5.com/en/market/product/113869#!tab=comments&page=2&comment=52806941 Create an EA : https://www.mql5.com/en/market/product/113869#!tab=comments&page=3&comment=52816509 Hangi şekilde işlem yaparsanız yapın, düşük likidite piyasasına girmekten kesinlikle kaçınmak istersiniz.- Sismograf, piyasa rallisin
ŞU ANDA %40INDIRIMLI Yeni Başlayanlar veya Uzman Tüccarlar için En İyi Çözüm! Bu Gösterge benzersiz, yüksek kaliteli ve uygun fiyatlı bir ticaret aracıdır çünkü bir dizi tescilli özellik ve yeni bir formül ekledik. Sadece BİR grafik ile 28 Forex çifti için Döviz Gücünü okuyabilirsiniz! Yeni bir trendin veya scalping fırsatının tam tetik noktasını belirleyebildiğiniz için ticaretinizin nasıl gelişeceğini hayal edin? Kullanım kılavuzu: buraya tıklayın Bu ilk olan, orijinal! Değersiz bir özent
Enigmera
Ivan Stefanov
5 (8)
ENIGMERA: Pazarın Kalbi Önemli: MQL5.com demosu Strategy Tester'da çalışır ve Enigmera'nın tüm işlevlerini tam olarak yansıtmayabilir. Daha fazla bilgi için açıklamayı, ekran görüntülerini ve videoyu kontrol edin. Herhangi bir sorunuz varsa, bana mesaj göndermekten çekinmeyin! Göstergenin kodu tamamen yeniden yazılmıştır. 3.0 sürümü, yeni işlevler ekler ve göstergenin başlangıcından bu yana biriken hataları giderir. Giriş Bu gösterge ve ticaret sistemi, finansal piyasalara dikkat çekici bir ya
Introduction to Fractal Pattern Scanner Fractal Indicator refers to the technical indicator that makes use of the fractal geometry found in the financial market. Fractal Pattern Scanner is the advanced Fractal Indicator that brings the latest trading technology after the extensive research and development work in the fractal geometry in the financial market. The most important feature in Fractal Pattern Scanner is the ability to measure the turning point probability as well as the trend probabi
Trend Lines PRO
Roman Podpora
5 (1)
TREND ÇİZGİLERİ PRO     Piyasanın gerçek yön değişimini anlamaya yardımcı olur. Gösterge, gerçek trend dönüşlerini ve büyük oyuncuların piyasaya yeniden girdiği noktaları gösterir. Anlıyorsun     BOS hatları  Daha yüksek zaman dilimlerindeki trend değişiklikleri ve önemli seviyeler, karmaşık ayarlar veya gereksiz gürültü olmadan gösterilir. Sinyaller yeniden çizilmez ve çubuk kapandıktan sonra grafikte kalır. VERSION MT 5     -    RFI LEVELS PRO  göstergesiyle birlikte kullanıldığında maksimum p
Yazarın diğer ürünleri
ACB Breakout Arrows MT5
KEENBASE SOFTWARE SOLUTIONS
3.5 (2)
ACB Breakout Arrows göstergesi, özel bir kırılma modelini tespit ederek piyasada önemli bir giriş sinyali sağlar. Göstergenin algoritması, fiyatın belirli bir yönde ivme kazandığı anları sürekli olarak tarar ve ana hareketten hemen önce doğru giriş sinyali verir. Çok sembollü ve çok zaman dilimli tarayıcıyı buradan alın - ACB Breakout Arrows MT5 için Tarayıcı Temel Özellikler Gösterge, Stop Loss ve Take Profit seviyelerini otomatik olarak belirler. Tüm zaman dilimlerinde kırılma sinyallerini i
KT Auto Support Resistance Levels: MetaTrader 4/5 için Çoklu Zaman Dilimi S&R, Smart Zones ve Seviye Paneli Swing tepeleri. Pivotlar. Order block’lar. Önceki tepe ve dipler. Her trader piyasayı biraz farklı şekilde işaretler ve bunun bedelini genellikle grafik öder. Tek ekrana yeterince fazla yöntem yığarsanız, grafik artık bir harita olmaktan çıkar. Gürültüye dönüşür. KT Auto Support Resistance Levels bunu çözer. Aylık, haftalık, günlük ve mevcut zaman diliminizi aynı anda tarar, ardından gerçe
ACB Trade Filter MT5
KEENBASE SOFTWARE SOLUTIONS
ACB Trade Filter indicator provides a way to filtering out the low probability trading entries in a trading strategy. The indicator uses a sophisticated filtration algorithm based on the market sentiment and trend. The MT4 version of the same indicator is available here ACB Trade Filter MT4 Applications Works great with our indicator ACB Breakout Arrows MT5 Filter out low probability signals from any indicator. Avoid over-trading and minimize the losses. Trade in the direction of market sentime
KT Heiken Ashi Smoothed MT4
KEENBASE SOFTWARE SOLUTIONS
KT Heiken Ashi Smoothed, standart Heiken Ashi’nin yumuşatılmış sürümüdür; ayrıca trend değişiminde al/sat okları çizer. Durum ayıdan boğaya döndüğünde alım oku çizilir. Durum boğadan ayıya döndüğünde satım oku çizilir. Mobil bildirim, e-posta, ses ve pop-up uyarıları dahildir. Heiken Ashi Smoothed tam olarak nedir? Standart Heiken Ashi’deki yalancı sinyalleri ve gürültüyü iki hareketli ortalama ile filtreleyerek fiyatı yumuşatır. Bir miktar gecikme olsa da, salınım noktalarını ve yeni oluşan t
KT Auto Support Resistance Levels: MetaTrader 4/5 için Çoklu Zaman Dilimi S&R, Smart Zones ve Seviye Paneli Swing tepeleri. Pivotlar. Order block’lar. Önceki tepe ve dipler. Her trader piyasayı biraz farklı şekilde işaretler ve bunun bedelini genellikle grafik öder. Tek ekrana yeterince fazla yöntem yığarsanız, grafik artık bir harita olmaktan çıkar. Gürültüye dönüşür. KT Auto Support Resistance Levels bunu çözer. Aylık, haftalık, günlük ve mevcut zaman diliminizi aynı anda tarar, ardından gerçe
Eğer Forex piyasasında işlem yapıyorsanız, döviz gücü ve döviz çiftleri arasındaki korelasyon hakkında ayrıntılı bilgi sahibi olmak, işlem performansınızı yeni bir seviyeye taşıyabilir. Korelasyon, riskinizi yarıya indirmenize yardımcı olurken, güç analizi kârınızı maksimize etmenizi sağlar. Bu gösterge, döviz gücü analizi ile döviz çiftleri korelasyonunu birleştirerek en uygun döviz çiftlerini seçmek için hibrit bir yaklaşım sunar. Döviz Gücü Analizi Nasıl Kullanılır Örneğin, işlem stratejiniz
KT Asian Breakout
KEENBASE SOFTWARE SOLUTIONS
4 (1)
KT Asian Breakout carefully analyzes the range-bound market during the Asian session and then fires a long or short trade after doing some preassessment based on its inbuilt technical analysis module. The executed orders are closed within a day before the completion of the next day session. The inbuilt technical analysis module checks for the session range and compares it with the last 20 days price movement. If it finds any erratic price movement within the session, the orders are not executed
KT Momentum Arrows MT5
KEENBASE SOFTWARE SOLUTIONS
5 (2)
KT Momentum Arrows göstergesi, belirli bir yönde meydana gelen bant sapması ve ortaya çıkan volatiliteye dayalı olarak hesaplanan ani kırılmalara dayanır. Fiyat üst banda kapanış yaparsa alış sinyali, alt banda kapanış yaparsa satış sinyali üretilir. Tek bir katsayı (Magnitude Coefficient), bant sapması ve volatilite hesaplamasını aynı anda etkiler. Bu değer, kullanılan enstrümana ve zaman dilimine göre dikkatlice seçilmelidir. Temel Özellikler Repaint yok! Momentum odaklı işlem yapanlar için
KT Auto Fibo MT5
KEENBASE SOFTWARE SOLUTIONS
5 (1)
KT Auto Fibo, mevcut trend yönüne göre Fibonacci düzeltme seviyelerini otomatik olarak çizer. En yüksek ve en düşük noktalar, grafikteki mevcut maksimum ve minimum değerler kullanılarak otomatik olarak seçilir. Fibonacci seviyelerini buna göre ayarlamak için grafiği yakınlaştırabilir, uzaklaştırabilir ve kaydırabilirsiniz. Modlar Otomatik:  Grafik alanına göre Fibonacci seviyelerini otomatik olarak çizer. Manuel: Fibonacci seviyelerini yalnızca bir kez çizer. Daha sonra, bağlantı noktalarını ma
KT Heiken Ashi Smoothed MT5
KEENBASE SOFTWARE SOLUTIONS
KT Heiken Ashi Smoothed, standart Heiken Ashi’nin yumuşatılmış sürümüdür; ayrıca trend değişiminde al/sat okları çizer. Durum ayıdan boğaya döndüğünde alım oku çizilir. Durum boğadan ayıya döndüğünde satım oku çizilir. Mobil bildirim, e-posta, ses ve pop-up uyarıları dahildir. Heiken Ashi Smoothed tam olarak nedir? Standart Heiken Ashi’deki yalancı sinyalleri ve gürültüyü iki hareketli ortalama ile filtreleyerek fiyatı yumuşatır. Bir miktar gecikme olsa da, salınım noktalarını ve yeni oluşan t
KT Psar Arrows
KEENBASE SOFTWARE SOLUTIONS
KT Psar Arrows, standart Parabolic SAR göstergesini kullanarak grafikte oklar çizer. Mumun en yüksek noktası SAR'a temas ettiğinde yükseliş oku çizilir. Mumun en düşük noktası SAR'a temas ettiğinde düşüş oku çizilir. Sinyaller, mum kapanışını beklemeden gerçek zamanlı olarak üretilir.  Özellikler Parabolic SAR göstergesini kullanan ticaret stratejilerini denemek isteyen yatırımcılar için faydalı bir araçtır.  Piyasadaki dönüş noktalarını bulmak için kullanılabilir. Özel PSAR girişlerini destekl
KT Round Numbers MT5
KEENBASE SOFTWARE SOLUTIONS
KT Round Numbers plots the round number levels which are also commonly known as psychological levels in the Forex world. In the context of Forex trading, round number levels are those levels in which there are two or more zeroes at the end. They are named as 00 levels on the chart. Some traders also consider the halfway points as a valid round number level. They are named as 50 levels on the chart. Use of round number levels in trading Round number levels work as strong support and resistance
ACB Breakout Arrows
KEENBASE SOFTWARE SOLUTIONS
4.15 (34)
ACB Breakout Arrows göstergesi, özel bir kırılma modelini tespit ederek piyasada kritik bir giriş sinyali sağlar. Gösterge, belirli bir yönde güçlenen momentumu sürekli tarar ve büyük bir hareket başlamadan hemen önce doğru giriş sinyalini verir.  Çoklu sembol ve çoklu zaman dilimi tarayıcıyı buradan edinin - ACB Breakout Arrows MT4 için Tarayıcı Temel Özellikler Gösterge, Stop Loss ve Take Profit seviyelerini otomatik olarak sağlar. Tüm zaman dilimlerinde kırılma sinyallerini takip eden MTF Ta
ACB Trade Filter MT4
KEENBASE SOFTWARE SOLUTIONS
5 (1)
The ACB Trade Filter indicator provides a solution for filtering out the low probability trading setups in a trading strategy. The indicator uses a sophisticated filtration algorithm based on the market sentiment and trend. Applications Works great with our indicator " ACB Breakout Arrows ". Filter out low probability signals from any indicator. Avoid overtrading and minimize the losses. Trade in the direction of market sentiment and trend. Avoid the choppiness in the market. How to use Only L
KT Momentum Arrows
KEENBASE SOFTWARE SOLUTIONS
KT Momentum Arrows göstergesi, belirli bir yönde meydana gelen bant sapması ve ortaya çıkan volatiliteye dayalı olarak hesaplanan ani kırılmalara dayanır. Fiyat üst banda kapanış yaparsa alış sinyali, alt banda kapanış yaparsa satış sinyali üretilir. Tek bir katsayı (Magnitude Coefficient), bant sapması ve volatilite hesaplamasını aynı anda etkiler. Bu değer, kullanılan enstrümana ve zaman dilimine göre dikkatlice seçilmelidir. Temel Özellikler Repaint yok! Momentum odaklı işlem yapanlar için
KT COG Advanced MT4
KEENBASE SOFTWARE SOLUTIONS
1 (1)
KT COG is an advanced implementation of the center of gravity indicator presented by John F. Ehlers in the May 2002 edition of Technical Analysis of Stocks & Commodities magazine. It's a leading indicator which can be used to identify the potential reversal points with the minimum lag. The COG oscillator catches the price swings quite effectively. MT5 version of the same indicator is available here KT COG Advanced MT5 Calculation of COG The COG indicator is consist of the two lines. The main l
KT Pin Bar
KEENBASE SOFTWARE SOLUTIONS
KT Pin Bar identifies the pin bar formation which is a type of price action pattern which depicts a sign of reversal or rejection of the trend. When combined with support and resistance, BRN and other significant levels, Pin Bar pattern proved to be a very strong sign of reversal. Basically, a pin bar is characterized by a small body relative to the bar length which is closed either in upper or lower 50% part of its length. They have very large wicks and small candle body. A pin bar candlestic
KT Trend Magic
KEENBASE SOFTWARE SOLUTIONS
KT Trend Magic shows the trend depiction on chart using the combination of market momentum and volatility. A smoothing coefficient is used to smooth out the noise from the signal.It can be used to find out the new entries or confirm the trades produced by other EA/Indicators. Usage Drag n drop MTF scanner which scans for the new signals across multiple time-frames. Find new entries in the trend direction. Improve the accuracy of other indicators when used in conjunction. Can be used as a dynami
KT Auto Fibo
KEENBASE SOFTWARE SOLUTIONS
KT Auto Fibo, mevcut trend yönüne göre Fibonacci düzeltme seviyelerini otomatik olarak çizer. En yüksek ve en düşük noktalar, grafikteki mevcut maksimum ve minimum değerler kullanılarak otomatik olarak seçilir. Fibonacci seviyelerini buna göre ayarlamak için grafiği yakınlaştırabilir, uzaklaştırabilir ve kaydırabilirsiniz. Modlar Otomatik:  Grafik alanına göre Fibonacci seviyelerini otomatik olarak çizer. Manuel: Fibonacci seviyelerini yalnızca bir kez çizer. Daha sonra, bağlantı noktalarını ma
KT Ichimoku Trader
KEENBASE SOFTWARE SOLUTIONS
1 (1)
KT Ichimoku Trader is a fully automated expert advisor that offers five popular trading strategies based on the Ichimoku indicator. Each strategy has it's own entry and exit method without any interference to other strategies. The Ichimoku system can be applied to all major currency pairs and metals. However, we found that it performs reasonably well mainly on two pairs.   MT5 Version is available here  https://www.mql5.com/en/market/product/35043 Features Trade up to 5 famous trading strategi
KT Volatility Oscillator
KEENBASE SOFTWARE SOLUTIONS
KT Volatilite Osilatörü, geçmiş ve mevcut piyasa verilerini matematiksel bir formül kullanarak analiz eder ve sonucu bir osilatör formunda gösterir. Yükselen ve azalan dalgalar, varlığın yüksek ve düşük volatilitesine karşılık gelir.  Kısaca, volatilite bir varlığın belirli bir zaman diliminde fiyat dalgalanmalarının ölçüsüdür. Volatilite olmasaydı, piyasada çok az hareket olurdu ve traderlar fiyat değişimlerinden kazanç sağlayamazdı. Forex Piyasasında Volatilite Kullanımı Forex piyasasında vol
KT COG Robot
KEENBASE SOFTWARE SOLUTIONS
KT COG Robot is a fully automated Expert Advisor based on the KT COG Indicator . The COG indicator was originally presented by John F. Ehlers in the May 2002 edition of Technical Analysis of Stocks & Commodities magazine. The EA fires a long trade when COG line cross above the signal line and a short trade is fired when the COG line cross below the signal line.  Adaptive Filtration Our adaptive filtration algorithm combines the original COG formula with the major trend direction and market acce
ACB Breakout Arrows EA
KEENBASE SOFTWARE SOLUTIONS
Bu, özel olarak geliştirdiğimiz "ACB Breakout Arrows" adlı göstergemize dayalı %100 otomatik bir uzman danışmandır. Girişler, iki yönlü olarak sık sık oluşan bir kırılma modeline dayanır. Giriş sinyallerinin şiddeti, "Signal Sensitivity" adlı harici girişle ayarlanabilir. İşlem Onayı ACB Breakout Arrows EA, başka bir özel göstergemiz olan ACB Trade Filter kullanılarak girişleri filtreleme yeteneği sunar. Güçlü Al: Yukarı ok + Yeşil histogram + Yükseliş trendi Güçlü Sat: Aşağı ok + Kırmızı hist
KT London Breakout
KEENBASE SOFTWARE SOLUTIONS
First thirty minutes are essential for a trading session. The early reaction of traders and market players sets a path for the rest of the day. KT London Breakout EA takes advantage of this phenomenon, and after analyzing the first thirty minutes of London session, it places two bidirectional pending orders. One of pending order is eventually canceled after realizing the market direction with certainty. It has been strictly tested and developed for EUR/JPY using 30-Min Time Frame. You can expe
MACD Divergence Seeker
KEENBASE SOFTWARE SOLUTIONS
KT MACD Divergence Seeker trades the regular and hidden divergence signals generated by our free indicator named KT MACD Divergence indicator. Trading the standalone divergences can be a risky affair that's why the KT MACD Divergence Seeker combines the standard divergence signals with an advanced analysis module to exploit the price inefficiencies on some FX pairs. What is the Divergence exactly? As a general conception if the price is making higher highs, then macd should also be making hig
KT Asian Breakout Indicator
KEENBASE SOFTWARE SOLUTIONS
KT Asian Breakout göstergesi, Asya seansının kritik bir bölümünü analiz ederek fiyatın kırılma yönüne göre çift yönlü alım ve satım sinyalleri üretir. Fiyat seansın en yüksek seviyesini kırarsa alım sinyali oluşur, en düşük seviyesini kırarsa satış sinyali oluşur. Dikkat Edilmesi Gerekenler Eğer seans kutusu dikey olarak çok genişse, yeni bir işlemden kaçınılmalıdır çünkü fiyat hareketlerinin büyük bir kısmı zaten bu kutu içinde gerçekleşmiştir. Eğer kırılma mumu çok büyükse, fiyat genellikle s
MACD Divergence MT4
KEENBASE SOFTWARE SOLUTIONS
KT MACD Divergence, fiyat ile osilatör arasında oluşan düzenli ve gizli uyumsuzlukları gösterir. Eğer ticaret stratejinizde trend dönüşü bekleniyorsa, potansiyel dönüş noktalarını belirlemek için MACD’nin düzenli uyumsuzluğunu kullanabilirsiniz. Trendin devamına dayalı stratejilerde ise MACD’nin gizli uyumsuzluğu daha uygun bir tercih olacaktır. KT MACD Divergence'nın Sınırlamaları MACD uyumsuzluğunu tek başına giriş sinyali olarak kullanmak riskli olabilir. Her uyumsuzluk mutlaka bir trend dö
KT Bollinger Bands Trader MT4
KEENBASE SOFTWARE SOLUTIONS
KT Bollinger Bands Trader, düşük volatilite dönemlerinde Bollinger Bantlarını kullanarak ortalamaya dönüş stratejisi uygulayan %100 otomatik bir uzman danışmandır (Expert Advisor). Fiyat genellikle Bollinger Bantlarının üst veya alt çizgisine tepki verir, ancak her zaman bir dönüş gerçekleşmez. Bununla birlikte, düşük volatilite dönemlerinde fiyat dönüşü olasılığı daha yüksektir. Girişler Fiyat Bollinger Bantlarının alt çizgisinin altına doğru şekilde hizalandığında alış işlemi başlatılır. Fiya
KT CCI Divergence MT4
KEENBASE SOFTWARE SOLUTIONS
KT CCI Divergence shows the regular and hidden divergence created between the price and CCI oscillator. Divergence is one of the vital signals that depicts the upcoming price reversal in the market. Manually spotting the divergence between price and CCI can be a hectic and ambiguous task. Limitations of KT CCI Divergence   Using the CCI divergence as a standalone entry signal can be risky. Every divergence can't be interpreted as a strong reversal signal. For better results, try to combine it w
KT MA Crossover MT4
KEENBASE SOFTWARE SOLUTIONS
KT MA Crossover, seçilen hareketli ortalamaların kesişimine göre alım ve satım oklarını çizer. Ayrıca her ardışık sinyal için uygun uyarıları üretir ve MFE (En Avantajlı Sapma) değerini görüntüler. Hareketli ortalama kesişimi, dünya çapında trader'lar tarafından yaygın olarak kullanılan temel stratejilerden biridir. Genellikle biri hızlı, diğeri yavaş olmak üzere iki hareketli ortalamadan oluşur ve kesişim yönüne göre alım ya da satım sinyali üretir. Alım sinyali – hızlı MA, yavaş MA'nın üzerin
Filtrele:
Değerlendirme yok
Değerlendirmeye yanıt