Long island reversal
- Indicateurs
-
Dmitry Fedoseev
 Новый вариант эксперта exp_iCustom - exp_iCustomNew в маркете: https://www.mql5.com/ru/market/product/5660
 - Version: 1.1
- Mise à jour: 19 juin 2021
- Activations: 5
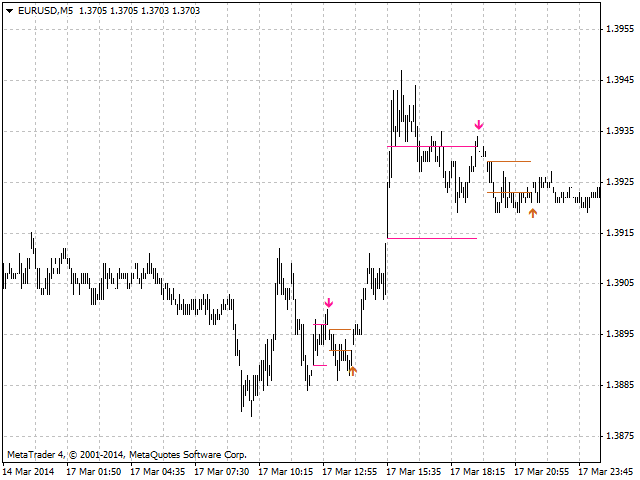
An indicator of pattern #31 ("Long Island") from Encyclopedia of Chart Patterns by Thomas N. Bulkowski. The second gap is in the opposite direction.
Parameters:
- Alerts - show alert when an arrow appears
- Push - send a push notification when an arrow appears (requires configuration in the terminal)
- GapSize - minimum gap size in points
- ArrowType - a symbol from 1 to 17
- ArrowVShift - vertical shift of arrows in points
- ShowLevels - show levels
- ColUp - color of an upward line
- ColDn - color of a downward line
- Auto5Digits - automatic multiplication of ArrowVShift and GapSize by 10 when working with 5 and 3 digit quotes.
Note. Arrows appear on a forming bar and can disappear during bar formation. Notification (Alerts and Push) are generated based on a formed bar.
It cannot be guaranteed that the indicator recognizes the patterns exactly as implied by the author.
Recommended optimization parameters: GapSize.