 MetaTrader 5
 Experts
 Indicateurs
 Scripts
 Bibliothèque
 Stockage
Voir comment télécharger gratuitement des robots de trading
Retrouvez-nous sur Twitter !
Rejoignez notre page de fans
Rejoignez notre page de fans
Vous avez aimé le script ? Essayez-le dans le terminal MetaTrader 5

Script for Calculation of Candle Statistics - script pour MetaTrader 5

- Vues:
- 18063
- Note:
- Publié:
- Mise à jour:
-
 Vous manquez des opportunités de trading :
- Applications de trading gratuites
- Plus de 8 000 signaux à copier
- Actualités économiques pour explorer les marchés financiers
Inscription Se connecterVous acceptez la politique du site Web et les conditions d'utilisation
Si vous n'avez pas de compte, veuillez vous inscrire -
 Besoin d'un robot ou d'un indicateur basé sur ce code ? Commandez-le sur Freelance
Aller sur Freelance
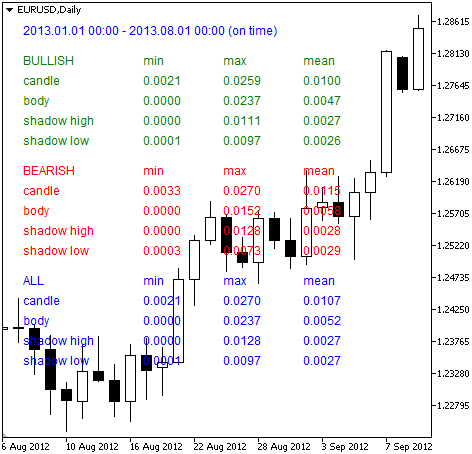
The script calculates candle statistics (the minimal, maximal and average values of candles body and shadows) of the current chart.
The calculated statistics is shown for 3 groups (bullish, bearish and all) of candles in the upper left corner of the chart.
The calculation interval depends on 5 first input parameters (the interval also can be selected with two vertical lines with names, defined in input parameters).
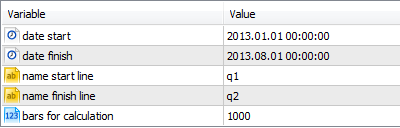
How does it work:
- If there isn't any vertical lines (with names, defined by "start line" and "name finish line" inputs) and "bars for calculation"=0 - the start and finish dates are defined by values, specified in "date start" and "date finish" input parameters.
- If chart contains the vertical lines with names, defined by "start line" and "name finish line" inputs and bars for calculation=0 - the start and finish dates are defined by values, depending on time properties of these vertical lines.
- If bars for calculation > 0, it calculates the specified number of bars -1 (the current uncompleted bar is not used in calculations).
*If chart contains only one line ("name start line" or "name finish line"), or start time> finish time or bars for calculation< 0 - the script does nothing and finish its work.
Other input parameters:
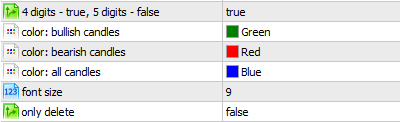
- Digits, 4 or 5 (used in normalization and string formatting);
- Colors of groups;
- Font size;
- Delete text labels from the chart (if true, the script only deletes the labels and does calculate nothing).
The code has comments.
Traduit du russe par MetaQuotes Ltd.
Code original : https://www.mql5.com/ru/code/1842
 Clock-Indiсator
The indicator shows the current date, time, the current spread and stop levels.
ChartChanger
The script is assigned to a hot key for quick change of charts around in a circle.
Awesome Oscillator Divergence
This indicator will plot divergence lines on the Awesome_Oscillator indicator and will give buy and sell signal by displaying arrows.
 IREA
IREA is an automated trade algorithm based on the idea of that an unusual impact in price changes will be adjusted by an inverse movement.