Rejoignez notre page de fans
- Vues:
- 15412
- Note:
- Publié:
- Mise à jour:
-
Besoin d'un robot ou d'un indicateur basé sur ce code ? Commandez-le sur Freelance Aller sur Freelance
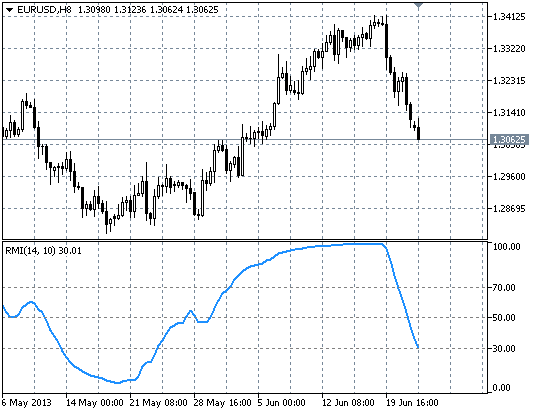
The difference from RSI is that it uses price change for a specified period (i.e. the momentum) instead of the price changes of two adjacent bars. The rest of the calculations are similar to RSI. The indicator was developed by Roger Altman and was first published in February 1993 in the Technical Analysis of Stocks & Commodities magazine.
Parameters:
- RMI Period - the period of RMI.
- Momentum Period - the period of momentum (with the value 1 the indicator is identical to RSI).
Interpretation of the signal is the same as that of the relative strength index:
- The tops and bottoms of the indicator are a little ahead of the formation of local price maximums and minimums.
- Graphical patterns (head and shoulders, etc.) that are not easy to recognize on price charts.
- Divergence.

Traduit du russe par MetaQuotes Ltd.
Code original : https://www.mql5.com/ru/code/1786
 RSIImproved
A combined indicator, constructed on the basis of two RSI oscillators
 Trend Score
A simple trend indicator based on counting of the number of bullish and bearish candlesticks.
 ImpulseOsMA
The indicator draws bars based on Elder's impulse system.
 Levels
Another version of the indicator that calculates support/resistance levels.