Rejoignez notre page de fans
- Vues:
- 6101
- Note:
- Publié:
- Mise à jour:
-
Besoin d'un robot ou d'un indicateur basé sur ce code ? Commandez-le sur Freelance Aller sur Freelance
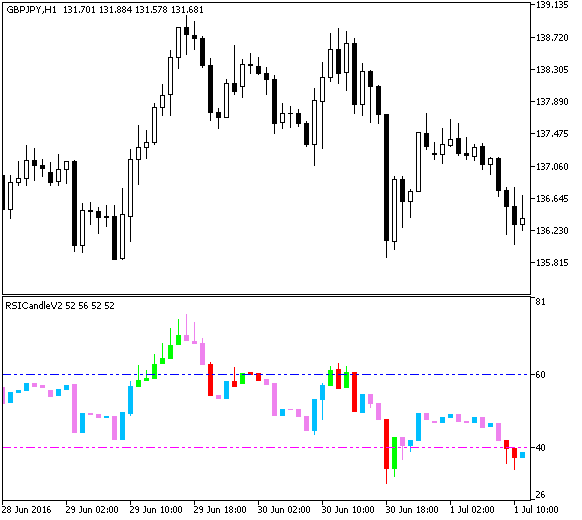
The RSI indicator implemented as candlesticks with indication of breaking the overbought and oversold areas. Candlesticks appear as a result of relevant price timeseries processed by the RSI algorithm. In many situations, such approach may be more informative for the purpose of analysis.
If the growing candle has a High above the overbought level, then it is painted in dark blue. If the growing candle crosses the oversold level or touches it from above, its color will also be painted in dark blue. Similarly, the opposite is for falling candles in bright red color. In other cases, the color of candles is pale.

Fig.1. The RSICandleV2 indicator
Traduit du russe par MetaQuotes Ltd.
Code original : https://www.mql5.com/ru/code/16202
 FloatPivot_Digit
The FloatPivot indicator with the color filling inside the channel, drawn as a cloud, with the display of the last values as price labels and the possibility to round the channel levels up to a required number of digits.
 FloatPivot_HTF
The FloatPivot indicator with the timeframe selection option available in input parameters.
 BalanceOfPower_Histogram_HTF
The BalanceOfPower_Histogram indicator with the timeframe selection option available in input parameters.
 Exp_BalanceOfPower_Histogram
The Exp_BalanceOfPower_Histogram Expert Advisor is based on change of direction of the BalanceOfPower_Histogram indicator.