Rejoignez notre page de fans
- Vues:
- 9200
- Note:
- Publié:
- Mise à jour:
-
Besoin d'un robot ou d'un indicateur basé sur ce code ? Commandez-le sur Freelance Aller sur Freelance
The real author:
darmasdt
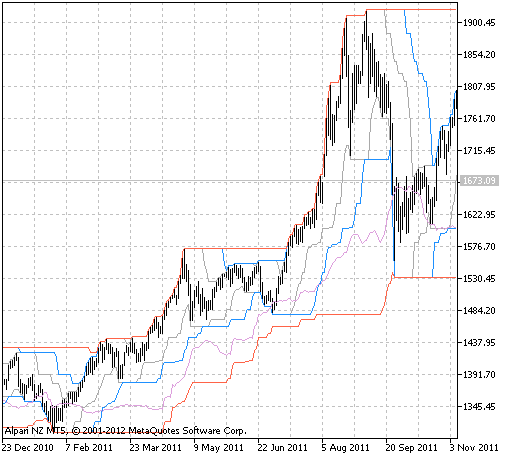
The market volatility indicator. It calculates stop loss and draws price channel. According to the instructions the red line shows where to place stop loss when opening a new order in this place.
This indicator was first implemented in MQL4 and published in Code Base at mql4.com on 19.10.2007.

Fig.1 The channel_breakout_entry indicator
Traduit du russe par MetaQuotes Ltd.
Code original : https://www.mql5.com/ru/code/1451
 Exp_SuperWoodiesCCI
The trading system drawn on the basis of the signals of the SuperWoodiesCCI indicator
 Support Vector Machine Indicator
This indicator uses support vector machines to analyse indicator data and signal future trades. Buy trades are signalled by a green ‘up’ arrow with sell trades signalled by a red ‘down’ arrow.
 Universal Oscillator
The Universal Oscillator indicator can display Bears Power, Bulls Power, CCI, DeMarker, MACD, Momentum, RSI, Stochastic, William's Percent Range. Three modes of overbought / oversold levels: the constant, dynamic (MA), dynamic (Bollinger Bands). Three rendering mode: line, filling, histogram
 Linear Sinus FT
The mathematical indicator that operates on the principle of approximation of sinusoid waves and realizes visualization of Fourier series for currency pair quotes