Rejoignez notre page de fans
- Vues:
- 25073
- Note:
- Publié:
- Mise à jour:
-
Besoin d'un robot ou d'un indicateur basé sur ce code ? Commandez-le sur Freelance Aller sur Freelance
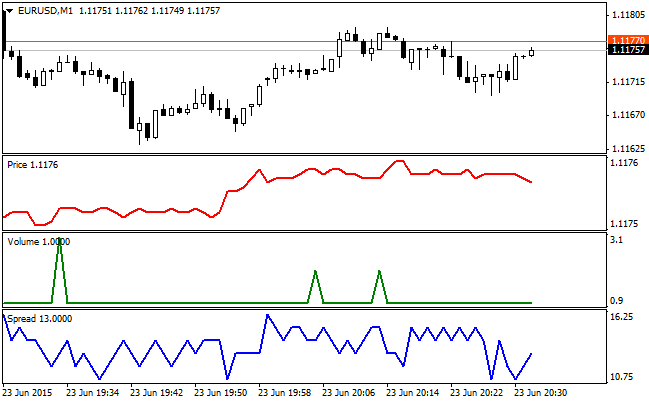
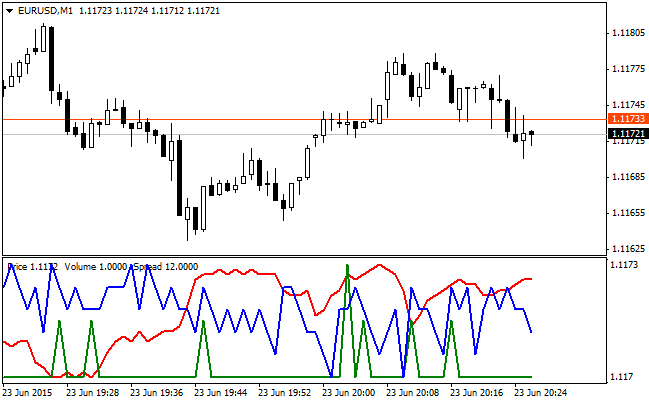
The indicator displays the tick chart of the price, spread or volume.
It is possible to save the tick data in a file which can later be opened in Excel or another program.
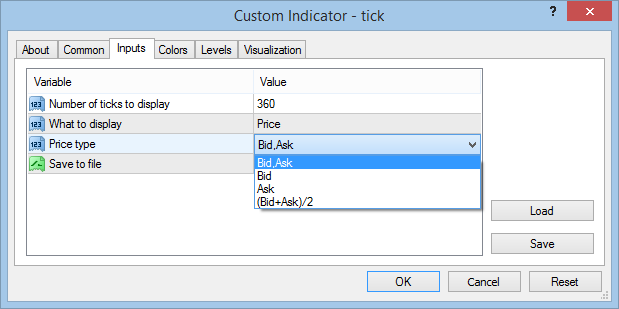
Input Parameters:


Traduit du russe par MetaQuotes Ltd.
Code original : https://www.mql5.com/ru/code/12891
 Expert Advisor based on the rollback from the MA channel boundary
The Moving Average indicator data is used for trading. If the price goes away from the Moving Average by a certain number of points, then an order is placed in the direction of the Moving Average line.
 RSI Bollinger Bands EA
RSI Bollinger Bands are used to establish overbought and oversold RSI regions for generation of short and long trading signals.
 Grid
Grid
Arrangement of the pending orders at equal intervals (steps).
 ID Lite Info MA
The indicator displays the values of the Moving Averages (MA), deltas between the values and deltas between МАs.