 MetaTrader 5
 Experts
 Indicateurs
 Scripts
 Bibliothèque
 Stockage
Voir comment télécharger gratuitement des robots de trading
Retrouvez-nous sur Facebook !
Rejoignez notre page de fans
Rejoignez notre page de fans
Vous avez aimé le script ? Essayez-le dans le terminal MetaTrader 5

Expert Advisor based on the rollback from the MA channel boundary - expert pour MetaTrader 4

- Vues:
- 15107
- Note:
- Publié:
- Mise à jour:
-
 Vous manquez des opportunités de trading :
- Applications de trading gratuites
- Plus de 8 000 signaux à copier
- Actualités économiques pour explorer les marchés financiers
Inscription Se connecterVous acceptez la politique du site Web et les conditions d'utilisation
Si vous n'avez pas de compte, veuillez vous inscrire -
 Besoin d'un robot ou d'un indicateur basé sur ce code ? Commandez-le sur Freelance
Aller sur Freelance
The Moving Average indicator data is used for trading. If the price goes away from the Moving Average by a certain number of points, then an order is placed in the direction of the Moving Average line.
The EA can make profit, but only a small one. It also requires a large deposit.
Idea of this EA was mine. The code of the EA was written by Sergey Diubakin.
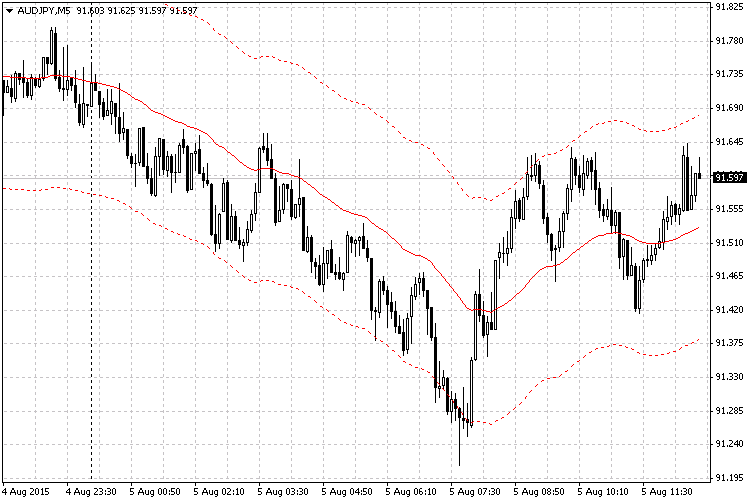
The solid red line on the figure is the value of the Moving Average indicator, the dotted red line is the boundary of the channel (Range), which is calculated using the indicator value, and at the crossing of which a corresponding order is opened.
At the lower boundary of the channel (Range) the EA opens a Buy order, at the upper boundary — Sell order.
In order for the EA to open a Buy or Sell order on a candlestick/bar that touches the channel boundary (Range), the High or Low of the previous candlestick/bar (the "first" bar that precedes the "zero" bar) must be below/above the Range level: the High of the "first" bar must be below the upper boundary of the Range level o open a Sell order, the Low of the "first" bar must be above the lower boundary of the Range level to open a Buy order.
Also this EA additional plug-in modules: Turn, Step Down and Trade Time.
- The Turn module — places limit orders at the Stop Loss level of the main order in the opposite direction. I thought that this module would be helpful in the case when the price keeps moving away from the MA line once reaching the channel boundary.
- The Step Down module — places additional order in the direction of the main order. This module was used in another Expert Advisor.
- The Trade Time module — sets the time interval for the EA to trade (does not apply to the orders of the Step Down module).
Expert Advisor Settings:
Moving Average
- Period – parameter from the Moving Average indicator menu.
- Shift – parameter from the Moving Average indicator menu.
- Method MA – parameter from the Moving Average indicator menu.
- Apply to – parameter from the Moving Average indicator menu.
- Range – the distance (measured to the above and below) from the Moving Average indicator value at this point in time. Once the price reaches the Range level, the EA can open the first main order.
Initial lot
- LotConst_or_not – allows the user to choose whether to start trading with the same lot or to recalculate the initial lot depending on the changes of the deposit:
true – the first lot will be fixed and equal to the value of Lots specified below.
false – the first lot will change dynamically with the deposit changes and will depend on the RiskPercent parameter and the deposit size.
Lots = AccountBalance() * (RiskPercent / 100.0) / 10000.0 - Lots – sets the initial trading lot.
- RiskPercent – sets the initial trading lot depending on the deposit.
- LotConst_or_not – allows the user to choose whether to start trading with the same lot or to recalculate the initial lot depending on the changes of the deposit:
Take Profit – profit level of an order (specified in points of the chart the EA is attached to).
Stop Loss – loss level of an order (specified in points of the chart the EA is attached to).
Trailing stop – automatically moved Stop Loss level.
- true – module is activated (enabled);
- false – module is deactivated (disabled).
Module Turn
- true – module is activated (enabled);
- false – module is deactivated (disabled).
- Turn – distance after which an opposite pending order is placed.
- LotMultiplicator – lot increase ratio.
- Turn_TakeProfit – profit level of an order which will be opened using this module (specified in points of the chart the EA is attached to).
Module Step Down
- true – module is activated (enabled);
- false – module is deactivated (disabled).
- Step Down – distance (gap) between the opened orders in the order grid, which is placed against the "trend".
Module Trade time
- true – module is activated (enabled);
- false – module is deactivated (disabled).
- Open trade – time, starting from which the EA may open the first main order, if there is a signal.
- Close trade – time, after which the EA can not open the first main order.
Magic (Magic Number) – the program code of the EA, which allows it to distinguish its own orders from others.
Logo and data output – the module allows to enable/disable the table (earnings today, yesterday etc.):
- true – module is activated (enabled);
- false – module is deactivated (disabled).
Time frame – program code, which allows to specify the time frame of the chart for the EA to use for trading.
- Current – the time frame, which is specified in the terminal.
- M1, M5, M15, M30, H1, H4, D1, W1, MN1 – fixed time frames.
Traduit du russe par MetaQuotes Ltd.
Code original : https://www.mql5.com/ru/code/12375
RSI Bollinger Bands EA
RSI Bollinger Bands are used to establish overbought and oversold RSI regions for generation of short and long trading signals.
ScalpWiz 9001
Trades on price spikes around important financial announcements.
 Tick Chart
Tick chart of the price/spread/volume. Saves tick data in a file.
Grid
Arrangement of the pending orders at equal intervals (steps).