Rejoignez notre page de fans
- Vues:
- 12338
- Note:
- Publié:
- Mise à jour:
-
Besoin d'un robot ou d'un indicateur basé sur ce code ? Commandez-le sur Freelance Aller sur Freelance
Original author:
GoldnMoney
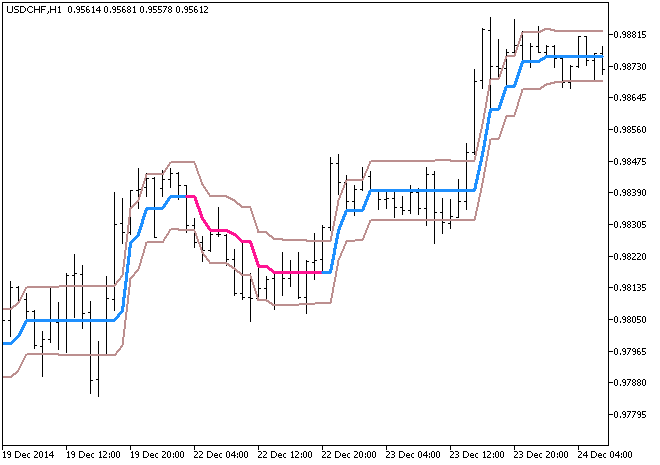
Ozymandias is a well known indicator which filters false price fluctuations.
This indicator displays a blue-red line around the price range. There is also a price band which shows whether the market is oversold or overbought. The colored line in its turn shows the average price value. The blue line means you should look for entry points to buy (only if the market is not overbought). If the color has been changed to red, then you should open a short position (if the indicator doesn't show the oversold market).
Please note that the Ozymandias indicator can be used only to determine the appropriate time for exiting or entering the market. A trend change on this indicator is not a signal.

Fig. 1. The Ozymandias indicator
Traduit du russe par MetaQuotes Ltd.
Code original : https://www.mql5.com/ru/code/12542
 Exp_FisherCyberCycle
The Exp_FisherCyberCycle expert advisor is based on the signals generated by the FisherCyberCycle oscillator.
 KeyFinder 2.0
This script finds DeMark pivot points, displays them on the chart and indicates their dimensions.
 ExtremLine
A simple trend indicator.
 ind_aMU
The indicator shows trend and side (flat) price movements.